BigFoot Pilot Study: Test of the Vegetation Cover Component Characterization System (3CS)
←
→
Page content transcription
If your browser does not render page correctly, please read the page content below
BigFoot Pilot Study:
Test of the Vegetation Cover Component
Characterization System (3CS)
Warren B. Cohen, Polly Thornton and Tom K. Maiersperger
Introduction
BigFoot objectives require that we accurately characterize fractions of vegetation cover components at
all four sites. Doing so facilitates several subsequent characterizations and analyses. Foremost among
these is the provision of cover maps based on ETM+ data that provide building blocks for a variety
of prescribed land cover classication systems. The BigFoot exible land cover classication system
enables our cover data layers to be compared with many alternate cover classications developed by
others for the same study sites. To accomplish the goal of providing fractional characterizations of
cover components at each site we developed the Vegetation Cover Component Characterization System
(3CS). In the summer and early autumn of 1999 we conducted a pilot study to test the system. Field
sampling is expensive, especially over four 25 km2 sites. Consequently, for BigFoot, we had to devise
a sampling strategy that would take full advantage of data from a limited number of plots. This meant
utilizing the spatial domain, in combination with modeling and more classical statistical analyses
involving the plot-level data. The sampling strategy we use (see Figure 1) involves measurements at
100 plots, 80 of which are arranged as a nested spatial series (Clinger and Van Ness 1976). Within
each plot, several types of measurements, described in the BigFoot Field Manual are made at several
points from which plot-level means are calculated. For most biophysical measurements (e.g., LAI,
biomass, NPP) protocols were developed in other studies (Gower et al. 1999), but for characterizing
cover fractions using 3CS there was no precedent. Critical to the accurate characterization of cover
components within a plot is the number of photo samples required.
An additional consideration for the sampling scheme was
the apparent cost of misregistration. To develop the BigFoot
ne-grained data surfaces of land cover, LAI, and NPP, it
is imperative that the plot measurements be accurately
aligned with the ETM+ imagery, and that any error associ-
ated with the misregistration of these measurement sets
be assessed. Over the relatively at terrain of the BigFoot
sites, misregistration of ETM+ imagery, on average, will
likely be on the order of one pixel or less. Each BigFoot plot
is 25 m on a side and we are resampling the ETM+ data to
that same resolution. To insure that the eld plots are geo-
referenced as accurately as possible, they were positioned
using a GPS with real-time correction and accurate to the
nearest 0.1 m. To assess the apparent cost of misregistra-
tion we focused on the vegetation cover component frac-
tions. As these represent the most fundamental properties
of the system, if misregistration is likely to be an issue, it
should be expressed most prominently in this dataset.
Figure 1, BigFoot Sampling Strategy
Design
The rst two sites to be characterized were NOBS (7-12 July) and AGRO (10 September). For these two
sites, the design on the left side of Figure 2 below was used. For each cell in the 3 x 3 cell group (or
test plot) we sampled four points spaced evenly across each cell within the test plot, as shown. Twelve
Cohen et al. - 15 June 2000 - Page 1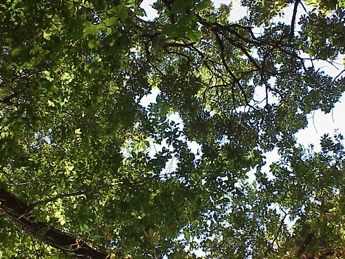
additional points were sampled in the center cell; these were evenly spaced within the bounds of four
corner points. At NOBS, one test plot was sampled in each of four cover types: 1) muskeg, 2) black
spruce, 3) mixed black spruce, jack pine, and aspen, and 4) wetland. These cover types are roughly
equivalent to the four cover types described in Appendix A (NOBS). At AGRO, one plot was sampled in
corn and one in soybeans (see Appendix B (AGRO)). The other two sites, HARV (27-28 September) and
KONZ (1-2 October), were sampled using the design on the right, in Figure 2 below. The only difference
in the design was a more intense sampling density in the 8 external cells of each test plot.

                                                              Figure 2, Pilot Study Sample Design

At each point in the NOBS pilot study plots, sampling involved acquisition of one “ground” and one
“canopy” photo. The tripod of the 3CS holds two cameras on a horizontal extension crossbar, with one
camera facing up and one facing down (see Appendix E for tripod placement photos). The focal plane
of the cameras was positioned roughly at 1.5 m above ground level. The ground camera was positioned
on the crossbar, 0.85 m from the tripod center and placed between two legs of the tripod to minimize
the occurrence of the legs in the pictures. The camera is a Canon PowerShot Pro70. The angle of view
was set to 53 degrees, which yielded a ground image area of approximately 1.5 m by 1 m. The images
were acquired using standard compression in high resolution mode (1.573 million pixels), and a remote
switch. The canopy camera was a Sony Mavica FD91, and had its angle of view set at 20 degrees.
Standard compression and high resolution mode (0.786 million pixels) were used. This camera was
situated on the opposite end of the crossbar from the ground camera, about 0.25 m from the tripod
center. Assuming an average tree canopy height of 10 m, the canopy projection area imaged was
approximately 3 m by 2.2 m. An accessory set of measurements were made at each of the four points
of the external cells of each plot and at each of the four corner points of the center cell. These
included: tree basal area, understory basal area, and ocular proportional estimates of major ground
cover components. Descriptions of these measurements are given in BigFoot Field Measurements. At
AGRO there was no overstory, thus only ground photos were acquired. One test plot was sampled in
each of the two major cover types, corn and soybeans. The corn was approximately 3 m tall, thus the
horizontal crossbar had to be placed on a vertical extension bar to acquire the images (3CS). At HARV
we sampled two test plots, one in a mixed-hardwood conifer site, and the other at a pure hardwood site
(see Appendix C (HARV)). The 3CS was set up the same as at NOBS. At the mixed site, the predominant
overstory species were deciduous hardwoods, whereas the understory was largely coniferous. At KONZ
we sampled a grassland cover type with no overstory and the gallery forest cover type (see Appendix
D (KONZ)). For all ground photos at these three sites, the camera was situated at a height above the
vegetation that would yield an approximate coverage of 1.5 m by 1 m at the surface height of the
vegetation (the same as at NOBS). At the gallery forest site the trees were approximately 30 m tall,
which yielded an imaged canopy surface area of roughly 10 m by 7.5 m. Accessory measurements were
acquired at AGRO, but not at KONZ or HARV.

                                                                          Cohen et al. - 15 June 2000 - Page 2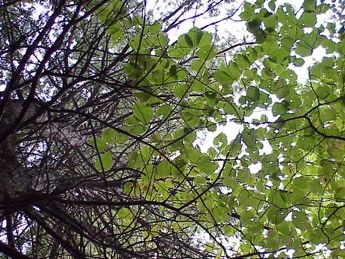
Analysis & Results Each digital photograph was analyzed by laying a mylar sheet over a printed copy about 20 cm by 26 cm in size. The mylar had a grid with 99 line intersections spaced 2.5 cm apart. The vegetation over component lying directly under each grid intersection was noted, and the proportion of total cover in each component cover type was calculated. At NOBS (see Appendix A), the cover components that we could characterize from the photos included conifer, hardwood, and dead tree canopy components, and moss, lichen, herbaceous, shrub, ne litter, tree regeneration, coarse woody debris (CWD), water , and unknown ground components. The unknown component is a result of either glare or deep shadow, because of which, the true component could not be identied. At AGRO (see Appendix B) the component set included corn, soybeans, and open ground. HARV plots (see Appendix C) included canopy trees, and tree regeneration, shrub, fern, herbaceous, coarse woody debris, rock, moss, water, and ne litter ground cover components. There were essentially no dead canopy trees in the plots and we could not condently separate conifer from hardwood, due to a complex vertical mixing of these components. In the grassland KONZ test plot (see Appendix D), the separable components were grass and herbaceous plants; no bare ground was seen. In the gallery forest KONZ test plot, we could characterize canopy tree cover, and the following ground cover components: grass, herbaceous plants, ne litter, coarse woody debris, understory tree regeneration, shrub, and unknown. A basic characterization of each test plot (n=48 for NOBS and AGRO; n=88 for KONZ and HARV) reveals that at NOBS conifer cover was highly variable among test plots, with Plots 4 and 1 having the lowest (18% and 23% respectively) and Plots 3 and 2 having the highest (35% and 52% respectively). Hardwood canopy cover was low in all plots (

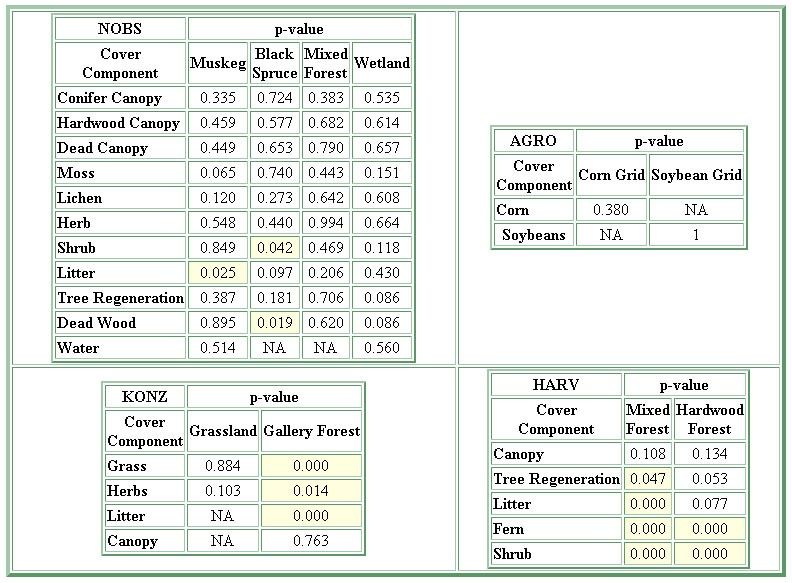
components. The clearest result from this analysis was that, with the exception of Plot 4, at NOBS, conifer canopy proportion is the greatest source of variation in the data set. At AGRO and at the grassland KONZ plot, the PC analyses were not performed because of the within- plot lack of cover component variation. For the gallery forest at KONZ, PC1 was essentially a function of the variation in the amount of ground cover that was grass, whereas the second PC axis was a function of the amount of tree canopy and litter. Together, PC1-PC3 accounted for 80% of the variation in the data set, with PC3 being a function of contrast between the amount of herbaceous and litter components. At HARV , the rst two PC axes from Test Plot 1 accounted for 86% of the variation in the data set, with PC1 being a contrast of litter and tree regeneration and PC 2 being a contrast of tree and litter with fern. In Test Plot 2, PC1 was a contrast between litter and shrub, PC2 was a contrast between shrub and tree regeneration, and PC3 was a contrast between fern and regeneration and shrub cover. The rst three PC axes accounted for 93% of the variation in Test Plot 2. The lack of variation in tree canopy cover at this is evident in its lack of importance in the PC analyses. For the next set of analyses, the data from all photographs within a cell of a given test plot (n=16 for center cell; n=4 or n=9 for surrounding cells) were averaged to provide a set of mean cover component proportions for that cell. From these data, Analysis of Variance (ANOVA) tests were run by cover component to examine the variation among the 9 cells as compared to the variation within each of the 9 cells of each test plot (see Figure 3 below). Greater variation within cells would suggest the larger test plot area is homogenous and 1-2 pixel misregistration should not be an important concern. Greater variation among cells would suggest the test plot neighborhood is not homogenous and misregistration could be a problem. At the NOBS site, in Test Plot 1 (muskeg), only litter was different among cells (p
different among cells. No cover components were different among cells in either Test Plot 3 or 4. It
is important to note that, for test plots 1 and 2, conifer canopy cover is the most important variable
in the PC analysis and it is not different among cells. Neither corn nor soybean cover was different
among cells at the AGRO site. In the grassland test plot at KONZ no cover components were different
among cells. In the gallery forest, all ground cover components were different among cells, but canopy
cover was not. Since this is a closed canopy environment, variation in ground cover will not be
detected by the ETM+ sensor and we need not be concerned with that variation for mapping purposes.
Similar results are seen at the HARV site; i.e., ground cover components were different among cells
and canopy cover was not. This is also a closed canopy site, and ground components will not be
detected. From these ANOVA results misregistration does not appear to be an important problem at
any of the four sites.
We experimented with two different sample sizes, since we had no previous experience using the 3CS
system and did not know what sample size was needed and logistics, particularly at NOBS, were a
major concern. It is not feasible to choose an adequate sample size for this project based only on
statistics, as cost and logistics are too constraining. However, we want to have an estimate of the error
as a function of sample size. Using the same data as for the ANOVA tests, i.e., cover proportions from
each photo, we calculated the standard error associated with varying sample sizes, from
Standard Error = population standard deviation / sqrt(n)
where n=sample size
This required an estimate of the true population standard deviation, for which we used the pooled
variance, or Mean Square Within, from the ANOVA results. At the NOBS site, conifer cover had the
largest standard error of all cover components, approximately 15% with a sample size of 4 at each
of the four test plots. At the AGRO site, soybean cover was 100% in all photos so the standard error
at any sample size is 0. For corn the standard error at a sample size of 4 is less than 1.5%. In the
grassland at KONZ standard error for both grass and herb is less than 3% with n=4. In the gallery
forest standard errors for all cover components are less than 10% with n=4. At HARV canopy standard
error is less than 15% at both test plots with n=4. Understory standard errors are higher in the mixed
forest than in the hardwood forest, but both are less than 5% with a sample size of 4 points. The
shapes of the curves indicate that an n of 4 is too small. Logistics and cost allow for a maximum n of 9.
Fortunately, an n of 9 is near the asymptote in the graphs of the standard error as a function of n and
provides a reasonably acceptable standard error for all components.
Conclusions
We wanted an in-depth characterization of the canopy and ground cover components in each cover
type at all sites, which we now have. In addition, we have examined the potential problem of satellite
image pixels not being accurately aligned with the ground. This was done by comparing the variance
within 25 m cells to the variance among 25 m cells for each cover component. At NOBS, some cover
components did vary more among cells than within cells. However, they were not the variables that
contributed the most to the overall variation in the dataset. Canopy conifer was the most important
variable, and it was not different among cells, suggesting that misregistration will not be a problem at
NOBS. The other three sites had less variability then NOBS, and again, the most important variables
did not vary among cells. Small amounts of misregistration should not be a problem at any of the
sites. Our primary goal was to determine if the Vegetation Cover Component Characterization System
would provide data we needed to develop continuous elds of cover components at each site, and if
so, what the appropriate sample size should be. AGRO is a simple system, consisting largely of corn,
soybeans, and fallow elds. Each eld is quite compositionally homogenous. As such, there is no need
to characterize cover components in any greater detail than to note the crop type present. At KONZ,
the situation is similar, in there is either grassland or gallery forest. There is spatial variability in
grass species present and in the mix of herbaceous species present (in relatively small quantities).
However, biomass measurements made at each plot will be sufcient to characterize spatial variations
in the proportions of these cover components. The gallery forest at KONZ is a relatively uniform, closed
Cohen et al. - 15 June 2000 - Page 5
canopy of mixed hardwood species. Plot-level biomass measurements alone should be sufcient to
characterize relative proportions of canopy species present. Understory components will not be visible
to the ETM+ sensor, thus we need not concern ourselves with that level of detail for mapping with
ETM+. The forest at HARV is also closed canopy and there is little in the way of understory component
variability. The overstory canopy, however, contains considerable variability in hardwood and conifer
species that is important to characterize. Hardwood species appear always to be in the upper canopy
layer (dominant), but conifer species occupy the full range of relative canopy positions from dominant
and co-dominant to intermediate and suppressed. We found it difcult to characterize the relative
canopy positions of trees using 3CS, and this measure can be easily and accurately assessed for
all “in” trees when making the plot-level biomass measurements. Also the satellite will not detect
vegetation in the understory of these closed canopy forests. Using the 3CS in these environments will
not further our goal of developing land cover maps. Therefore, we will not use this system at HARV,
KONZ, or AGRO. NOBS is a very compositionally complex site, consisting of a relatively open, even-
aged forest overstory with a spectrally diverse and highly variable understory and set of ground cover
components. Without use of 3CS, or some comparable system, we could not adequately characterize
vegetation cover at this site. From the graphs of standard error versus sample size, and having a eld
season of experience working at the site, we have chosen to sample nine points in each 25 m cell.
Cohen et al. - 15 June 2000 - Page 6
APPENDIX A - (NOBS)
Major Cover Types at Northern Old Black Spruce
Major Cover Types Encountered Cover Type qualiers
1.Muskeg (open-canopy black spruce) 1.Burned
2.Black spruce (closed-canopy black spruce) 2.Unburned
3.Aspen
4.Wetlands
5.Jack pine
Cover Type Descriptions
Muskeg
Acronym: MSKG
Overstory: dominated by black spruce often mixed with eastern larch
Understory: sparse to heavy cover Labrador tea, Vaccinium spp., and willow spp.
Ground Cover: predominately sphagnum with feathermoss and reindeer lichen
Vegetation Structure: ground cover hummocky; canopy sparse; trees often stunted (1-6 m tall)
Land Form: at, low-lying occasionally ooded
Comments: this cover type is very abundant in NOBS; there exists a gradual transition between
muskeg and closed canopy black spruce- feathermoss forests; demarcation unavoidably arbitrary.
Black spruce
Acronym: BLSP
Overstory: dominated by black spruce occasionally mixed with eastern larch; low level occurrence of
balsam poplar, and jack pine
Understory: sparse coverage of Labrador tea, Vaccinium spp.
Ground Cover: predominately feathermoss
Vegetation Structure: ground cover at (not hummocky); canopy closed; trees not stunted (6-9 m
tall).
Land Form: at, low-lying, but never ooded
Comments: this cover type is very abundant in NOBS; transition between muskeg and closed canopy
black spruce-feathermoss forests is gradual; demarcation is unavoidably arbitrary
Aspen
Acronym: ASPN
Overstory: dominated by trembling aspen; low level occurrence of white spruce, balsam poplar, black
spruce, and jack pine
Understory: green alder and hazel spp.
Ground Cover: very little moss or forbs present
Vegetation Structure: canopy closed, trees often tall (12-15 m tall), hazel and alder often forming
second closed canopy at 1-2 m
Land Form: uplands
Comments: several patches occur at NOBS but they are small and infrequent
Wetland
Acronym: WTLD
Overstory: scattered bog birch and eastern larch
Understory: open water lined with willow, Labrador tea, and marsh grasses
Ground Cover: mosses
Land Form: ooded lowlands, creek margins, and beaver ponds
Comments: this is a difcult community to describe because it includes both ooded peatlands
Cohen et al. - 15 June 2000 - Page 7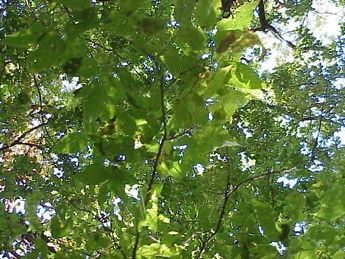
(oligotriphic fens dominated by aquatic sphagnum spp, Vaccinium, and Labrador tea) as well as the
marshy borders of creeks and beaver ponds (marshes containing willows and sedges); despite the range
of plant communities in this cover type they are grouped together because of their similar structure
Jack pine
Acronym: JKPN
Overstory: dominated by Jack pine; low level occurrence of white spruce, balsam poplar, black spruce,
and trembling aspen
Understory: sparse coverage of Labrador tea, vaccinium spp. and occasional patches of green alder
Ground Cover: sparse to complete coverage by reindeer lichen, sparse coverage by feathermoss
Vegetation Structure: canopy closed, trees often tall (10-12 m tall)
Land Form: uplands, sandy soils
Comments: very rare at NOBS except for regeneration stands in 1981 burn at southern edge of site
Cover Type Qualiers and Additional Comments
A large re burned a 150 km2 area on the southern boundary of the NOBS BigFoot study area in
1981. A few of the extensive plots on the south end of the 5x5 km grid occur in this burn. These plots
are classied according to their current plant community (i.e., MSKG, BLSP, WTLD, ASPN, or JKPN)
but their status as burned will also be recognized as a cover type qualier since the burn inuences
the species composition, LAI and NPP
A cover type map including the NOBS BigFoot study area was constructed from aerial photography by
the Manitoba Department of Natural Resources (MDNR) in 1988 and is available as raster map from
the BORIS data base. This is a high quality map that recognizes over 100 cover types. Based on our
own on-ground experience, the map is accurate.
Cohen et al. - 15 June 2000 - Page 8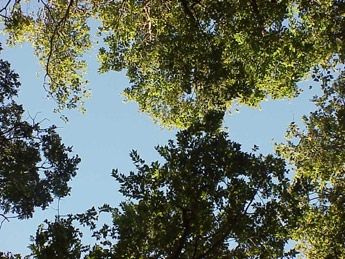
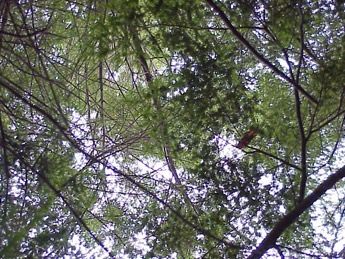
NOBS Canopy Image Samples

NOBS Ground Cover Image Samples

                         Cohen et al. - 15 June 2000 - Page 9
NOBS Test Plot 1: Muskeg

                                                           Figure 4

Correlation for NOBS Test Plot 1: Muskeg

                                                           Figure 5

                               Cohen et al. - 15 June 2000 - Page 10
NOBS Test Plot 2: Black Spruce
Figure 6
Correlation for NOBS Test Plot 2: Black Spruce
Figure 7
Cohen et al. - 15 June 2000 - Page 11NOBS Test Plot 3: Mixed Forest
Figure 8
Correlation for NOBS Test Plot 3: Mixed Forest
Figure 9
Cohen et al. - 15 June 2000 - Page 12NOBS Test Plot 4: Wetland
Figure 10
Correlation for NOBS Test Plot 4: Wetland
Figure 11
Cohen et al. - 15 June 2000 - Page 13Principal Component Analysis for NOBS
Test Plot 1: Muskeg
Figure 12
Test Plot 2: Black Spruce
Figure 13
Cohen et al. - 15 June 2000 - Page 14Principal Component Analysis for NOBS
Test Plot 3: Mixed Forest
Figure 14
Test Plot 4: Wetland
Figure 15
Cohen et al. - 15 June 2000 - Page 15Standard Error Estimates for NOBS
Muskeg Black Spruce
Figure 16 Figure 17
Mixed Forest Wetland
Figure 18 Figure 19
Cohen et al. - 15 June 2000 - Page 16APPENDIX B - (AGRO)
Major Cover Types at Midwestern Cropland
Major Cover Types Encountered
1.Corn
2.Soybean
3.Fallow
Cover Type Descriptions
Corn
Acronym: CORN
Species: corn
Architecture: closed canopy row crop growing >2 m tall by late summer
Comments: roughly half of the row crops planted in the site will be corn
Soybean
Acronym: SOYB
Species: soybean
Architecture: closed canopy row crop growing 50-75 cm tall by late summer
Comments: roughly half of the row crops planted in the site will be soybean
Fallow
Acronym: FALO
Species: hay grasses
Architecture: grassland of variable height
Comments: only a small proportion of the site (AGRO Ground Cover Image Samples
Cohen et al. - 15 June 2000 - Page 18AGRO Corn and Soybean Test Plots
Figure 20
AGRO Standard Error Estimates
Corn Test Plot Soybean Test Plot
There was no variance in
soybean cover, so the SE
is 0
Figure 21
Cohen et al. - 15 June 2000 - Page 19APPENDIX C - (HARV)
Major Cover Types at Harvard Forest
Major Cover Encountered Cover type qualiers
1.Eastern hardwoods 1.disturbed (clearcut)
2.Eastern hemlock 2.undisturbed
3.Red pine
4.Oldeld meadow
Cover Type Descriptions
Eastern hardwood
Acronym: EHWD
Overstory: dominated by sugar maple mixed with red oak, ash, basswood, and beech
Understory: saplings of shade tolerant tree species, and Vaccinium
Ground Cover: grasses and forbs belonging to the “Canadian Carpet” community
Land Form: uplands
Comments: additional visits to HARV will allow us to better describe this community
Eastern hemlock
Acronym: HEML
Overstory: eastern hemlock with remnant red oak
Understory: hemlock saplings
Ground Cover: sparse cover of grasses and forbs belonging to the “Canadian Carpet” community
Land form: uplands to lowlands
Comments: additional visits to HARV will allow us to better describe this community
Red pine
Acronym: RDPN
Overstory: red pine
Understory: red pine saplings
Ground Cover: sparse cover of grasses and forbs and shrubs
Land Form: uplands
Comments: additional visits to HARV will allow us to better describe this community
Oldeld meadow
Acronym: OLDF
Overstory: none
Understory: grasses, shrubs
Comments: this cover type is largely the result of anthropogenic disturbance; additional visits to HARV
will allow us to better describe this community
Cover Type Qualiers and Additional Comments
A clearcut in 1999 removed the forest from a portion of the private land occurring within the Harvard
Forest study area, affecting one or more of the extensive plots. These plots will be classied according
to their current plant community but their status as clearcut will also be recognized as a cover type
qualier since cutting inuences the vegetation structure and function.
Cohen et al. - 15 June 2000 - Page 20HARV Canopy Image Samples
HARV Ground Cover Image Samples
Cohen et al. - 15 June 2000 - Page 21HARV Test Plot 1: Mixed Forest
Figure 22
Correlation for HARV Test Plot 1: Mixed Forest
Figure 23
Cohen et al. - 15 June 2000 - Page 22HARV Test Plot 2: Hardwood Forest
Figure 24
Correlation for HARV Test Plot 2: Hardwood Forest
Figure 25
Cohen et al. - 15 June 2000 - Page 23Principal Component Analysis for HARV
Test Plot 1: Mixed Forest
Figure 26
Test Plot 2: Hardwood Forest
Figure 27
Cohen et al. - 15 June 2000 - Page 24Standard Error Estimates for HARV
Test Plot 1: Mixed Forest
Figure 28
Test Plot 2: Hardwood Forest
Figure 29
Cohen et al. - 15 June 2000 - Page 25APPENDIX D - (KONZ)
Major Cover Types at Konza Prairie
Major Cover Types Encountered Cover type qualiers
1.Tallgrass prairie 1.Cattle grazed
2.Shortgrass prairie 2.Bison grazed
3.Shrub community 3.Ungrazed
4.Gallery forest 4.Burn frequency
Cover Type Descriptions
Tallgrass prairie
Acronym: TGPR
Species: Big bluestem, Indian grass, little bluestem, switchgrass, and other forbs
Architecture: 1-1.5 m tall at full ush
Land Form: bottomlands, deep soils, unexposed aspects
Comments: a wide, poorly dened, gradient exists between the tallgrass and shortgrass prairies
Shortgrass prairie
Acronym: SGPR
Species: blue-grama, hairy grama, xeric forbs
Architecture: 10-20 cm tall at full ush
Land Form: exposed ridge tops, shallow claypan soils
Comments: a wide, poorly dened, gradient exists between the tallgrass and shortgrass prairies
Shrub community
Acronym: SHRB
Species: smooth sumac and Cornus spp
Architecture: 1-2 m tall, very dense, thin stems, closed canopy
Land Form: exposed ridge tops, shallow claypan soils
Comments: forms patches in drainage gulches and seeps; shrub communities also occur adjacent to
creeks and as a transition between prairie and forest
Gallery forest
Acronym: GALF
Species: oaks, elm, hackberry, walnut, and hickory
Architecture: 15-20m tall closed canopy but lots of edge supports signicant understory with open
canopy at 3-5m
Land Form: lowlands, largely riparian
Comments: this is a diverse community that transitions into prairie either by way of open savanna or
by shrub communities; about 6% of Konza is gallery forest
Cover Type Qualiers and Additional Comments
Konza is divided into over 60 managed experimental watersheds. The management practices vary with
respect to grazing regime and re frequency. Grazing treatments include cattle grazing, bison grazing,
and no grazing. Fire regimes vary by frequency (1, 2, 4, 10, or 20 year re cycles) and timing (winter,
summer, fall, and spring burning). While not all combinations of burning and grazing regimes are
practiced, many are making the Konza landscape very diverse. The BigFoot design can not sample
each of these management areas. The management history of each study plot will be recognized
as a cover type qualier since the management practice inuences species composition, vegetation
structure and function.
Cohen et al. - 15 June 2000 - Page 26KONZA Canopy Image Samples
KONZA Ground Cover Image Samples
Cohen et al. - 15 June 2000 - Page 27KONZA Test Plot 1: Grasslands
Figure 30
Cohen et al. - 15 June 2000 - Page 28KONZA Test Plot 2: Gallery Forest
Figure 31
Correlation for KONZA Test Plot 2: Gallery Forest
Figure 32
Cohen et al. - 15 June 2000 - Page 29Principal Component Analysis for KONZA
Test Plot 2: Gallery Forest
Figure 33
Standard Error Estimates for KONZA
Test Plot 2: Gallery Forest
Figure 34
Cohen et al. - 15 June 2000 - Page 30APPENDIX E
3CS in Action
Cohen et al. - 15 June 2000 - Page 31You can also read