Seismic Performance Evaluation of Steel Buildings with Oil Dampers Using Capacity Spectrum Method
←
→
Page content transcription
If your browser does not render page correctly, please read the page content below
applied
              sciences
Article
Seismic Performance Evaluation of Steel Buildings with Oil
Dampers Using Capacity Spectrum Method
Ahmad Naqi              and Taiki Saito *

                                          Department of Architecture and Civil Engineering, Toyohashi University of Technology, Aichi 441-8580, Japan;
                                          ahmad.naqi.sl@tut.jp
                                          * Correspondence: saito.taiki.bv@tut.jp

                                          Abstract: This study proposes a capacity spectrum Method (CSM)-based procedure to estimate the
                                          maximum seismic performance of steel buildings passively controlled with bilinear oil dampers. In
                                          the proposed CSM, the maximum seismic response of a building was estimated, in the acceleration-
                                          displacement response spectrum, as the intersection between the capacity curve and the damping-
                                          adjusted demand curves, using the equivalent linearization method. The building equivalent damp-
                                          ing ratio was determined by the sum of the inherent damping, and the square root of sum of squares
                                          (SRSS) of the hysteretic damping and the viscous damping of the supplemental oil devices. The
                                          calculation steps of the proposed CSM are explained in detail based on the equivalent single de-
                                          gree of freedom (ESDOF) system, and its accuracy was examined by comparison with time history
                                          analysis (THA) results. Two model steel buildings of 4 and 10 stories, uniformly equipped with oil
                                          dampers along the height, were subjected to six selected earthquake ground motions scaled to be
                                          compatible with Level-2 earthquakes, as defined in the Japanese Building Standard Law. The seismic
                                performance of the buildings was estimated by the proposed CSM procedure and compared with the

                                          results of nonlinear THA in terms of the maximum story displacements and the shear forces. It was
Citation: Naqi, A.; Saito, T. Seismic
                                          observed that the proposed CSM scheme provided a satisfactory accuracy to assess the maximum
Performance Evaluation of Steel
                                          nonlinear response of steel buildings passively controlled with oil dampers.
Buildings with Oil Dampers Using
Capacity Spectrum Method. Appl. Sci.
                                          Keywords: bilinear oil damper; steel structure; capacity spectrum method; passively controlled
2021, 11, 2687. https://doi.org/
                                          buildings
10.3390/app11062687

Academic Editors: Felice Carlo Ponzo
and Antonio Di Cesare
                                          1. Introduction
Received: 21 February 2021                     The capacity spectrum method (CSM) is a practical tool to evaluate the seismic perfor-
Accepted: 13 March 2021                   mance of buildings using a response spectrum and an equivalent linear system. Since its
Published: 17 March 2021                  original development by Freeman in 1975, it has been modified and adopted by different
                                          organizations [1]. For instance, in 1980, the Applied Technology Council (ATC) published
Publisher’s Note: MDPI stays neutral      guidelines to evaluate building performance using the CSM concept [2]. Similarly, in 1998,
with regard to jurisdictional claims in   the Building Standard Law of Japan adopted the concept of CSM as one of the proce-
published maps and institutional affil-
                                          dures for the seismic design of buildings [3]. Likewise, many researchers have assessed
iations.
                                          the accuracy of the method and applied it over a wide range of structural systems [4].
                                          Consequently, a number of modifications have been proposed to improve the application
                                          of CSM depending on the structural type of buildings.
                                               Generally, the seismic assessment and design of structures equipped with damping
Copyright: © 2021 by the authors.         devices require nonlinear time history analysis (THA), which is highly time-consuming.
Licensee MDPI, Basel, Switzerland.        Some straightforward procedures have been proposed by researchers to evaluate the
This article is an open access article    seismic performance of passively controlled buildings. Choi and Kim [5] developed a
distributed under the terms and
                                          CSM-based procedure to estimate the amount of supplemental viscous damping, for a
conditions of the Creative Commons
                                          multi-story building, required to reduce roof displacement in the range of pre-defined
Attribution (CC BY) license (https://
                                          target displacement. A similar concept is further illustrated by Kim et al. [6], and Li and
creativecommons.org/licenses/by/
                                          Liang [7]. The study conducted by Chen et al. [7,8] introduced an improved version of
4.0/).

Appl. Sci. 2021, 11, 2687. https://doi.org/10.3390/app11062687                                               https://www.mdpi.com/journal/applsci
Appl. Sci. 2021, 11, 2687                                                                                          2 of 15

                            CSM to estimate the number of metallic dampers under earthquake loads. In the cases
                            of the buildings with viscoelastic dampers, Han et al. [9] employed CSM to analyze
                            the performance of the passively controlled buildings. Benavent-Climent and Escolano-
                            Margarit [10] compared shaking table test results of the scaled specimens equipped with
                            hysteretic dampers and those obtained by the improved CSM procedures, and it was
                            reported that the improved CSM had the potential to estimate maximum displacement
                            with acceptable accuracy. Kim et al. [11] discussed the optimal distribution of steel dampers
                            along the height of the structures using the CSM procedure. Kosmas et al. [12] proposed an
                            alternative CSM method using the constant ductility inelastic spectra to estimate the seismic
                            performance of structures with viscous dampers. Joao Estevao [13] incorporated the CSM
                            method to investigate the seismic risk of buildings in a seismically active region using
                            capacity curves of individual buildings. Furthermore, the effectiveness of CSM to design
                            and evaluate the retrofitting of RC buildings is extensively discussed and reported by
                            researchers [14,15]. Ramirez et al. [16] proposed the following two simplified procedures,
                            similar to CSM: the equivalent lateral force (ELF) and response spectrum procedures (RSP),
                            which are adopted in the 2000 NEHRP and ASCE7 provisions for the design of passively
                            controlled buildings. In the ELF method, the contributions of the first mode and residual
                            mode are incorporated, whereas in the RSP method, the contributions of higher modes are
                            also considered to estimate the response of buildings with damping devices.
                                  The oil damper device (OD) is widely used due to its excellent performance, includ-
                            ing its durability of aging, durability under repeated loading cycles, low temperature
                            dependence, high energy dissipation capacity, and stable mechanical properties [17–20].
                            The bilinear-type oil damper, which has a relief valve and reduces the rate of increase in
                            damping force when the relief velocity is exceeded, is commonly used in Japan, especially
                            for high-rise buildings. Adachi et al. [21,22] introduced a design procedure to minimize
                            the story drift and acceleration of high-rise buildings by optimizing the OD relief force
                            distribution along the height of the building. Ji et al. [23] reported about the contribution
                            of OD in a real size five-story steel building, tested on the E-defense shaking table in
                            Japan. Xie et al. [24] examined the performance of an eight-story steel building equipped
                            with oil dampers damaged during the 2011 Great East Japan Earthquake. Takabatake
                            and Kitada [25] proposed a simplified procedure to evaluate the seismic performance of a
                            retrofitted building with OD installed inside and outside of the structural frame.
                                  Although the seismic performance of buildings with hysteretic and viscous dampers
                            are studied extensively, few studies have been conducted on the CSM methods for passively
                            controlled buildings with bilinear-type oil dampers. Therefore, this study proposes a CSM-
                            based method to estimate the maximum responses of passively controlled buildings with
                            bilinear-type oil dampers, and the results are compared with those of nonlinear THA.

                            2. Proposal of the Square Root of Sum of Squares (SRSS) Effective Damping Ratio
                                 The equivalent damping ratio, hh , of a hysteresis damper is defined [26] as,

                                                                             1 ∆Wh
                                                                 hh (µ) =                                             (1)
                                                                            4π W
                            where ∆Wh is the hysteresis energy under one cycle of hysteresis and W is the area of elastic
                            strain energy. For the bilinear hysteresis, as shown in Figure 1a, they are obtained as,

                                                           ∆Wh = 4 K δy2 (µ − 1)(1 − p)                               (2)

                                                                        1
                                                                  W=      K δy2 µ2                                    (3)
                                                                        2
Appl. Sci. 2021, 11, 2687                                                                                                  3 of 15

                            Figure 1. (a) The force–displacement relation of the bilinear hysteresis model; (b) the force–velocity
                            relation of bilinear-type oil damper.

                                 In the Equations (2) and (3), δy is the yield displacement of the system, µ is a dis-
                            placement ductility factor, K is the initial stiffness, and p is the ratio of post-yield to
                            pre-yield stiffness.
                                 In the same way, the equivalent damping ratio, hV , of an oil damper is defined as

                                                                                             1 ∆Wv
                                                                             hv (µ) =                                         (4)
                                                                                            4π W
                            where ∆WV is the area of one cycle of force–velocity relation of the oil damper, given by,

                                                                            ∆Wv = π Cω µ2 δy2                                 (5)

                            where C is the damping coefficient of the oil damper and ω is the equivalent circular
                            frequency of the system.
                                 In the system with a hysteresis damper and an oil damper, according to the Building
                            Standard Law of Japan [3], the effective damping ratio, heff , of a seismically isolated building
                            is defined by the direct sum of three types of damping ratios as given in Equation (6).

                                                                         he f f ,Direct = h0 + hh + hv                        (6)

                            where h0 is the inherent damping ratio.
                                 Kasai et al. [27,28] proposed a formula of the effective damping ratio as the average of
                            the equivalent damping ratio in the range of 0 to µ as given in Equation (7). It is reported
                            that the accuracy of this formula is relatively high to estimate the earthquake response of
                            the system. However, it is difficult to obtain an explicit analytical solution for the general
                            hysteresis model.

                                                                     Zµ                        Zµ
                                                                 1              0      10
                                                                                                     hh µ0 + hv µ0 dµ0

                                               he f f ,Kasai   =          heq   µ dµ =                                        (7)
                                                                 µ                     µ
                                                                     0                         0

                                 The current research study proposed a formula to calculate the effective damping
                            ratio from the sum of the inherent damping, and the SRSS of the equivalent hysteresis and
                            viscous damping ratios as given in Equation (8).
                                                                                              q
                                                                     he f f ,SRSS = h0 +           h2h + h2v                  (8)

                                   The comparison of the values of the effective damping ratio for the three procedures
                            (heff,Direct , heff,SRSS , and heff,Kasai ) with respect to the ductility factor is shown in Figure 2,
                            where the post-yield stiffness ratio, p, and the initial damping factor, h0 , are varied as
                            p = 0.01~0.05 and h0 = 0.05~0.3. It is depicted that the proposed heff,SRSS becomes closer to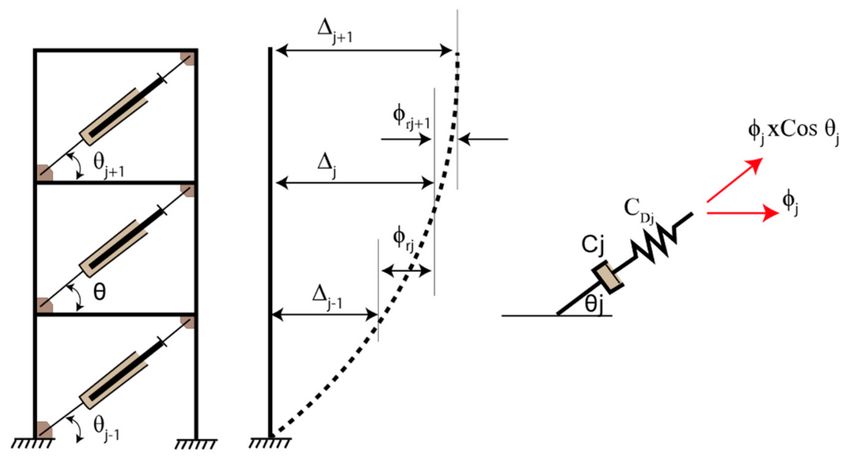
Appl. Sci. 2021, 11, 2687                                                                                                                                                     4 of 15

                                                            the value of heff,Kasai as h0 increases. On the other hand, heff,Direct overestimates the effective
                                                            damping ratio by 30% compared to heff,Kasai .

                                   1.5
                                             h0= 0.05                            h0= 0.1                            h0= 0.2                       h0= 0.3
                                             p = 0.01                            p = 0.01                           p = 0.01                      p = 0.01
                                   1.0

                                   0.5

                                   0.0
                                   1.5
                                             h0= 0.05                            h0= 0.1                            h0= 0.2                       h0= 0.3
                                                                Direct Sum
                                             p = 0.02                            p = 0.02                           p = 0.02                      p = 0.02
                                   1.0                          Kasai
                                                                SRSS

                                   0.5

                                   0.0
                                   1.5
               Effective Damping

                                             h0= 0.05                            h0= 0.1                            h0= 0.2                       h0= 0.3
                                             p = 0.03                            p = 0.03                           p = 0.03                      p = 0.03
                                   1.0

                                   0.5

                                   0.0
                                   1.5
                                             h0= 0.05                            h0= 0.1                            h0= 0.2                       h0= 0.3
                                             p = 0.04                            p = 0.04                           p = 0.04                      p = 0.04
                                   1.0

                                   0.5

                                   0.0
                                   1.5
                                             h0= 0.05                            h0= 0.1                            h0= 0.2                       h0= 0.3
                                             p = 0.05                            p = 0.05                           p = 0.05                      p = 0.05
                                   1.0

                                   0.5

                                   0.0
                                         0      2       4   6      8    10   0      2       4   6   8     10    0       2      4   6   8   10 0      2       4   6   8   10
                                                                                                        Ductility Factor

                                               Figure 2. Comparison of different procedures to estimate the effective damping ratio.
                                                                                                    Figure 2.
                                 In the case of the bilinear-type oil damper, the equivalent damping coefficient, Ceq , is
                            proposed in the JSSI manual so that the area under the equivalent linear damping should
                            be equal to the area of bilinear force–velocity relation as shown in Figure 1b [17], and
                            derived
     Modification Description:       as revised the Figure 2 legend.
                               we have                               Before it wasRSS, butto make the figure
                                                           C1             1 2 2C1             1
     consisting of the manuscript body, we changed      = SRSS.
                                                    Ceq it      + C2 1 −        +        1−                           (9)
                                                           µ ∗2          µ∗        µ∗        µ∗
                                                            where, in Equation (9), C1 and C2 are the pre-relief and post-relief damping coefficients
                                                            of the bilinear-type oil damper, and µ * is the ratio of maximum velocity to relief velocity.
                                                            In the subsequent sections, the proposed heff,SRSS , which is obtained from Ceq , is used to
                                                            evaluate the maximum seismic performance of a steel building by CSM.

                                                            3. Proposed CSM Procedure for Buildings Equipped with Oil Dampers
                                                                 This section demonstrates the procedure of the proposed CSM using the equivalent
                                                            single degree of freedom (ESDOF) system defined by Kuramoto et al., 2000 [29]. The
                                                            ESDOF consists of a mass, m, a frame damping coefficient, Cf , and a stiffness, Kf . This study
                                                            assumed that the natural period of the ESDOF was 0.5 s and the base shear coefficient (i.e.,
Appl. Sci. 2021, 11, 2687                                                                                                                      5 of 15

                                 the ratio of yielding force to the total weight) was 0.2. The ESDOF was equipped with
                                 the bilinear-type oil damper which had a damping coefficient, CD , and a stiffness, KD , as
                                 shown in Figure 3a. The ESDOF parameters are summarized in Tables 1 and 2.

      Figure 3. (a) The equivalent oil damper configuration in the ESDOF system; (b) the initial demand curve (5% damping) and
      capacity curve of the ESDOF system.

                                 Table 1. Technical parameters of the equivalent single degree of freedom (ESDOF) system.

                                     Natural Period        Weight           Damping             Stiffness         Yielding
                                                                                                                                              K2 ∗
                                          (T)               (W)               (h0 )               (Kf )           Force (Fy )         p=      K1
                                           s                 kN                  %               kN/cm                kN
                                          0.5               5000.0               5.0             805.68             1000.0              0.05
                                 * K1 and K2 represent the pre-yield and post-yield stiffness of the ESDOF system, respectively.

                                 Table 2. Technical parameters of the supplemental story-equivalent oil damper.

                                         Stiffness           Pre-Relief Damping Coef.              Relief Velocity
                                           (KD )                        (C1 )                           (Vr )                      C2 /C1 *
                                          kN/cm                        kN-s/cm                            cm/s
                                           805.68                         22.0                            5.0                       0.05
                                 * C1 and C2 represent the damping pre-relief valve and post-relief valve operation of oil damper, respectively.

                                      The capacity curve of the system is shown in Figure 3b. The demand curve is presented
                                 in the form of an acceleration–displacement spectrum of the selected earthquake ground
                                 motion. In this study, the Level-2 earthquake defined in the Building Standard Law of
                                 Japan [3] was used to generate the design acceleration–displacement response spectrum
                                 with a 5% damping factor. The latter was adjusted according to the value of the effective
                                 damping using the reduction factor, Fh , in Equation (10), adopted by the JSSI manual [17]
                                 from the study conducted by Kasai et al. [28,30].
                                                                                   √
                                                                                     1 + 25h5%
                                                                              Fh = q                                                             (10)
                                                                                     1 + 25he f f

                                        The proposed CSM was performed as following:
                                 •      The multi degree of freedom (MDOF) was converted to the ESDOF [29];
                                 •      For selected ductility factor values (e.g., µ = 1, 2, 3 . . . ), the respective effective
                                        damping ratios (e.g., h1 , h2 , h3 . . . ), not including the contribution of the oil damper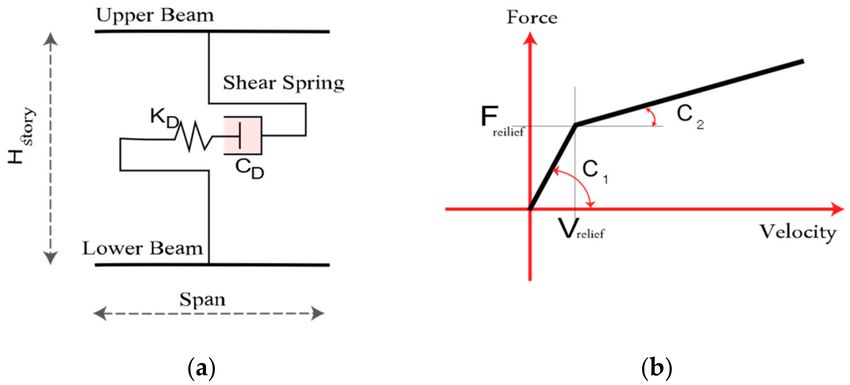
Appl. Sci. 2021, 11, 2687                                                                                         6 of 15

                                devices, were computed using Equation (11) [3], and the demand spectra were adjusted
                                by Equation (10), and plotted together with the capacity curve of the ESDOF as shown
                                in Figure 4a;
                                                                                1− p

                                                                2       1
                                                      heq = 0.8     1−                    + 0.05                 (11)
                                                                π       µ 1 + p ( µ − 1)
                            •   The spectral ordinates (spectral acceleration, SA, and displacement, SD ) of the demand
                                spectrum at the intersection points with equivalent stiffness lines were determined
                                and named as initial performance points;
                            •   For each initial performance point, the equivalent circular frequency of the ESDOF
                                was estimated by Equation (12);
                                                                                s
                                                                                    SA
                                                                    ωeq (µ) =                                       (12)
                                                                                    SD

                            •   The corresponding story displacements (δ1 , δ2 , δ3 . . . ) were computed from the
                                ESDOF. Then, the maximum story velocities of the MDOF, Vmax , were estimated
                                as following;
                                                              Vmax,i (µ) = ωeq ·δi                            (13)
                            •   Using Equations (8), (9) and (16) the effective damping of the system, heff,SRSS , the
                                equivalent damping coefficient, Ceq , and the viscous damping of oil dampers, hV , were
                                estimated, respectively;
                            •   Demand spectra were updated for each ductility factor as shown in Figure 4b (dashed-
                                line response spectra);
                            •   The next performance points were considered, and the same process was repeated
                                until convergence (the difference between successive effective damping ratios becomes
                                negligible), as shown in Figure 4c (dashed-dotted-line response spectra);
                            •   The final performance points were connected and the point of intersection of the
                                formed curve (blue solid line in Figure 4d) with the capacity curve was defined as the
                                ultimate performance point of the ESDOF;
                            •   Maximum seismic performance of the corresponding MDOF could be deducted from
                                the ultimate performance point of its ESDOF.
                                 For the ESDOF system presented in this section, the maximum displacement was
                            estimated as 6.15 cm. In Figure 4d, the average maximum displacements from the THA of
                            six selected Level-2 earthquakes (details are given in Section 4.4) are marked by a vertical
                            broken line. A difference of 20% was observed from the proposed CSM result.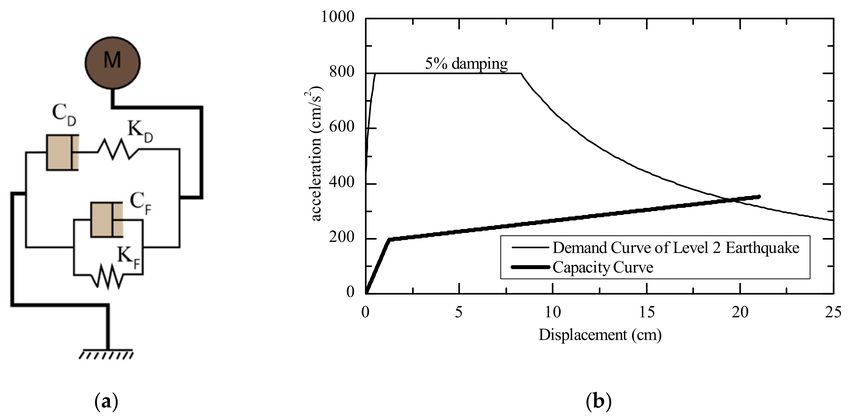
Appl. Sci. 2021, 11, 2687 7 of 15
Figure 4. (a–d) steps of the proposed capacity spectrum method (CSM) applied to the ESDOF system
using the damping-adjusted design spectra of a Level-2 earthquake.
4. Application of the Proposed CSM on Steel Frame Buildings
4.1. Effective Damping Ratio of MDOF System
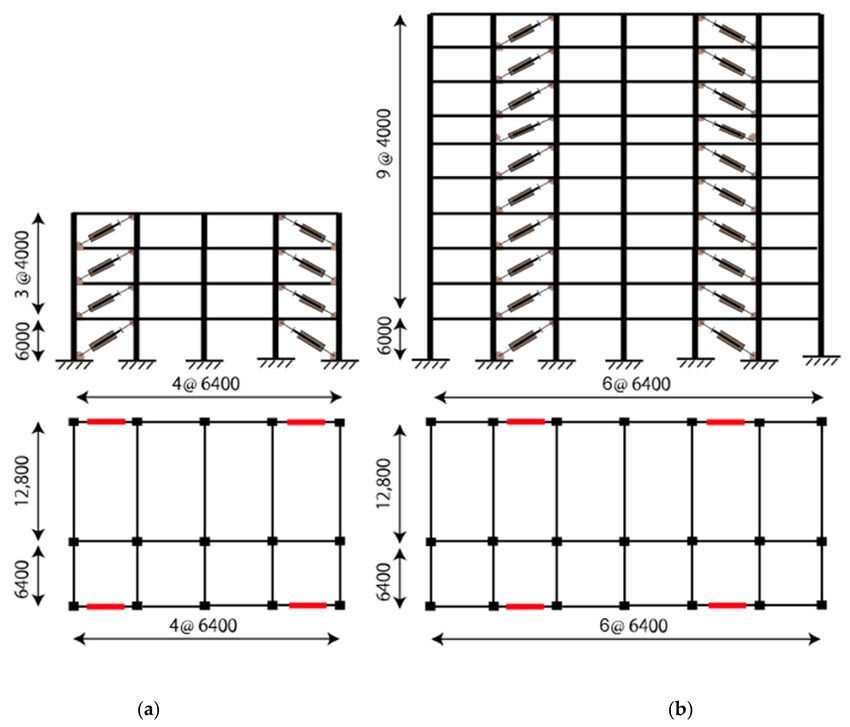
Where the oil dampers were arranged in a diagonal scheme with the inclination angle,
θ, for an MDOF system as illustrated in Figure 5, the Equations (4) and (5) can be used to
incorporate the oil damper distribution along the building height, as follows:
∑ ∆Wj = π·ωeq ∑ Cj φrj2 cos θ 2j (14)
1 2
2 eq ∑ j j
W= ω m ∆2 (15)
where Cj , ∆j , φrj , ω eq and mj are the damping coefficient of the oil damper, the story drift
of the first mode, the relative story drift, the equivalent circular frequency and the mass
of jth floor, respectively. By substituting Equations (14) and (15) into Equation (4), the
viscous damping ratio of the oil damper can be obtained as given in Equation (16) for an
MDOF system.
2 2
1 ∑ Cj φrj cos θ j
hV = (16)
2 ωeq ∑ m j ∆2j
4.2. Description of Target Buildings
Steel buildings, both 4-story and 10-story, were selected from the JSSI manual [17,31].
The buildings were designed as steel moment-resisting frames to resist the gravity loads,
while oil dampers were considered to control the response under the earthquake ground
motion. The plans and elevations of the buildings are shown in Figure 6. The ground floor
height is 6 m, and the typical floor height is 4 m for both target buildings. The sizes of
columns and beams are summarized in Tables 3 and 4.Appl. Sci. 2021, 11, 2687 8 of 15
Figure 5. Multi degree of freedom (MDOF) with oil dampers corresponding to the first mode
of vibration.
Figure 6. Target buildings plan, elevation and oil damper configuration: (a) 4-story building; (b) 10-story building.Appl. Sci. 2021, 11, 2687 9 of 15
Table 3. Detail and size of structural columns (mm).
Building Story Interior Column Exterior Column Corner Column
4 400 × 400 × 16 400 × 400 × 16 350 × 350 × 16
3 450 × 450 × 19 400 × 400 × 19 350 × 350 × 16
4-story
2 450 × 450 × 22 450 × 450 × 19 400 × 400 × 19
1 500 × 500 × 22 500 × 500 × 19 400 × 400 × 19
7–R 550 × 550 × 22 500 × 500 × 22 500 × 500 × 19
5–6 600 × 600 × 28 550 × 550 × 25 550 × 550 × 22
10-story
3–4 650 × 650 × 28 600 × 600 × 25 600 × 600 × 22
2 650 × 650 × 28 600 × 600 × 28 600 × 600 × 25
Table 4. Detail and size of structural beams (mm).
Longitudinal Direction Transvers Direction
Building Story
Interior Beam Exterior Beam Short Span Long Span
4 550 × 200 × 9 × 16 550 × 250 × 12 × 22 700 × 300 × 12 × 22
3 550 × 250 × 9 × 19 550 × 200 × 12 × 22 700 × 250 × 12 × 22
4-story
2 600 × 250 × 12 × 22 600 × 200 × 12 × 25 750 × 250 × 14 × 25
1 650 × 250 × 12 × 25 650 × 200 × 12 × 25 800 × 250 × 14 × 25
10–R 600 × 300 × 12 × 22 600 × 250 × 12 × 22 600 × 300 × 14 × 25 600 × 300 × 14 × 32
8–9 700 × 300 × 12 × 22 700 × 250 × 12 × 22 700 × 300 × 14 × 25 700 × 300 × 16 × 32
6–7 750 × 300 × 16 × 25 750 × 250 × 14 × 25 750 × 300 × 16 × 28 750 × 300 × 16 × 32
10-story
4–5 750 × 300 × 16 × 28 750 × 250 × 16 × 28 750 × 350 × 16 × 28 750 × 350 × 16 × 32
3 750 × 300 × 16 × 28 750 × 300 × 16 × 28 750 × 350 × 16 × 28 750 × 350 × 16 × 32
2 800 × 300 × 16 × 32 800 × 300 × 16 × 28 800 × 300 × 16 × 32 800 × 300 × 16 × 32
The steel grade is SN490B with a yield strength of 325 MPa and a tensile strength of
490 MPa. The arrangement of oil dampers in the plan and the evaluation of the building
is shown in Figure 6. Since the oil dampers were diagonally installed in a longitudinal
direction only, the following analysis is limited to the longitudinal direction. The technical
parameters of oil dampers are presented in Tables 5 and 6.
Table 5. Technical parameters of oil dampers for 4-story building.
Height Weight Story Stiffness Damper Stiffness Damping Relief V.
Story (H) (Wf ) (KF ) (KD ) (C1 ) (Vr ) C2 /C1
m kN kN/mm kN/mm kN-s/mm cm/s
4 4.0 6622.0 328.2 56.50 11.75 38.6 0.02
3 4.0 6664.0 383.0 65.93 13.70 38.6 0.02
2 4.0 6680.0 383.5 66.02 13.72 38.6 0.02
1 6.0 6859.0 280.0 48.18 10.02 57.9 0.02
4.3. Frame Models of Target Buildings
The 3D frame models of the buildings were analyzed by STERA_3D software, which is
a finite element-based program developed by one of the authors [32]. In the model, the steel
beam element is presented by a line element with two nonlinear flexural springs at both
ends, as shown in Figure 7. The steel column element is presented by a line element with
nonlinear axial springs in both end sections to consider nonlinear axial-moment interaction.
The steelstrength was modified 1.1 times more than the nominal strength, and the ratio of
post-yield stiffness was γ = K0 /Ky = 0.001. The slab effects required to amplify the flexural
stiffness of the steel beam were assumed to be 1.2. The floor slab was considered to be
rigid for in-plane deformation, and free for out-of-plane deformation. The beam–columnAppl. Sci. 2021, 11, 2687 10 of 15
connection was assumed to be rigid, where the rigid zone length for the beam element was
set to be half of the column width.
Table 6. Technical parameters of oil dampers for 10-story building.
Story Stiffness Damper Stiffness Damping
Story Height (H) Weight (Wf ) Relief V. (Vr )
(KF ) (KD ) (C1 ) C2 /C1
m kN kN/mm kN/mm kN-s/mm cm/s
10 4.0 8579.0 158.6 27.30 5.67 38.6 0.02
9 4.0 6365.0 180.1 31.00 6.45 38.6 0.02
8 4.0 6431.0 220.3 37.92 7.88 38.6 0.02
7 4.0 6470.0 244.8 42.13 8.77 38.6 0.02
6 4.0 6539.0 291.8 50.23 10.45 38.6 0.02
5 4.0 6567.0 306.2 52.70 10.95 38.6 0.02
4 4.0 6622.0 328.2 56.50 11.75 38.6 0.02
3 4.0 6664.0 383.0 65.93 13.70 38.6 0.02
2 4.0 6680.0 383.5 66.02 13.72 38.6 0.02
1 6.0 6859.0 280.0 48.18 10.02 57.9 0.02
Figure 7. Moment–rotation relationship at bending spring of beam and column elements.
The bilinear-type oil damper is defined as a vertical line element with a shear spring
in the middle. The shear spring consists of the Maxwell model with an elastic spring with
stiffness, KD , and a dashpot with a bilinear-type damping coefficient, C, connected in a
series. The force–velocity relation of the dashpot is shown in Figure 8.
Figure 8. (a) Element model of bilinear-type oil damper, (b) force–velocity of oil damper.Appl. Sci. 2021, 11, 2687 11 of 15
Table 7 summarizes the natural periods and effective masses of the buildings obtained
by the eigenvalue analysis. The capacity curves of the ESDOF of the buildings were
obtained by the nonlinear static pushover analysis as shown in Figure 9.
Table 7. Dynamic characteristics of target buildings.
Building Parameter 1st Mode 2nd Mode 3rd Mode
Natural period (s) 1.40 0.49 0.25
4-story
Effective mass (%) 91.2 7.90 0.60
Natural period (s) 2.03 0.75 0.44
10-story
Effective mass (%) 82.8 11.3 3.40
Figure 9. Capacity curve of the ESDOF of target buildings: (a) 4-story building, (b) 10-story building.
4.4. Demand Spectrum of Earthquake Ground Motions
The six earthquake ground motions listed in Table 8 were selected as the extreme rare
earthquakes defined by the Building Standard Law of Japan [3]. The earthquakes were
generated using the algorithm developed by one of the authors [32]. Three of them (No.
1, 2, and 3) were the observed earthquake records scaled to have the maximum velocity
of 50 cm/s. Another three (No. 4, 5, and 6) were the artificially generated earthquake
ground motions that had a response spectrum compatible with the design response spec-
trum of the Level-2 design earthquake and phase spectrum of the observed earthquake
records. Figure 10 illustrates the acceleration response spectra, with a 5% damping factor,
of artificially generated earthquakes and the spectrum of the design code (thick solid line).
Table 8. List of selected earthquake ground motions.
Categories No. Event Year Station
1 Imperial Valley 1940 El Centro
Scaled earthquake to be
2 Kern County 1952 Taft
compatible of 50 cm/s
3 Kobe 1995 JMA
Artificially generated 4 Tohoku 1978 Tohoku Univ.
earthquake to be 5 Tokachi Oki 1968 Hachinohe
compatible of L2 6 Kobe 1995 JMA
4.5. Comparison Results between CSM and THA
The maximum responses of the target buildings under the earthquake ground motions
were estimated by the proposed CSM, and compared with the results of nonlinear THA.
Figures 11–14 show the story drifts and story shear forces obtained by the proposed
CSM and the nonlinear THA for the selected ground motions along the height of the
target buildings.Appl. Sci. 2021, 11, 2687 12 of 15
Figure 10. Response spectra of selected ground motions and design response spectrum of Level-2
earthquake with 5% damping factor.
Figure 11. Comparison of story drifts between proposed CSM and time history analysis (THA) for
4-story building.
For the 4-story building, the average ratio of THA to proposed CSM (for story drift
and story shear force) was 0.95 for the scaled 50 cm/s earthquakes. The ratio for the
artificially generated earthquakes compatible with Level-2 design earthquake was about
0.90. Similarly, the ratios for the proposed CSM and the THA for story drift and story shear
force, in the 10-story building, were 1.10 and 1.20 for the scaled and artificially generated
ground motions, respectively. It was also noted that, for the 4-story building, the proposed
CSM method overestimated the story shear force of the structure, although the story drift
was underestimated for the 10-story building. Furthermore, the correlation between the
performance results obtained from the proposed CSM method and THA is estimated as
given in Figure 15. The estimated correlation was about 0.9 for the selected earthquakes in
terms of story drift and story shear force for both of the steel buildings with oil dampers.
The estimated correlation indicates that the proposed CSM can be used as a practicalAppl. Sci. 2021, 11, 2687 13 of 15
procedure to estimate the maximum responses of passively controlled buildings equipped
with bilinear oil damping devices.
Figure 12. Comparison of story shear forces between proposed CSM and THA for 4-story building.
Figure 13. Comparison of story drifts between proposed CSM and THA for 10-story building.Appl. Sci. 2021, 11, 2687 14 of 15
Figure 14. Comparison of story shear forces between proposed CSM and THA for 10-story building.
Figure 15. Story drift and shear force correlation of the proposed CSM and nonlinear THA for 4- and
10-story steel buildings.
5. Conclusions
A CSM-based procedure to estimate the maximum seismic response of steel buildings
equipped with bilinear-type oil dampers was proposed, adopting a simple formula to
calculate the effective damping ratio as the sum of the inherent damping and the SRSSAppl. Sci. 2021, 11, 2687 15 of 15
of both supplemental viscous and hysteresis damping ratios. The required steps for the
proposed CSM were given for the ESDOF system equipped with the equivalent oil dampers.
Moreover, the proposed CSM was used to estimate the maximum response of two steel
frame buildings of 4- and 10-stories equipped with bilinear-type oil dampers subjected
to six selected Level-2 earthquake ground motions. The comparison of the maximum
responses with the non-linear THA demonstrates the ability of the proposed CSM to
estimate the maximum responses with an accuracy of more than 80% in all studied cases.
Author Contributions: Conceptualization, T.S. and A.N.; methodology, A.N.; software, T.S.; writing—
original draft preparation, A.N.; writing—review and editing, T.S.; supervision, T.S. Both authors
have read and agreed to the published version of the manuscript.
Funding: This research received no external funding.
Institutional Review Board Statement: Not applicable.
Informed Consent Statement: Not applicable.
Data Availability Statement: The data presented in this study are available on request from the
corresponding author.
Conflicts of Interest: The authors declare no conflict of interest.
References
1. Freeman, S.A. Review of the development of the capacity spectrum method. ISET J. Earthq. Tech. 2004, 4, 1–13.
2. ATC. Seismic Evaluation and Retrofit of Concrete Buildings; Report ATC-40; ATC: Redwood City, CA, USA, 1996.
3. BSL. The Building Standard Law of Japan; The building center of Japan; BSL: Tokyo, Japan, 2004.
4. Kim, H.; Min, K.-W.; Chung, L.; Park, M.; Lee, S.-H. Evaluation of capacity spectrum method for estimating the peak inelastic
responses. J. Earthq. Eng. 2005, 9, 695–718. [CrossRef]
5. Choi, H.H.; Kim, J. Evaluation of proper supplemental damping for a multi-story steel frame using capacity spectrum method.
Adv. Earthq. Eng. 2001, 9, 25–34.
6. Kim, J.; Choi, H.; Min, K.-W. Performance-based design of added viscous dampers using capacity spectrum method. J. Earthq.
Eng. 2003, 7, 1–24. [CrossRef]
7. Li, B.; Liang, X.-W. Design of supplemental viscous dampers in inelastic SDOF system based on improved capacity spectrum
method. Struct. Eng. Mech. 2007, 27, 541–554. [CrossRef]
8. Chen, B.-J.; Chung, L.L.; Tsai, C.S.; Chiang, T.-C. Applications of capacity spectrum method for buildings with metallic yielding
dampers. In Proceedings of the ASME 2005 Pressure Vessels and Piping Conference, Denver, CO, USA, 17–21 July 2005; Volume
8, pp. 299–306.
9. Han, J.; Yan, R.; Li, H. Performance-based seismic design for structures with viscoelastic dampers. J. Earthq. Eng. Eng. Vibr. 2008,
28, 175–181.
10. Benavent-Climent, A.; Escolano-Margarit, D. Shaking table tests of structures with hysteretic dampers: Experimental results
versus prediction using non-linear static methods. Bull. Earthq. Eng. 2012, 10, 1857–1883. [CrossRef]
11. Kim, J.; Kim, M.; Eldin, M.N. Optimal distribution of steel plate slit dampers for seismic retrofit of structures. Steel Comp. Struct.
2017, 25, 473–484.
12. Bantilasa, K.E.; Kavvadias, I.E.; Vasiliadisb, L.K. Capacity spectrum method based on inelastic spectra for high viscous damped
buildings. Earthq. Struct. 2017, 13, 337–351.
13. João, M.C. Estêvão. An Integrated Computational Approach for Seismic Risk Assessment of Individual Buildings. Appl. Sci. 2019,
9, 5088.
14. Ferraioli, M.; Lavino, A. A displacement-based design method for seismic retrofit of RC buildings using dissipative braces. Math.
Probl. Eng. 2018, 2018, 1–28. [CrossRef]
15. Naeem, A.; Kim, J. Seismic retrofit of structures using rotational friction dampers with restoring force. Adv. Struct. Eng. 2020, 23,
3525–3540. [CrossRef]
16. Ramirez, O.M.; Constantinou, M.C.; Gomez, J.D.; Whittaker, A.S.; Chrysostomou, C.Z. Evaluation of Simplified Methods of
Analysis of Yielding Structures with Damping Systems. Earthq. Spectra. 2002, 18, 501–530. [CrossRef]
17. JSSI. Manual for design and construction of passively-controlled buildings. In The Japan Society of Seismic Isolation, 3rd ed.; JSSI:
Tokyo, Japan, 2013. (In Japanese)
18. Kasai, K.; Kibayashi, M. JSSI manual for building passive control technology, Part-1 manual contents and design/analysis
methods. In Proceedings of the 13th World Conference on Earthquake Engineering, Vancouver, BC, Canada, 1–6 August 2004;
Paper No. 2989.Appl. Sci. 2021, 11, 2687 16 of 15
19. Kibayashi, M.; Kasai, K.; Tsuji, Y.; Kikuchi, M.; Kimura, Y.; Kobayashi, T.; Nakamura, H.; Matsuba, Y. JSSI manual for building
passive control technology, Part-2 criteria for implementation of energy dissipation devices. In Proceedings of the 13th World
Conference on Earthquake Engineering, Vancouver, BC, Canada, 1–6 August 2004; Paper No. 2990.
20. Tsuyuki, Y.; Gofuku, Y.; Liyama, F.; Kotake, Y. JSSI manual for building passive control technology, Part-3 performance and
quality control of oil damper. In Proceedings of the 13th World Conference on Earthquake Engineering, Vancouver, BC, Canada,
1–6 August 2004; Paper No. 2468.
21. Adachi, F.; Yoshitomi, S.; Tsuji, M.; Takewaki, I. Nonlinear optimal oil damper design in seismically controlled multi-story
building frame. Soil Dyn. Earthq. Eng. 2013, 4, 1–13. [CrossRef]
22. Adachi, F.; Fujita, K.; Tsuji, M.; Takewaki, I. Importance of interstory velocity on optimal along-height allocation of viscous oil
dampers in super high-rise buildings. Eng. Struc. 2013, 56, 489–500. [CrossRef]
23. Ji, X.; Hikino, T.; Kasai, K.; Nakashima, M. Damping identification of a full-scale passively controlled five-story steel building
structure. Earthq. Eng. Struct. Dyn. 2013, 42, 277–295. [CrossRef]
24. Xie, L.; Cao, M.; Funaki, N.; Tang, H.; Xue, S. Performance study of an eight-story steel building equipped with oil dampers
damaged during the 2011 great east japan earthquake part 1: Structural identification and damage reasoning. J. Asian Arch. Build.
Eng. 2015, 14, 181–188. [CrossRef]
25. Takabatake, H.; Kitada, Y. Approximate method of estimating seismic performance of high-rise buildings with oil-dampers.
Struct. Desig. Tall. Spec. Build. 2018, 27, 1–28. [CrossRef]
26. Chopra, A.K. Dynamics of Structures: Theory and Applications to Earthquake Engineering; Prentice Hall: Englewood Cliffs, NJ,
USA, 2017.
27. Kasai, K.; Fu, Y.; Watanabe, A. Passive control systems for seismic damage mitigation. J. Struct. Eng. 1998, 124, 501–512. [CrossRef]
28. Kasai, K.; Kawanabi, Y. Equivalent linearization to predict dynamic properties and seismic peak responses of a structural system
with high viscous damping and hysteretic damping. J. Struc. Cons. Eng. 2005, 591, 43–51. (In Japanese) [CrossRef]
29. Kuramoto, H.; Teshigawara, M.; Lkuzono, T.; Koshika, N.; Takayama, M.; Hori, T. Predicting the earthquake response of buildings
using equivalent single degree of freedom system. In Proceedings of the 12th World Conference on Earthquake Engineering,
Auckland, New Zealand, 30 January–4 February 2000; Paper No.1039.
30. Fu, Y.; Kasai, K. Comparative study on frames using viscoelastic and viscous dampers. J. Struc. Eng. 1988, 124, 513–522. [CrossRef]
31. Sekiya, E.; Mori, H.; Ohbuchi, T.; Yoshie, K.; Hara, H.; Arima, F.; Takeuchi, Y.; Saito, Y.; Ishii, M.; Kasai, K. Details of 4-, 10-, and
20-story theme structure used for passive control design examples. In The JSSI Response Control Committee Symposium on Passive
Vibration Control; JSSI: Tokyo, Japan, 2004. (In Japanese)
32. Saito, T. Structural Earthquake Response Analysis, STERA_3D Version 10.8. and STERA_WAVE Version 1.0. Available online:
http://www.rc.ace.tut.ac.jp/saito/software-e.html (accessed on 24 December 2020).You can also read