EARTHQUAKE LOSS ESTIMATION FOR THE KATHMANDU VALLEY
←
→
Page content transcription
If your browser does not render page correctly, please read the page content below
EARTHQUAKE LOSS ESTIMATION FOR THE KATHMANDU
                         VALLEY
     Hemchandra CHAULAGAIN1, Hugo RODRIGUES2, Enrico SPACONE3, Humberto
                                 VARUM4

ABSTRACT

The capital city, Kathmandu, is the most developed and populated place in Nepal. The majority of the
administrative offices, headquarters, numerous historical monuments, and eight World Heritages sites
are in the Kathmandu Valley. However, this region is geologically located on lacustrine sediment
basin, characterized by a long history of destructive earthquakes. The past events resulted in great
damage of structures, losses of human life’s and property, and interrupted the social development.
Therefore, earthquake disaster management is one of the most serious issues in highly seismically
active regions such as the Kathmandu Valley. In recent years, the earthquake risk in this area has
significantly increased due to uncontrolled development, poor construction practices with no
earthquake safety consideration, and lack of awareness amongst the general public and government
authorities. In this context, this study explores the realistic situation of earthquake losses due to future
earthquakes in Kathmandu Valley. To this end, three municipalities: (a) Kathmandu metropolitan city
(KMC), (b) Lalitpur Sub-Metropolitan City (LSMC) and (c) Bhaktapur Municipality (BMC) are
selected for study. The earthquake loss estimation in the selected municipalities is performed through
the combination of seismic hazard, structural vulnerability, and exposure data. For what concerns the
seismic input, various earthquake scenarios considering four seismic sources in Nepal were adopted.
Regarding the exposure, data about the type of existing buildings, population, and ward level
distribution of building typologies is estimated from the recent national census survey of 2011. The
economic losses due to the scenario earthquakes are determined using fragility functions. The
commonly used standard fragility curves are adopted for adobe, brick/stone with mud mortar
buildings, and brick/stone with cement mortar buildings. For the reinforced concrete structures, a new
fragility model was derived considering four construction typologies: i) current construction practices
(CCP), ii) structures according to the Nepal buildings code (NBC), iii) structures according to the
modified Nepal building code (NBC+) and iv) well designed structures (WDS). In this study, a set of
fragility functions is converted into a vulnerability model through a consequences model. Finally, the
ward level distribution of damage for each building typology, building losses and the corresponding
economic loss for each scenario earthquake is obtained using the OpenQuake-engine. The distribution
of damage within the Kathmandu Valley is currently being employing in the development of a shelter
model for the region, involving various local authorities and decision makers.

Keywords: Nepalese buildings; Kathmandu Valley; scenario earthquake; fragility curves

1
  PhD student, University of Aveiro, Portugal, hchaulagain@ua.pt
2
  Dr, Polytechnic Institute of Leiria, Portugal, hugo.f.rodrigues@ipleiria.pt
3
  Dr, University of Chieti-Pescara, Italy, espacone@unich.it
4
  Dr, University of Aveiro, Portugal, hvarum@ua.pt

                                                         1
1 INTRODUCTION
Nepal is located in a seismically active region with a long history of devastating earthquakes. The
main cause of earthquakes in Nepal is due to the subduction of the Indian plate underneath the
Eurasian plate. The major damaging earthquakes in Nepal took place in the years of 1255, 1408, 1681,
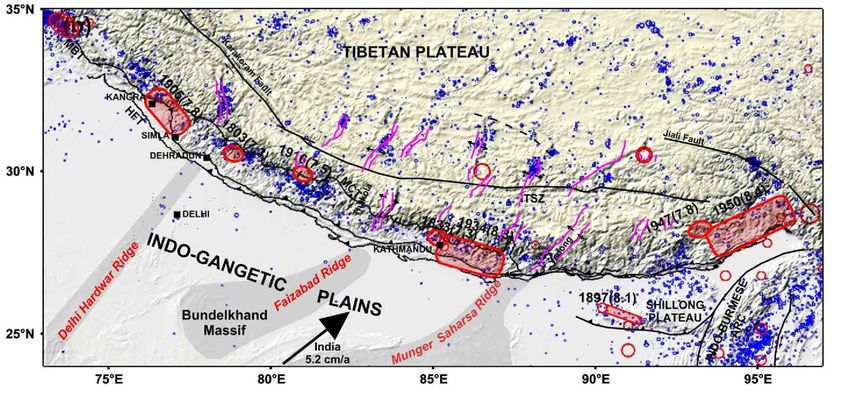
1803, 1810, 1833, 1934 and 1988 (Bilham et al., 1995; Pandey et al., 1995). As presented in figure1,
Nepal and adjoining Himalayan arc has experienced some great historical earthquakes including the
1897 Shillong earthquake, 1905 Kangara earthquake, 1934 Bihar-Nepal earthquake, and 1950 Assam
earthquake. These earthquakes scenario evidently indicate that the entire Himalayan region is one of
the most active zones in terms of seismic hazard. Recent research on fault modeling of Nepal
Himalayan arc has also shown continuous accumulation of elastic strain to reactive older geological
faults, which may generate earthquakes strong magnitude (Chamlagain and Hayashi, 2004 and 2007).
The Kathmandu Valley is situated almost in the middle of Nepal, and is constituted by three
administrative districts: Kathmandu, Lalitpur, and Bhaktapur. This region is composed by lacustrine
sediments, which are considered to have high earthquake wave amplification capacity. The
urbanization has been rapid throughout the Valley, and all of the urban settlements exhibit rapid
growth around their periphery. Amongst the major earthquakes in recorded history, the Great Bihar-
Nepal Earthquake of 1934 with a maximum intensity of X (MMI) caused extensive damage in the
Kathmandu Valley (Dunn et al., 1939; Pandey and Molnar 1988). The total death toll in Nepal was
8,519, from which 4,296 occurred in the Kathmandu Valley alone. In this earthquake about 19% of the
building stock collapsed and 38% experienced significant damage just in the Kathmandu Valley
(Pandey and Molnar 1988; Rana 1935). Furthermore, past studies showed that the human and
economic losses due to earthquake are related with the development index of a country (Erdik and
Durukal, 2008). The 1987 Loma Prieta earthquake (USA) caused only 62 deaths in the Bay Area, but
the economic loss was estimated to be $4.7 billion. In a similar scale earthquake in Spitak (Armenia),
over 20,000 people perished, but the economic loss was in the order of $570 million (Chatelian et al.,
1999). As an underdeveloped country, earthquake consequences in Nepal might be more tragic than
what was observed in Spitak.
Figure 1. Major tectonic features and seismicity in the Himalayan arc. The ruptures of earthquakes of Mw> 7.2
of past 200 years in the Himalayan arc are shown by red rounded rectangles and ellipses. Earthquakes of Mw> 7
> 7.2 are also shown by red circles (Gupta and Gahalaut, 2014)
This study explores the realistic situation of losses and damages due to the four scenario
earthquakes. The three damage states are used to estimate the distribution of damage. Two damage
states of criteria are considered in these analyses: inter-storey drift, and global drift for each prototype
building. The static pushover to incremental dynamic analysis (SPO2IDA) tool is employed for the
derivation of fragility functions for Nepalese reinforced concrete (RC) buildings. It provides a direct
connection between the static curve and the results of incremental dynamic analysis (Vamvatsikos and
Cornell, 2006). The results of the analysis are summarized into their 16%, 50%, and 84% fractile IDA
curves. In this study, sets of fragility functions for each building type are converted into vulnerability
2H Chaulagain, H Rodrigues, E Spacone, V Silva, H Varum 3
functions through the employment of consequence models. In this process, the percentage of buildings
in each damage state is computed at each intensity level, and multiplied by the respective damage
ratio. These results can be used for seismic risk reduction or mitigation measures.
2 EARTHQUAKE LOSS ESTIMATION
2.1 Earthquake scenarios
Regarding the earthquakes in and around Nepal Himalaya, the epicentral distribution map indicates
that seismicity is active in the western and eastern part of Nepal. The central part of Nepal has suffered
relatively few earthquakes (Pandey et al., 1999). Pandey et al., (1999) describes four (250-400 km)
long segments that could produce earthquakes comparable to the M=8.3 (Mw) Bihar Nepal earthquake
that struck eastern Nepal in 1934. Scenario earthquakes 1, 2, and 3 are selected considering past
studies, orientation of active faults and seismicity in and around Nepal Himalaya where as earthquake
4 is based on the historical event (1934 Bihar- Nepal earthquake). The characteristic of scenario
earthquakes is presented in Table 1. Location of vertical project of the fault rupture surfaces for the
four scenarios is shown in figure 2.
Table 1. Characteristics of scenario earthquakes in Nepal
Magnitude Fault trace
S.N Scenario EQ Hypocenter
(Mw) Fault coordinate 1 Fault coordinate 2
1 EQ 1 6.0 28.08 85.17 27.929 85.288 28.244 85.050
2 EQ 2 7.0 27.00 85.48 27.263 84.551 26.751 86.407
3 EQ 3 8.0 28.42 82.93 27.816 83.664 29.018 82.225
4 EQ 4 8.2 27.56 87.07 27.757 85.958 27.365 88.183
80° E 82° E 84° E 86° E 88° E
30° N
30° N
EQ3 EQ1
28° N
28° N
KTM
EQ4
EQ2
26° N
80° E 82° E 84° E 86° E 88° E
Figure 2. Location of fault trace for scenario earthquakes in Nepal
2.2 Characteristics of the building stock in Kathmandu Valley
The characterization of the buildings in Kathmandu Valley was performed during the National
Population and Housing Census in 2011 (CBS, 2012). The information obtained from the National
Census Report includes: types of foundation of house, type of outer wall and type of roof of the house.
The distribution of building structures in Nepal and location of Kathmandu Metropolitan City (KMC),
Lalitpur Sub-Metropolitan City (LSMC) and Bhaktapur Municipality (BMC) is presented in figure 3.
The distribution of building according to the building taxonomy in studied municipalities is presented
in Table 2. The census survey data indicates that mud bonded bricks/stones (BM/SM), cement bonded
bricks/stones (BC/SC), and reinforced concrete (RC) buildings are the most common buildingtypologies in the Kathmandu Valley. In this study, the mixed buildings like stone and adobe, stone and
brick in mud, brick in mud and brick in cement are considered as a single typology (adobe), since their
structural vulnerability is identical. Four types of reinforced concrete buildings are considered in the
present study. The first type corresponds to a moment resisting frame designed according to the
current construction practices in Nepal (CCP structure); the second design type is based on Nepal
building code based on Mandatory Rules of Thumb (NBC structure); the third type of structure
follows a modified version of the Nepal building code (NBC+ structure) and the last type of RC frame
represent the moment resisting frames which are designed based on the Indian standard code, which
contains adequate seismic provisions (Well Designed Structures - WDS) (Chaulagain et al., 2013).
80°0'0"E 81°0'0"E 82°0'0"E 83°0'0"E 84°0'0"E 85°0'0"E 86°0'0"E 87°0'0"E 88°0'0"E
31°0'0"N
BMC
LSMC
KMC
30°0'0"N
30°0'0"N
29°0'0"N
29°0'0"N
28°0'0"N
28°0'0"N
27°0'0"N
27°0'0"N
26°0'0"N
26°0'0"N
80°0'0"E 81°0'0"E 82°0'0"E 83°0'0"E 84°0'0"E 85°0'0"E 86°0'0"E 87°0'0"E 88°0'0"E
Figure 3. (a) Distribution of building structures in Nepal and (b) Location of case study Municipalities in
Kathmandu Valley
Table 2. Buildings in Kathmandu Metropolitan City, Lalitpur Sub-Metropolitan City, and Bhaktapur
Municipality
Location A BM BC CCP NBC NBC+ WDS
BMC 531 5468 4761 5229 551 551 551
LSMC 1635 14739 16374 16593 1746 1746 1746
KMC 4629 59807 89699 76144 8013 8013 8013
2.3 Development of exposure model
For the development of exposure model, a new set of building classes have been defined to distinguish
each construction typology according to its seismic vulnerability. As discussed in section 2.2, adobe,
mud bonded brick, mud bonded cement, cement bonded brick, cement bonded stone, RC buildings
(CCP, NBC, NBC+, and WDS buildings) are the most common typologies in the Kathmandu
Metropolitan city, Lalitpur Sub-Metropolitan City and Bhaktapur Municipality. For the sake of
simplicity, the vulnerability of buildings classified as mixed and other not stated categories in the
national census survey are considered to have a similar performance as adobe. The fractions of CCP,
NBC, NBC+ and WDS structures are considered as 76%, 8%, 8% and 8% respectively (Dixit 2004;
Shrestha and Dixit, 2008). Considering the classification of buildings and their respective volume
tabulated in Tables 3, a ward level exposure model containing the number of buildings from each
vulnerability class was created. The vulnerability class and its corresponding volume is based on
JICA, 2002; NPHC, 2012; and Chaulagain et al., 2013 study. For the purpose of computing the
seismic hazard for each asset, it was assumed that all of the buildings are equally distributed within the
whole ward, which is a common assumption when performing seismic risk assessment at a large scale
(e.g. Bommer et al., 2002; Crowley et al., 2008).
4H Chaulagain, H Rodrigues, E Spacone, V Silva, H Varum 5
Table 3. Vulnerability classes for building stock in Kathmandu Metropolitan city, Lalitpur
Submetropolitan city, and Bhaktapur Municapility
% of buildings
SN Building Types Kathmandu Lalitpur Bhaktapur
Metropolitan city Submetropolitan city Municipality
1 A 2 3 3
2 BM/SM 26 27 31
3 BC/SC 33 30 27
4 CCP 30 31 30
5 NBC 3 3 3
6 NBC+ 3 3 3
7 WDS 3 3 3
2.4 Estimation of economic value
The spatial distribution of building count is fundamental component for earthquake scenario damage
assessment, which can then be used to create post-disaster emergency plans or to design risk
mitigation strategies. However, in order to estimate the associated economic losses, it is necessary to
attribute a building cost to each typology. In the present study, the building cost is established as the
required monetary value to construct a building with the same characteristics according to the current
costs, herein termed as the replacement cost. This value naturally depends on the location and total
area of the building. However, for the simplicity, same building cost is applied to the whole country.
Table 4 presents the construction type, area per building type and corresponding construction cost.
Table 4. Area and corresponding construction cost of existing Nepalese building stock
SN Construction type Area per building (m2) Construction cost (€/m2)
1 A 60 150
2 BM 70 225
3 BC 80 275
4 CCP 80 300
5 NBC 80 325
6 NBC+ 80 350
7 WDS 90 375
2.5 Fragility function for Nepalese building structures
In the present study, for the earthquake loss estimation of the cities in Kathmandu Valley, the
commonly used standard fragility functions and a new fragility functions are used. The analytical
methodology is used to generate new fragility curves. The structural models for RC buildings are
created considering the geometrical and material properties of Nepalese RC buildings (Chaulagain et
al., 2013). The SPO2IDA, excel sheet program developed by Vamvatsikos and Cornell (2006) is
employed for converting static pushover curve to incremental dynamic analysis. SPO2IDA represents
a tool that is capable of recreating the seismic behavior of oscillators with complex multi-linear
backbones at almost any period. It provides a direct connection between the static pushover curve and
the results of incremental dynamic analysis, a computer-intensive procedure that offers thorough
(demand and capacity) prediction by using a series of non-linear dynamic analyses under a suitably
scaled suite of ground motion records. The results of the analysis are summarized into their 16%, 50%,
and 84% fractile IDA curves. It offers effectively instantaneous estimation of demands and limit-state
capacities, in addition to conventional strength reduction R-factor and inelastic displacement ratios, for
any SDOF whose SPO curve can be approximated by such a quadrilinear backbone. The mean (λ) and
standard deviation (ζ) per damage state for each building typology in terms of spectral acceleration at
the yielding period (Ty) and in terms of peak ground acceleration is presented in Tables 5 and 6.Table 5. The mean (λ) and standard deviation (ζ) per damage state for each building typology in terms
of spectral acceleration at the yielding period (Ty)
Building T Moderate Extensive Collapse
typology (sec) (λ) (ζ) (λ) (ζ) (λ) (ζ)
CCP 0.38 0.25 0.13 0.71 0.17 1.22 0.27
NBC 0.32 0.35 0.17 0.85 0.20 1.35 0.32
NBC+ 0.25 0.45 0.17 1.00 0.35 1.57 0.32
WDS 0.21 0.57 0.20 1.33 0.30 1.73 0.38
Table 6. The mean (λ) and standard deviation (ζ) per damage state for each building typology in terms
of peak ground acceleration
Building Moderate Extensive Collapse
typology (λ) (ζ) (λ) (ζ) (λ) (ζ)
Adobe -3.22 0.65 -1.99 0.77 -1.45 0.64
BM -2.14 0.72 -1.66 0.72 -1.05 0.66
BC -1.82 0.68 -1.06 0.67 -0.62 0.72
2.6 Consequence model employed to convert fragility curves into vulnerability curves
Consequence models can be used to convert a set of fragility functions into a vulnerability function. In
this process, the percentage of buildings in each damage state is computed at each intensity measure
level, and multiplied by the respective damage ratio, obtaining in this manner a loss ratio for each
level of peak ground acceleration or spectral acceleration. Consequence model used in the
development of the vulnerability model for the Nepalese RC building stock is presented in Table 7.
Table 7. Consequence model used in the development of the vulnerability model for the Nepalese RC
building stock
Damage state Damage ratio
Moderate damage 0.30
Extensive Damage 0.60
Collapse 1.00
2.7 Site effects
Site conditions play a major role in establishing the damage potential for incoming seismic waves
from major earthquakes. Damage patterns in Mexico City after the 1985 Michoacan earthquake
demonstrated conclusively the significant effects of local site conditions on seismic response of the
ground. The bed rock outcrop motions were amplified about five times. In the 1989 Loma Prieta
earthquake, major damage occurred on soft soil sites in the San Francisco – Oakland region where the
spectral accelerations were amplified two to four times over adjacent rock sites (Housner 1989), and
caused severe damage. It shows that surface-level peak ground acceleration and spectral acceleration
values can be different from bedrock values, depending on local soil conditions. In fact, shaking is
stronger where the shear wave velocity is lower. Amplification of amplitudes of soil particle motion
from vertically propagating shear waves occurring from bed rock depends upon the geotechnical
properties of overburden soil. The soil types, pore-water pressure, and the level of water table are
other significant site parameters. All these evidence clearly indicates that seismic design should
incorporate the amplification effects of local soil conditions. To account for this shaking amplification
effect, the average shear wave velocity in the top 30 m of a site (V30) is universally adopted as the
classifying parameter. The National Earthquake Hazards Reduction Program (NEHRP) has defined 5
soil types namely A, B, C, D, and E based on their shear-wave velocity (Vs). This site classification
according to NEHRP-USA (BSSC, 2001) is shown in Table 8. The site effect in the present study is
considered according to V30 values in and around Kathmandu Valley.
6H Chaulagain, H Rodrigues, E Spacone, V Silva, H Varum 7
Table 8. Site classification according to NEHRP-USA (BSSC, 2001)
Site class Range of V30 (km/s) Description
A V30 > 1.5 Includes unweathered intrusive igneous rock
B 0.76 < V30 ≤ 1.5 Includes volcanics, most Mesozoic bedrock, and some Franciscan bedrock
C 0.36 < V30 ≤ 0.76 Includes some Quaternary sands, sandstones and mudstones
Includes some Quaternary muds, sands, gravels, silts and mud. Significant
D 0.18 < V30 ≤ 0.36
amplification of shaking by these soils is generally expected
Includes water-saturated mud and artificial fill. The strongest amplification of
E V30 ≤ 0.18
shaking due is expected for this soil type
3 RESULTS
3.1 Damage distribution per taxonomy in Kathmandu
The damage distribution for each building typology in selected municipalities are determined using
OpenQuake-engine. The tool is capable of estimating the distribution of buildings in each damage
state due to the occurrence of a single event. The damage distribution for the deterministic seismic
event was estimated using the fragility model. The damage distribution output is comprised of a set of
damage nodes for which the amount of buildings in each damage state is described. The OpenQuake-
engine provides a damage distribution per buildings typology or the total damage distribution.
collapse extensive damage moderate damage no damage
collapse extensive damage moderate damage no damage
100
Damage states
100
Damage states
80 80
60 60
40 40
20 20
0 0
A BM A
BC BM BC
CCP NBC CCP NBC
NBC+ WDS NBC+ WDS
Building types Building types
(b)
(a)
collapse extensive damage moderate damage no damage collapse extensive damage moderate damage no damage
100 100
Damage states
Damage states
80 80
60 60
40 40
20 20
0 0
A BM A BM
BC CCP NBC BC CCP NBC
NBC+ WDS NBC+ WDS
Building types Building types
(c) (d)
Figure 4. Building damage due to earthquake scenarios: a) EQ1, b) EQ2, c) EQ3 and d) EQ4
The structural damage to Nepalese buildings is classified into four groups: (1) no damage, (2)
moderate damage, (3) extensive damage, and (4) collapse. The results indicates that there was three
different damage patterns were observed in all four earthquake scenarios. The first scenario (EQ1)
yields very low damage levels. The second and third scenarios (EQ2 and EQ3) yields intermediate
damage levels. The fourth scenario (EQ4) yields much higher level of damage. From figures 4 and 5,
it can be seen that about 49% of adobe buildings collapsed in BMC due to scenario earthquake 4. The
amount is limited to 40% in LSMC and KMC. There is a remarkable collapse rate in BM, BC, and
CCP buildings. From the results, it is also seen that the maximum amount of buildings are collapseddue to scenario earthquake EQ4. The amount is 33% in BMC, 23% in LSMC and 21% in KMC. As
expected, scenario EQ1 results minimal damage. The collapse of buildings as a result of EQ1 is
limited to 2.06% in BMC, 1.06% in LSMC and 1.15% in KMC. Scenario earthquakes EQ2 and EQ3
result the intermediate building damage.
85°16'0"E 85°17'0"E 85°18'0"E 85°19'0"E 85°20'0"E 85°21'0"E 85°22'0"E 8 5°17'0 "E 85 °18'0 "E 85 °1 9'0" E 85°2 0'0" E
27°45'0"N
27°45'0"N
Buildings collapse in KMC Bu ildi ngs colla pse in L SM C
11,000 2,7 0 0
2 7°41 '0 "N
Total_buildings To tal _ bu i l di n gs
27 °4 1'0" N
27°44'0"N
27°44'0"N
Collapse_EQ4 Co l a ps e _EQ 4
Collapse_EQ3 Co l a ps e _EQ 3
Collapse_EQ2 Co l a ps e _EQ 2
Collapse_EQ1 Co l a ps e _EQ 1
27°43'0"N
27°43'0"N
2 7°40 '0 "N
27 °4 0'0" N
27°42'0"N
27°42'0"N
27°41'0"N
27°41'0"N
2 7°39 '0 "N
27 °3 9'0" N
27°40'0"N
85°16'0"E 85°17'0"E 85°18'0"E 85°19'0"E 85°20'0"E 85°21'0"E 85°22'0"E 85 °1 7'0" E 85°18 '0" E 8 5°19 '0 "E 8 5°20'0 "E
(a) (b)
85°25'0"E 85°26'0"E 85°27'0"E
Buildings collapse in BMC
1,300
Total_buildings
Collapse_EQ4
Collapse_EQ3
Collapse_EQ2
Collapse_EQ1
27°41'0"N
27°41'0"N
27°40'0"N
27°40'0"N
85°25'0"E 85°26'0"E 85°27'0"E
(c)
Figure 5. Ward level distribution of building collapse in (a) KMC, (b) LSMC and BMC
3.2 Economic loss map
The ward level distribution of economic loss map as a result of four scenario earthquakes in
Kathmandu Metropolitan city, Latipur Sub metropolitan and Bhaktapur municipality is presented in
figure 6. The economic loss due an earthquake scenario EQ1, EQ2, EQ3 and EQ4 in Bhaktapur
Municipality is 3.83, 4.65, 8.11, and 19.56 million Euros respectively. The amount is increased by
7.75, 10.36, 20.15, and 47.74 million Euros respectively in Lalitpur Sub-Metropolitan City. The
economic loss is maximum in Kathmandu Metropolitan City. The cost is 36.82, 42.21, 89.48, and
208.97 million Euros respectively for an earthquake EQ1, EQ2, EQ3 and EQ4.
8H Chaulagain, H Rodrigues, E Spacone, V Silva, H Varum 9
85°16'0"E 85°17'0"E 85°18'0"E 85°19'0"E 85°20'0"E 85°21'0"E 85°22'0"E 85°17'0"E 85°18'0"E 85°19'0"E 85°20'0"E
27°45'0"N
27°45'0"N
Economic losses (€) in KMC Economic losses (€) in LSMC
90,000,000 24,000,000
Loss_EQ1 Loss_EQ1
27°41'0"N
27°41'0"N
Loss_EQ2 Loss_EQ2
27°44'0"N
27°44'0"N
Loss_EQ3 Loss_EQ3
Loss_EQ4 Loss_EQ4
27°43'0"N
27°43'0"N
27°40'0"N
27°40'0"N
27°42'0"N
27°42'0"N
27°41'0"N
27°39'0"N
27°41'0"N
27°39'0"N
27°40'0"N
85°16'0"E 85°17'0"E 85°18'0"E 85°19'0"E 85°20'0"E 85°21'0"E 85°22'0"E 85°17'0"E 85°18'0"E 85°19'0"E 85°20'0"E
(a) (b)
85°25'0"E 85°26'0"E 85°27'0"E
27°42'0"N
27°42'0"N
Economic losses (€) in BMC
15,000,000
Loss_EQ1
Loss_EQ2
Loss_EQ3
Loss_EQ4
27°41'0"N
27°41'0"N
27°40'0"N
27°40'0"N
85°25'0"E 85°26'0"E 85°27'0"E
(c)
Figure 6. Ward level distribution of economic loss in (a) KMC, (b) LSMC and BMC
4 CONCLUSIONS
The rapid urban development in Kathmandu Valley has lead to increase in the exposure levels of the
urban vulnerability. Due to the steadily increasing population with improper land-use planning,
inappropriate construction techniques and inadequate infrastructure systems, associated with an
existing high hazard level, Kathmandu is one of the most risky city in the south Asian region.
Considering these facts, this study tries to explore the situation of earthquake losses in three
municipalities located in Kathmandu Valley. We evaluate an earthquake losses in three cities
determined as a convolution of seismic hazard, vulnerability, and exposure of infrastructures.
Regarding the damage distribution, three damage patterns are observed in the four scenario
earthquakes. The earthquake EQ1 yields low damage level. The maximum damage is observed in the
scenario earthquake EQ4. The result also shows that about 49% of adobe buildings collapsed in BMC
due to EQ4. The amount is limited to 40% in LSMC and KMC. There is a remarkable collapse rate in
BM, BC, and CCP buildings. From the outcomes, it is also seen that the maximum amount of
buildings are collapsed due to EQ4. The amount is 33% in BMC, 23% in LSMC and 21% in KMC. As
expected EQ1 results minimal damage. The collapse is limited to 2.06% in BMC, 1.06 in LSMC and
1.15 in KMC. Scenario earthquakes EQ2 and EQ3 result the intermediate building damage. The
economic loss due an earthquake scenario EQ1, EQ2, EQ3 and EQ4 in Bhaktapur Municipality is
3.83, 4.65, 8.11, and 19.56 million Euros respectively. The amount is 7.75, 10.36, 20.15, and 47.74
million Euros respectively in Lalitpur Sub-Metropolitan City. The economic loss is higher in
Kathmandu Metropolitan City. The cost is 36.82, 42.21, 89.48, and 208.97 million Euros respectively
for an earthquake EQ1, EQ2, EQ3 and EQ4.Acknowledgements
This research was partially developed under financial support provided by “FCT - Fundação para a
Ciência e Tecnologia”, Portugal, through the research project PTDC/ATP-AQI/3934/2012. This
research was also supported by the Eurasian University Network for International Cooperation in
Earthquake (EU-NICE), through the fellowship for PhD studies of the first author.
REFERENCES
Bilham R, Bodin P, Jackson M. Entertaining a great earthquake in western Nepal: historic inactivity
and geodetic tests for the present stste of strain. J Nepal Geol Soc 11 (1):73-78, 1995.
Bommer JJ, Spence R, Erdik M, Tabuchi S, Aydinoglu N, Booth E, Re DD, Pterken D. Development of
an earthquake Model for Turkish Catastrophe Insurance. Journal of seismology, 6:431-116, 2002.
BSSC. NEHRP recommended Part 1: Provisions prepared by the Building Seismic Safety Council for the
Federal Emergency Management Agency (FEMA 368), Washington DC, USA, 2001.
Central Bureau of Statistics. National Population and Housing Census 2011. National Report, National
Planning Commission Secretariat, Central Bureau of Statistics, Kathmamdu, Nepal, Npvember, 2012.
Chamlagain D, Hayashi D. Numerical simulation of fault development along NE-SW Himalayan profile in
Nepal. Journal of Nepal Geological Society 29, 1-11, 2004.
Chamlagain D, Hayashi D. Neotectonic fault analysis by 2d finite-element modeling for studying the Himalayan
fold-and-thrust belt in Nepal. Journal of Asian Earth sciences 29, 473-489, 2007.
Chatelaine JL, Tucker B, Guillier B, Kaneko F, Yepes H, Fernandez J, Valverde J, Hoefer G, Souris M, Duperier
E, Yamada T, Bustamante G and Villacis C. Earthquake risk management pilot project in Quito,
Ecuador. Geo Journal 49: 185-196, 1999.
Chaulagain H, Rodrigues H, Jara J, Spacone E, and Varum H. Seismic Response of Current RC Buildings
in Nepal: A Comparative Analysis of different Design/ Construction. Engineering Structure 49; 284-
294, 2013.
Crowley H, Borzi B, Pinho R, Colombi M, Ondida, M . Comparison of two mechanics- based methods for
simplified structural analysis in vulnerability assessment. Advances in civil Engineering, 2008:19,
2008.
Dixit, A. Promoting SaferBuildings in Nepal. thirteen World Conference on Earthquake Engineering.
Paper No. 1717, 2004.
Dunn JA, Auden JB, Gosh ANM, ROY SC. The Bihar- Nepal earthquake of 1934. Mem Geol Surv India 73:391,
1939.
Erdik M, Durukal E. Earthquake risk and its mitigation in Istanbul. Nat Hazards 44:181-197, 2008.
Gupta H, Gahalaut VK. Seismotectonics and large earthquake generation in the Himalaya region.
Gondwana research, Vol 25, 204-213, 2014.
Housner, G.W. Competing against time. Report to Governor Deukmejian of California, Governor’s
Board of Inquiry on the 1989 Loma Prieta Earthquake, 1989.
JICA. The study on Earthquake disaster mitigation in the Kathmandu Valley , Kingdom of Nepal, Japan
International Cooperation Agency and the Ministry of Home Affairs of Nepal, Vol I, II and III, 2002.
Pandey MR, Tandukar RP, Avouac JP, Lave J, Massot JP. Interseismic strain accumulation on the Himalayan
crustal ramp (Nepal). geophys Res Lett 22(7):751-754, 1995.
Pandey MR, Molnar P. The distrubition of intensity of the Bihar_Nepal earthquake 15 January 1934 and bounds
of the extent of the rupture zone. J Nepal Geol Soc 5:22-44, 1988.
Pandy MR, Tandukar RP, Avouac JP, Vergne J, Heritier Th. Seismotectonics of Nepal Himalaya from a
local seismic network. Journal of Asian Earth Science 17, 703-712, 1999.
Rana BJB. Nepal ko Maha Bhukampa (Great earthquake of Nepal). Jorganesh press, Kathmandu, 1935.
Shrestha, B. and Dixit, A.M. Standard Design for Earthquake Resistant Buildings and Aid to Bildings
Code Implementation in Nepal. fourteen World Conference on Earthquake Engineering, 2008.
Vamvatsikos D, Cornell CA. Direct estimation of the seismic demand and capacity of oscillators with
multilinear static pushovers through Incremental Dynamic Analysis, earthquake Engineering and
Structural Dynamics, 35(9): 1097-1117, 2006.
OpenQuake repository: https://github.com/gem/openquake/tree/master/docs/schema
10You can also read