In Partnership With The Landscape Biodiversity Lab At Montana State University - Sonoran Institute
←
→
Page content transcription
If your browser does not render page correctly, please read the page content below
In Partnership With The Landscape Biodiversity Lab At Montana State University
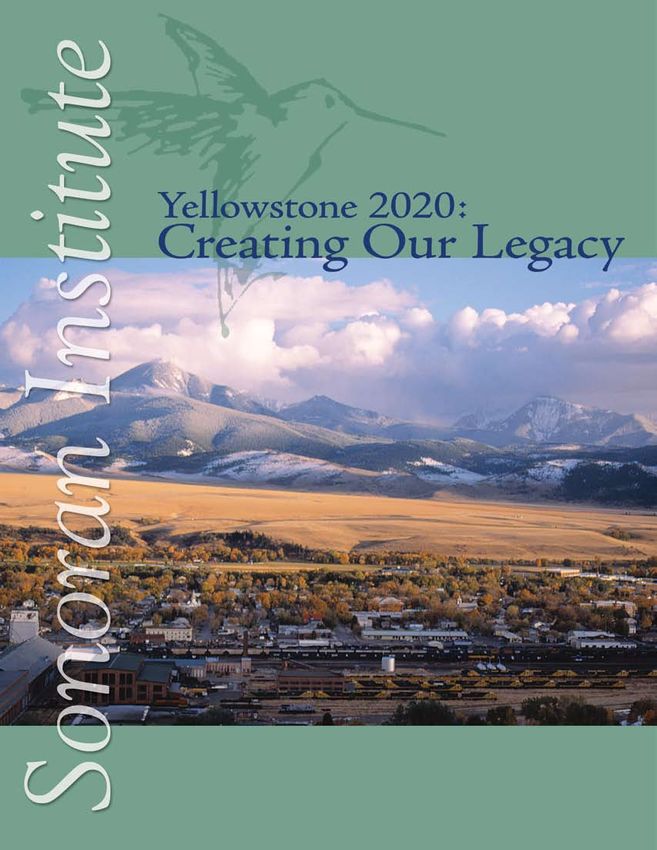
Yellowstone 2020:
   Creating Our Legacy

                 Table of Contents
Introduction ..................................................... 1
Background ...................................................... 2
    Map 1-Yellowstone Region ........................ 2
     Figure 1-Population Growth .................... 2
Drivers of Rural Development ....................... 3
    Table 1-Simulation Assumptions . ............ 4
Future Development Scenarios ....................... 5
    Map 2-Core Growth Areas . ..................... 5
    Figure 2-Rural Home Growth .................. 6
    Table 2-Forecasted Land Use Change ...... 6
    Map 3-Impacts of Growth ........................ 7
Conclusions ...................................................... 8
Acknowledgments ............................................. 9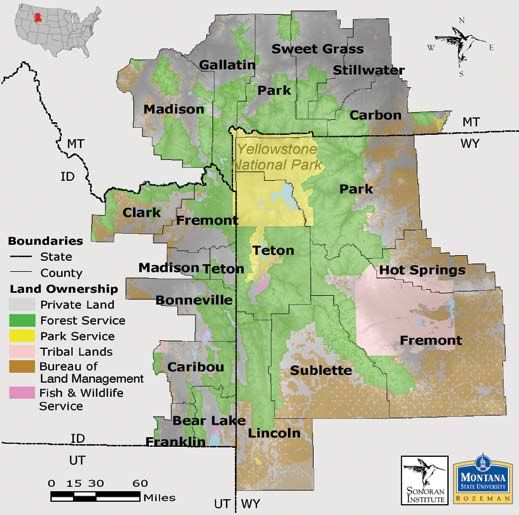
Introduction
                                                                                                         This report is a shorter,
                                                                                                         popularized version of a
                                                                                                         comprehensive analysis
                                                                                                         done at Montana State
                                                                                                         University in collaboration
                                                                                                         with the Sonoran Institute.
                                                                                                         The study was done
                                                                                                         by Patricia Gude under
                                                                                                         the advisement of
                                                                                                         Dr. Andrew Hansen,
                                                                                                         Dr. Ray Rasker, and
                                                                                                         Dr. Bruce Maxwell.
                                                                                                         A full description of the

T
                                                                                                         study can be found at:
          he American West is growing                  continue with current land use policies. We
                                                                                                         www.montana.edu/etd/
          rapidly. Incredible landscapes,              pose alternative growth scenarios to illustrate
          friendly communities, and abundant                                                             available/hernandez_
                                                       how the actions taken now by landowners,
recreational opportunities draw thousands of           county commissioners, planners, and citizens      04.html.
new residents every year. In fact, population          will affect the future of our communities.        For additional information
growth rates of western American states                                                                  on the full report, contact
far outpace the national average. More                   Land use policies put in to practice now
                                                                                                         patty@sonoran.org.
significantly, the rate of land development is         will determine what our communities, natural
growing much faster than the population.               areas, and economies will be far into the
We’re building bigger homes on bigger lots,            future. With effective planning, our legacy
and using more land than ever before.                  for the Yellowstone region can be vibrant
                                                       communities, prosperous economies and
  The Yellowstone region (the lands in the 20          open spaces.
counties surrounding Yellowstone National
Park), is experiencing these trends. Since
1970, population growth in the Yellowstone
region has been occuring faster than in 78
percent of counties in the United States. Land
consumption–the amount of land developed
for new housing–grew by a staggering 350
percent. From valley to valley, the landscape is
being transformed from farms, ranches, and
natural areas to subdivisions and paved roads.

  Because it is such a wonderful place to live,
we know that the West will continue to grow.
The question we must ask is: what sort of
growth will we have and where will it occur?

  Before we can successfully plan for growth,
we should understand how we got where we
are. This report starts by describing factors
that influence the location of growth. Then,
using past trends and patterns, we project
where growth will occur in the future – if we

                                                   1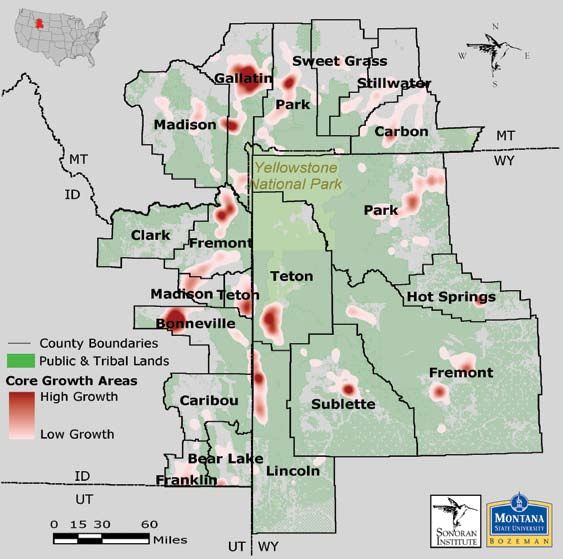
Background
WHAT IS
SMART GROWTH?
                                          The results and recommendations of this
Smart growth strengthens               report focus on the 20 counties of Idaho,
economies, communities, and
                                       Montana, and Wyoming that make up the
the environment.
                                       Yellowstone area (see Map 1). However, these
Smart growth:                          findings can be applied to any region of the
• Uses land and existing               West experiencing rapid growth where wide
  infrastructure like roads,           open spaces and friendly communities are
  schools, fire, and police services   absorbing new migrants.
  efficiently;
                                         The Yellowstone region is 36 million
• Protects clean air and water                                                                Figure 1. Growth in population
                                       acres, of which 32 percent is privately                versus growth in rural residential
  by preserving farmland and
                                       owned. With roughly 370,000 permanent                  development from 1970-2000 in
  natural areas;
                                       residents in 2000, (approximately 20                   the Yellowstone area.
• Provides a variety of travel         people per square mile of private land), the
  options for safer streets and        region has a small but rapidly expanding                From 1970 to 2000, the Yellowstone
  reduced traffic;                     population. Demographers believe that this            region experienced a 62 percent increase
• Creates more choices in home         rapid migration will continue in areas like           in population, while the amount of land
  size and price;                      Yellowstone that are rich in natural amenities,       developed in rural areas grew by 350 percent
                                       and that this growth will far outpace the             (see Figure 1).
• Revives and creates traditional
  neighborhoods that sustain
                                       national average.
                                                                                               A little known but important fact is that
  community bonds.                                                                           ecologically sensitive areas in the Yellowstone
                                       Map 1. The Yellowstone Region
                                                                                                     region, like elk winter range and
                                                                                                     riparian areas along streams, are often
                                                                                                     concentrated on private lands because
                                                                                                     public lands are generally higher in
                                                                                                     elevation with less productive soils.
                                                                                                     Today, most of the private lands are
                                                                                                     still natural areas, but residential
                                                                                                     development is fragmenting the region
                                                                                                     by converting farms and ranches
                                                                                                     into large-lot subdivisions. The
                                                                                                     footprint of residential development
                                                                                                     is increasing much faster than the
                                                                                                     rate of population growth, as large-lot
                                                                                                     rural subdivision continues to be the
                                                                                                     preferred mode of development.

                                                                                                       From 1970 to 2000,
                                                                                                      the Yellowstone region
                                                                                                     experienced a 62 percent
                                                                                                      increase in population,
                                                                                                     while the amount of land
                                                                                                     developed in rural areas
                                                                                                       grew by 350 percent.

                                                                                         2
CONSEQUENCES FOR
                                                                                                       WILDLIFE, FARMS,
   In this study, we identified factors driving        productive agricultural lands and riparian
                                                                                                       AND RANCHES
current development, such as transportation            wildlife habitat. We then created a computer
infrastructure, services, and natural                  simulation model to predict the impact of       Recent growth patterns
amenities. We also identified lands most               various “smart growth” strategies, assuming     have negative consequences
likely to be developed, including highly               different rates of population growth.           for wildlife and working
                                                                                                       agricultural lands. New
                                                                                                       development bordering the
  Specifically, this report addresses the following questions:
                                                                                                       national parks and adjacent
  What drove rural development in the past?                                                            public lands poses a barrier to

  What scenarios of rural growth patterns are likely to occur in the future?                           migrating wildlife. Pronghorn
                                                                                                       antelope, moose, elk, and
  What effect will today’s planning efforts have on the landscapes of the future?                      mule deer that migrate to
                                                                                                       winter ranges on private lands
                                                                                                       are especially vulnerable.
                                                                                                       Occupied grizzly bear
 Drivers of Rural Development                                                                          habitat, songbird hotspots,
                                                                                                       and riparian areas have been
                                                                                                       disproportionately impacted
                                                                                                       by rural development. In
  In this study, we gathered data on rural             by development along their borders; growth
                                                                                                       fact, most habitats are likely
homes from county tax assessor records and             begets more growth once the infrastructure is
                                                                                                       to undergo substantial
used modern statistical methods to identify            in place.
                                                                                                       conversion (between 10% and

                                                       3
the drivers of recent growth patterns. We
found that many factors influence the location                Natural amenities, such as rivers,       40%) to rural development
of growth, including: agricultural suitability,               sweeping vistas, and protected           by 2020.
transportation infrastructure, services, natural              public lands attract growth. Natural
amenities, and nearby existing development.            amenities are strongly related to growth in
                                                       rural housing. The areas experiencing higher
Five major trends in rural development appear:

1
      Rural homes are concentrated near
      water and on highly productive soils.
      This trend reflects early settlement
patterns and transportation routes established
when people needed to be self sufficient
in growing food and accessing water. The
aesthetic and recreational value of rivers and
lakeshores has also driven this pattern; people
want to live near sources of water.

2
       Development of remote home sites
       encourages conversion of nearby
       natural areas. This occurs because
new homes built in remote locations lead
to the construction of roads, schools, and
utility lines, all of which encourage growth.
Isolated subdivisions are soon accompanied

                                                   3
CONSEQUENCES
FOR LOCAL                                  levels of rural home construction tend to be                          roads induce additional traffic by encouraging
GOVERNMENT
                                           in warmer and wetter regions, and have more                           new development along them. This new
BUDGETS AND
                                           direct access to national parks and forested                          development in turn creates an even greater
TAXES:
                                           areas. Recent increases in retiree and vacation                       demand for new roads.
Rural residential development              homes have intensified this pattern.
                                                                                                                    The current pattern of rural development

                                           4
increases demands for new
                                                  High amenity towns are more likely                             reflects all of the factors we have mentioned,
schools, fire stations, roads,
                                                  to attract nearby rural development.                           as well as the “legacy” of previous growth
sewer, and utility lines. Often                   Not all towns are likely to attract rural                      patterns. The Gallatin Valley in Montana
costing more in services than              residential development. We found that                                is an excellent example. The rural areas
is generated in property taxes,            towns near national park entrances were                               surrounding Bozeman were developed
rural residential development              more likely to experience home construction                           within the rich agricultural lands of the
can be a net drain on local                in nearby rural lands, as were towns                                  Gallatin Valley. The railroad and improved
                                           characterized by a highly educated population                         highways encouraged further development,
government budgets. In the
                                           and a large proportion of employment in                               and resulting population growth led to
Yellowstone region, most new
                                           the professional services, like engineering,                          the construction of an airport, increasing
rural growth is low density,               accounting, real estate, finance, and                                 a key form of accessibility for new rural
dispersed development that                 architecture. Such towns include Rexburg,                             homeowners. Growth in tourism led to the
costs more for services like               Driggs, and Victor in Idaho; Bozeman, Ennis,                          expansion of the airport. Easier access to
fire and police than compact               and West Yellowstone in Montana; and                                  larger population centers via air travel in turn
development located near                   Pinedale and Jackson in Wyoming.                                      made it possible for high-tech businesses

                                           5
                                                                                                                 and higher wage professional services, such
existing communities, services,                   The strongest driver of growth                                 as finance, engineering, architecture, and
and infrastructure.                               is the location of transportation                              management consulting to locate in the area.
                                                  infrastructure and services. The most                          Owners of many of these businesses migrated
                                           influential drivers of rural home construction                        to the Gallatin Valley because of its abundant
                                           are transportation infrastructure and service                         natural amenities, including hiking, fishing,
                                           related factors, including road density, travel                       and scenic mountains, and its connection to
                                           time from airports, and travel time from                              larger markets via the airport. Growth has
                                           hospitals. These factors play a complex role                          become a self-perpetuating force as businesses
                                           in promoting growth. For example, rural                               move in to capitalize on the needs of residents
                                           home construction increases the demand for                            or cater to clients outside the immediate area
                                           new roadways and expanded capacity along                              by utilizing the transportation infrastructure,
                                           existing roads. These new and improved                                internet, and other technologies.

                                                           Simulation Assumptions
                      Rate of Rural Home
   Scenario              Construction
                                               Smart Growth Factors                                                  Driving Factors

    Status                                      Existing zoning and
                       Same as 1990s                                                                     Factors that drove growth in 1990s
     Quo                                      conservation easements

   Low                Lower probability         Existing zoning and                                      Factors that drove growth in 1990s
  Growth                    limit             conservation easements

                      Upper probability         Existing zoning and                  Factors that drove growth in 1990s, plus information provided by
    Boom                    limit             conservation easements                Yellowstone planners on future gains in transportation and housing

   Smart                                      Hypothetical zoning and
                       Same as 1990s                                                                     Factors that drove growth in 1990s
  growth                                      conservation easements

                                           Table 1. The future growth scenarios used different assumptions of growth rates, limiting, and driving factors.
                                                                                                          4
Future Development Scenarios
                                                                                                                                     INSIDE THE SMART
   After identifying the drivers of growth,                             From the alternative future scenarios, we                    GROWTH SCENARIO
we created a simulation of future rural                              learned that:                                                   In the smart growth scenario,

                                                                     1
development using computer mapping                                                                                                   growth occurs at the same
software. This simulation is based on 1990s                                  Under all of the scenarios, rural areas
                                                                             will face major land use changes by                     rate as in the status quo
growth rates and the expert opinions of
                                                                             the year 2020.                                          scenario. The difference is
regional land use planners and zoning
administrators, who provided information                                                                                             in the location of forecasted
                                                                       In all scenarios, forecasted homes were
regarding future changes that might spur                                                                                             homes. In the smart growth
                                                                     concentrated near towns and public lands
growth, including the construction of roads,                         mainly in the northern and western portions                     scenario, we incorporated
airport expansions, and the building of                              of the study area (see Map 2). Development                      hypothetical smart growth
new subdivisions. In all, we created four                            was forecasted to occur most densely in the                     policies, such as conservation
alternative scenarios for the year 2020: a                           Gallatin Valley, the area surrounding Idaho                     easements, incentives, and
status quo scenario; a low growth scenario; a                        Falls, the Island Park area, Jackson Hole,                      zoning that would guide
boom scenario; and a smart growth scenario                           southern Teton Valley, the Rexburg area,
(see Table 1).                                                                                                                       growth toward existing towns.
                                                                     northern Star Valley, northern Paradise
                                                                                                                                     These policies were used to
                                                                                                                                     guide development away from
                                                                                                                                     one quarter of the Yellowstone
                                                                                                                                     region’s most valuable natural
                                                                                                                                     areas, farms, and ranches.

                                                                                                                                     To determine which natural
                                                                                                                                     areas, farms, and ranches
                                                                                                                                     should be conserved, we
                                                                                                                                     graded lands on four
                                                                                                                                     measures: irreplaceability,
                                                                                                                                     connectivity to other habitats,
                                                                                                                                     biodiversity, and riparian
                                                                                                                                     habitat. In the smart growth
                                                                                                                                     scenario, 8% of private lands
                                                                                                                                     (1 million acres) were
                                                                                                                                     put into conservation
                                                                                                                                     easements, 25% (3 million
                                                                                                                                     acres) were zoned for
                                                                                                                                     agricultural use, and
                                                                                                                                     incentives were used to guide
                                                                                                                                     growth toward
                                                                                                                                     existing towns.

Map 2. Red highlight areas that were forecasted to experience high growth in all four future scenarios in the Greater Yellowstone.
                                                               5
SIMULATING
FUTURE                            Valley, and the area surrounding Cody,                              patterns of forecasted growth. For example,
DEVELOPMENT
                                  Wyoming.                                                            in 16 of the 20 counties, existing zoning
A statistical technique                                                                               districts affected fewer than 10 percent of
                                    The scenarios differed in the amount of                           forecasted homes. In rare cases, such as Clark
known as generalized linear
                                  growth projected and the location of future                         County, Idaho, restrictive zoning districts
modeling was used to identify     homes. The increase in rural homes ranged                           had only minor impacts because growth was
the combination of factors        from 28 percent in the low growth scenario,                         forecasted to occur slowly and not exceed
that best described growth        to 82 percent in the status quo scenario,                           the zoning regulations. However, in most
in rural housing during the       to 234 percent in the boom scenario (see                            counties, zoning was ineffective because it
1990s. The resulting equation     Figure 2).                                                          put few limits on high growth areas. For
was used to forecast rural          In the status quo scenario, 15 percent of                         example, the rapid rural growth forecasted in
housing densities per square      agricultural lands and 8 percent of natural                         Lincoln County, Wyoming never exceeded
mile of private land for 2010     areas were developed by 2020 (see Table                             the current zoning regulations. This is
                                  2). Farms and ranches are more vulnerable                           because the rural zoning within Lincoln
and 2020. The simulation
                                  because they are accessible by roads, whereas                       County is exceptionally permissive, allowing
was designed so that both
                                  isolated natural areas are more likely to                           for housing densities of 320 to 1280 homes
growth-inducing and growth-                                                                           per square mile.
                                  remain undeveloped until a road is built. In

                                                                                                      3
management factors could
                                  the boom scenario, 36 percent of agricultural                              Without growth management
be manipulated in order to        lands and 24 percent of natural areas were                                 coordination between cities and
generate maps of alternative      developed by 2020.                                                         counties at a regional scale, the
future scenarios. For example,                                                                        patchwork of local policies will merely
                                    At the rate of development forecasted in
growth-inducing factors, such                                                                         shift unplanned growth from one place to
                                  the boom scenario, all natural areas on private
as future road additions,         lands in the region would be converted to                           the next.
were drawn on maps by             development within roughly 40 years. In
Yellowstone area planners,        comparison, the policies in the smart growth
and incorporated into the         scenario protect 99 percent of agricultural
boom scenario. Smart growth       areas and 97 percent of natural areas without
                                  restricting the amount of development.
factors, such as incentives to

                                  2
cluster growth near towns,                The majority of current land use
were incorporated into the                policies will be largely ineffective at
smart growth scenario.                    limiting unplanned, costly growth.
Such modifications affected         While counties are working toward good
forecasted housing densities,     land use plans, we found that existing land                      Figure 2. The total number of forecasted rural homes per
and were used to generate         use policies had little or no effect on the                      future scenario.
the four alternative scenarios.
Technical reports available at                              Forecasted Land Use Change
www.sonoran.org contain full
                                             In the Private Lands of the Yellowstone Area (2000 - 2020)
documentation on how the                                                           Loss of                                        Loss of
                                            Scenario
                                                                             Agricultural Lands                                Natural Areas
simulation works.
                                          Low Growth                                      5%                                            5%
                                          Status Quo                                     15%                                           8%
                                            Boom                                         36%                                           24%
                                        Smart growth                                      1%                                            3%
                                  Table 2. The percent of private agricultural and natural lands converted to rural residential development is compared between
                                  the four alternative future scenarios.
                                                                                               6
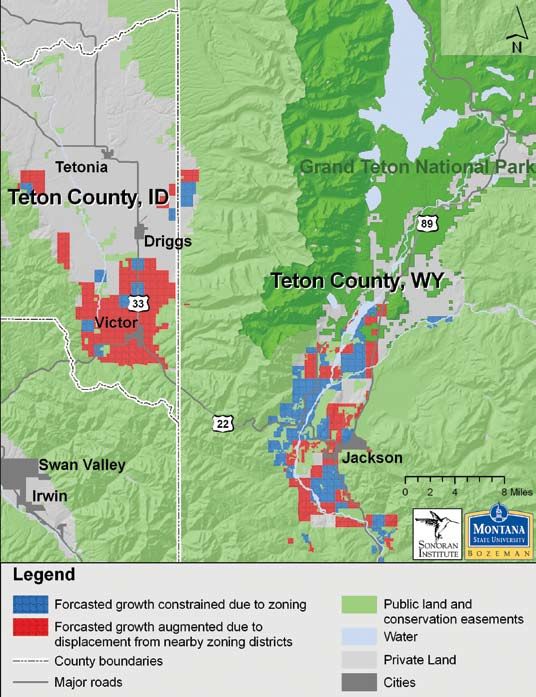
We learned that a patchwork of local land
use policies leads to unintended growth                At the rate of development
patterns. Teton County, Wyoming and Teton
County, Idaho are clear examples of how land             forecasted in the boom
use policies in one county can have major              scenario, all natural areas
effects on growth patterns in neighboring
counties. Aggressive growth management
                                                         on private lands in the
efforts in the Jackson Hole area resulted in a        region would be converted to
forecasted “spill-over” of rural homes into the            development within
southern portion of Idaho’s Teton Valley (see
Map 3). To avoid this situation, there must
                                                            roughly 40 years.
be regional cooperation among counties in
developing smart growth plans.

4
      There is no silver
      bullet. A combination
      of land use policies
and incentives is needed to
successfully balance future
growth, fiscal well-being, and
environmental quality.

  We used the smart growth
scenario to evaluate land use
policies. The goal was to identify
policies that could preserve
one quarter of the ecologically
sensitive private lands in the
Yellowstone region as natural
areas, farms, and ranches. This
was achieved without limiting
future growth in housing
by providing incentives that
guided growth toward existing
towns, and strategically locating
conservation easements and
zoning districts. As a result
of these hypothetical policies,
losses of natural areas and
working agricultural lands were
minimized in the smart growth
scenario (see Table 2).

Map 3. The impacts of growth management
can extend into neighboring counties, as
shown by the “spill-over” from Jackson Hole
into Idaho’s Southern Teton Valley.
                                                  7
Conclusions
More information on the
study summarized in this Key Findings Key Recommendations
report will soon be available
Future migration and development may We also identified necessary steps in
in the following peer-reviewed
forever change western lands. The questions planning for growth. We learned that
journal articles:
to be asked are: What sort of growth will we well-planned local policies can preserve
have? Where will it occur? The answers will agricultural lands, wildlife, air and water
Gude, P.H., Hansen, A.J., greatly impact the landscapes, communities, quality, and the stability of local economies
Rasker, R., Maxwell, B. In and local economies in the West. without limiting growth.
Press. Rates and drivers of
Through our case study of the Yellowstone The following three tactics will be critical:
rural residential development
1
region, we learned that:
in the Greater Yellowstone. A combination of land use policies,
1
Landscape and Urban Sprawling development, especially including conservation easements,
“leap frog” subdivisions constructed regulations, and incentives
Planning.
away from existing development, are needed to successfully balance
encourages further development of nearby future growth, fiscal well-being, and
Hansen, A.J., Knight, natural areas. This occurs because the environmental quality.
R.L., Marzluff, J., Powell,
2
infrastructure and services that accompany
S., Brown, K., Gude, P.H., “leap frog” subdivisions facilitate further Beyond writing good land use plans
development of nearby land. and ordinances, the region needs to
Jones, K.L. In Press. Effects
adopt policies to implement its best
2
of exurban development Existing land use policies in most of laid plans and enforce its regulations.
on biodiversity: patterns,
3
the region are largely ineffective at
mechanisms, research needs. limiting unplanned growth. While For smart growth policies to
some counties have made progress in drafting be truly effective, regional
Ecological Applications.
good management plans, less success has been coordination among cities and
enjoyed in the actual implementation of these counties is imperative.
Gude, P.H., Hansen, A.J.,
plans and policies. There is a high potential for undirected
Rasker, R., Maxwell, B.
3
In Review. Biodiversity Policies in one county have major growth in many areas of the West because
spillover impacts on growth patterns of rapid migration rates and unrestricted
consequences of alternative
in neighboring counties. Good land land use policies. However, effective growth
future land use scenarios management can be accomplished with
use standards and implementation in one local
in Greater Yellowstone. regional collaboration, provision of incentives
area are by themselves insufficient to prevent
Ecological Applications.
and in some cases encourage unwanted to encourage future growth near towns, and
development patterns in adjacent areas. more extensive and strategic use of zoning
and conservation easements.
8We can take action now to reduce
unplanned growth in the long run.
Rather than be victims of change, we
can plan for it, shape it, and emerge
as a region known for its vibrant
communities, prosperous economies
and open spaces. With effective
planning, this can be our legacy for
the Yellowstone region.
Acknowledgments
We are extremely grateful to the Earth David Theobald reviewed and greatly
Friends Foundation, the Northern improved scientific manuscripts resulting
Environmental Support Trust, the Charlotte from this study, and Dr. Mark Taper and
Martin Foundation, and the V. Kann Kingsford Jones gave invaluable statistical
Rasmussen Foundation, whose generous advice. We thank Dr. Reed Noss for making
financial support made this report possible. biological data available through the Greater
Yellowstone Coalition, and American
The Montana and Wyoming Departments Wildlands and Dr. Lance Craighead for
of Revenue, and the tax assessor offices in providing habitat connectivity data through
Clark, Fremont, Madison, Teton, Bonneville, the Corridors of Life project.
Caribou, Franklin, and Bear Lake Counties
in Idaho provided the rural homes data. We Financial support for the research was
thank Danielle Jones, Patrick Hutchinson, provided by the U.S. Environmental
and Erin Hermanson, who helped compile Protection Agency Futures Research in
the data summarized in this report. Dr. Socio-Economics grant program.
Robert Garrot, Dr. Dan Brown and Dr.
9A nonprofit organization The Landscape Biodiversity
established in 1990, the Lab studies how people use the
Sonoran Institute brings land and how, in turn, people
diverse people together influence wildlife and ecosystems.
to accomplish shared Plants and animals are spread
conservation goals. across landscapes based on
The Sonoran natural factors like climate, food
Institute works with communities to conserve and restore availability, and habitat type. The use of land by people is
important natural landscapes in Western North America, a product both of human factors like economics, but also
including the wildlife and cultural values of these lands. The ecological factors like climate. Consequently, the locations of
lasting benefits of the Sonoran Institute’s work are healthy farms, rural homes, and cities sometimes occur in the places
landscapes and vibrant, livable communities that embrace most important to native wildlife.
conservation as an integral element of their quality of life and The Landscape Biodiversity Lab studies how natural factors
economic vitality. and human land use influence the distribution of species
Through our approach, the Sonoran Institute contributes to and changes in their population sizes. The Lab’s research is
a day when: aimed at understanding these complex interactions to help
Healthy landscapes, including native plants and wildlife, land managers and citizens make informed decisions about
diverse habitat, open spaces, clear air and water, extend from natural resource issues.
northern Mexico to Western Canada; The Lab’s studies make use of a unique combination of
People embrace stewardship as a fundamental value by caring approaches in this work, including field studies, satellite
for their communities, economies and natural landscapes; data analysis, statistics, and spatial modeling. Together,
these approaches help us address questions across large
Resilient economies support strong communities, diverse complex landscapes.
opportunities for residents, productive working landscapes,
and stewardship of the natural world. The Landscape Biodiversity Lab’s findings from the
Yellowstone region have lead to studies across the Pacific and
Sonoran Institute Inland Northwest, the Yellowstone to Yukon region, Mexico,
www.sonoran.org
China, Kenya, and several other countries around the world.
7650 E. Broadway Blvd., Suite 203, Tucson, AZ 85710
These studies are helping decision makers and natural
Phone: (520) 290-0828
resource managers implement science-based policies and
201 S. Wallace Ave., Suite B3C, Bozeman, MT 59715 management strategies
Phone: (406) 587-7331
Landscape Biodiversity Lab
4835 Cactus Road Suite 270, Scottsdale, AZ 85254 www.homepage.montana.edu~hansen/
Phone: (602) 393-4310 Montana State University
Department of Ecology
310 Lewis Hall
Bozeman, MT 59171
Phone: (406) 994-4548You can also read