Citizen Scientists Help Detect and Classify Dynamically Triggered Seismic Activity in Alaska - Frontiers
←
→
Page content transcription
If your browser does not render page correctly, please read the page content below
ORIGINAL RESEARCH
                                                                                                                                               published: 06 August 2020
                                                                                                                                           doi: 10.3389/feart.2020.00321

                                             Citizen Scientists Help Detect and
                                             Classify Dynamically Triggered
                                             Seismic Activity in Alaska
                                             Vivian Tang 1* , Boris Rösler 1 , Jordan Nelson 2 , JaCoya Thompson 1,3 ,
                                             Suzan van der Lee 1,4,5 , Kevin Chao 1,4 and Michelle Paulsen 5
                                             1
                                              Department of Earth and Planetary Sciences, Northwestern University, Evanston, IL, United States, 2 Department
                                             of Chemistry, Northwestern University, Evanston, IL, United States, 3 Department of Computer Sciences, Northwestern
                                             University, Evanston, IL, United States, 4 Northwestern Institute on Complex Systems, Northwestern University, Evanston, IL,
                                             United States, 5 Center for Interdisciplinary Exploration and Research in Astrophysics, Northwestern University, Evanston, IL,
                                             United States

                                             In this citizen science project, we ask citizens to listen to relevant sections of
                                             seismograms that are converted to audible frequencies. Citizen scientists helped
                                             identify local seismic events whose recorded signals are much smaller than those
                                             associated with the surface waves that have triggered these local events. The local
                         Edited by:
                Kate Huihsuan Chen,          events include small earthquakes as well as tectonic tremor. While progress has been
   National Taiwan Normal University,        made in understanding how these events might be triggered by surface waves from
                             Taiwan
                                             large teleseismic earthquakes around the world, there is no consensus on its physical
                       Reviewed by:
                       Chi-Chia Tang,        mechanism. The aim of our project is to engage the help of citizen scientists to
     China University of Geosciences,        increase general knowledge of triggered seismic events that may or may not occur
                                China
                                             during transient strain changes, such as from propagating surface waves. A better
                   Wen-Tzong Liang,
            Academia Sinica, Taiwan          understanding of triggered seismic events is expected to provide important clues
                  *Correspondence:           toward a fundamental understanding of how earthquakes nucleate and the physical
                          Vivian Tang        mechanisms that connect different earthquakes and other slip events. From the
       vivian@earth.northwestern.edu;
 viviantang2015@u.northwestern.edu           volunteers’ classifications we determined that citizen scientists achieve a higher reliability
                                             in detecting earthquakes and noise than in detecting tremor or other signals and that
                   Specialty section:        citizen scientists more accurately identify earthquake signals than a trained machine-
         This article was submitted to
              Solid Earth Geophysics,        learning algorithm. For tremor classifications we currently depend entirely on humans as
               a section of the journal      no machine has yet learned to detect triggered tremor.
            Frontiers in Earth Science
                                             Keywords: earthquake detective, citizen sciences, triggered seismic events, machine-learning algorithm, audible
        Received: 12 February 2020
                                             pitches, Alaska
           Accepted: 09 July 2020
         Published: 06 August 2020
                             Citation:       INTRODUCTION
           Tang V, Rösler B, Nelson J,
 Thompson J, van der Lee S, Chao K
                                             Surface waves generally have the longest duration and largest displacement of all seismic waves.
         and Paulsen M (2020) Citizen
                                             When they pass through a seismically active region, surface waves from distant earthquakes
  Scientists Help Detect and Classify
Dynamically Triggered Seismic Activity       may locally trigger an earthquake or tremor (Miyazawa and Mori, 2005; Gomberg et al.,
    in Alaska. Front. Earth Sci. 8:321.      2008; Rubinstein et al., 2009; Chao et al., 2012; Ide, 2012). Determining the frequency and
       doi: 10.3389/feart.2020.00321         conditions under which triggered seismic events occur will lead to a better understanding of

Frontiers in Earth Science | www.frontiersin.org                                     1                                                August 2020 | Volume 8 | Article 321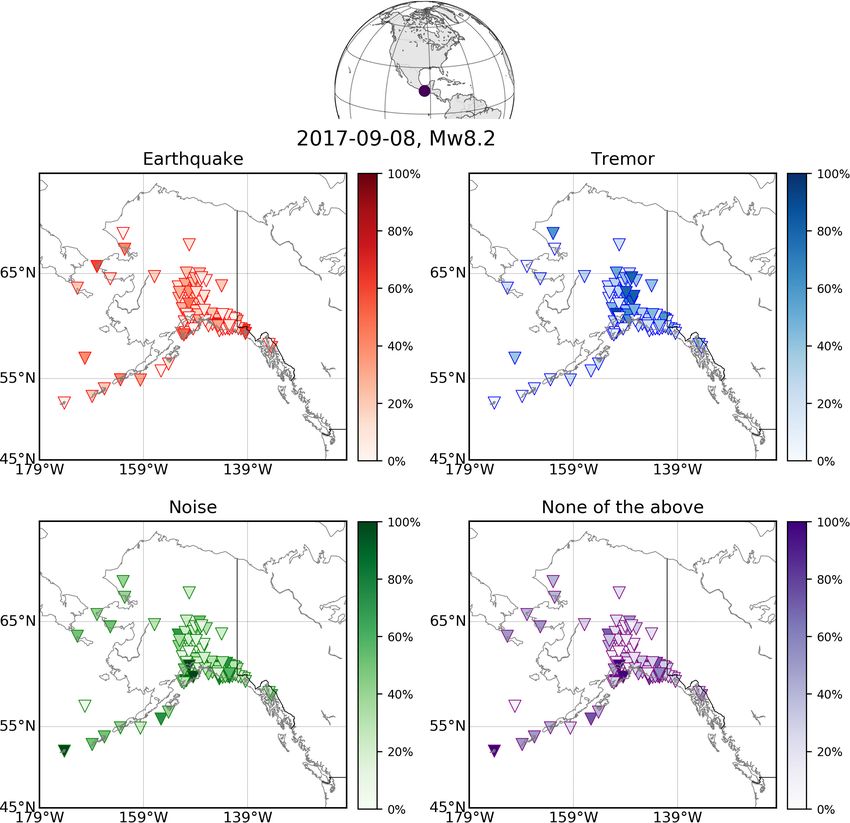
Tang et al.                                                                                                                               Earthquake Detective

the dynamic triggering of earthquakes (Peng and Gomberg, 2010;                    researchers’ analysis of this data (Kilb et al., 2012), and (3) part
Brodsky and van der Elst, 2014). Seismometers continuously                        of the citizen scientists’ responses can be compared to the results
record ground motion at stations around the world, including                      of a machine-learning algorithm to assess their performance.
seismic waves of small events which may be detected at one or                         Different seismic events can be classified by citizen
at multiple instrument locations. Due to the large number of                      scientists when listening to the audio data alongside the
seismometers, the available seismograms are too numerous to be                    visual graphs. When sufficient data is classified, seismologists
examined by seismologists (Liang et al., 2016). With Earthquake                   and data scientists can use it to train a machine-learning
Detective, we utilize the Zooniverse platform to engage citizen                   algorithm (an example of artificial intelligence) to automate
scientists in an experiment to test if many human ears and                        the classification of seismograms (Xing et al., 2003; Perol
eyes can replace the process of a professional seismologist in                    et al., 2018; Tang et al., 2020). From there, seismic models
identifying dynamically triggered seismic events. We focus on                     for how, where, when, and why earthquakes happen may be
data from seismic stations in Alaska, including USArray stations                  refined by seismologists. The work citizen scientists put into
of EarthScope. Our approach has three advantages: (1) The                         this project contributes to the fundamental understanding
human ear naturally performs a time-frequency analysis and is                     of our planet that will allow a more sustainable society
capable of discerning a wide range of different signals (Zwicker,                 by allowing professionals to better assess hazards from
1961), (2) many human ears listening to the same data provides                    future seismic events. An electronic supplement provides
statistics that rank seismograms in order of their likelihood                     details on interface diagrams of the project and portions
to contain a recording of a local event, which is helpful to                      of data utilized.

  FIGURE 1 | Data processing. (A) Raw seismogram from MPM station following the February 27, 2010 Chile earthquake with Mw 8.8. (B) Seismogram converted to
  velocity by removing the instrument response. (C) Seismogram after applying a filter from 2 to 8 Hz. (D) Seismogram is cut for the surface-wave interval.
  (E) Generating audio files by speeding up the time series and scaling the amplification.

Frontiers in Earth Science | www.frontiersin.org                              2                                            August 2020 | Volume 8 | Article 321
Tang et al.                                                                                                                             Earthquake Detective

MATERIALS AND METHODS                                                                 filtered between 2 and 8 Hz (Figure 1C) to remove Rayleigh
                                                                                      waves from the radial and vertical components and Love
Far-field surface waves of large magnitude earthquakes                                waves from the transverse component. After determining the
can dynamically trigger seismic events such as small, local                           beginning of the surface-wave window for each station based
earthquakes (Prejean et al., 2004) and tectonic tremor (Peng                          on its distance from the epicenter and using a group velocity
and Gomberg, 2010). Here, we address results from the citizen                         of 4.5 km/s, we selected the first 2000 s of the time series
scientists’ classifications of data from USArray (TA) and the                         after this start time (Figure 1D). We generated audio files by
Alaska Regional Network (AK), which were recorded in the                              speeding up the time series by a factor of 800 and applying
US from 2013 to 2018 (see section “Acknowledgments and                                an arctangent function to the amplitudes for dynamic-range
Data” for details). The seismic waveforms presented to citizen                        compression (Figure 1E). This provides improved audibility
scientists are downloaded from the IRIS (Incorporated Research                        for signals with smaller amplitude while preventing events with
Institutions for Seismology) Data Management System (DMS)                             larger amplitude signals from excessive loudness. Waveforms
(see section “Acknowledgments and Data”). The downloaded                              with either gaps in the time series, calibrations or re-centering
waveforms (Figure 1A) have a start time of 60 minutes before                          signals, or other glitches were discarded before presenting
and an end time of 180 minutes after the origin times of                              the data to citizen scientists on the largest people-powered
selected large earthquakes with moment magnitude (Mw )                                research platform, “Zooniverse” (Supplementary Figures S1–
greater than 7.5 (Table 1; Aiken and Peng, 2014; Chao and                             S3). With this platform, we were able to provide tutorial
Obara, 2016). Waveforms were converted to ground velocity                             and practice sessions for training our citizen scientists to
by deconvolving the instrument response from the recorded                             identify “earthquakes,” “tremor,” and “noise” signals. Citizen
waveforms, and rotated to radial, transverse and vertical                             scientists are asked to choose “none of the above” when the
components (Figure 1B). The waveforms are then band-pass                              seismic signals do not clearly fall in one of the other categories
                                                                                      or more than one different signal is present in the data
                                                                                      (Supplementary Figures S4, S5).
TABLE 1 | Teleseismic earthquakes used in this study.
                                                                                          Seismic waves that are caused by the displacement of tectonic
                                                                                      plates along a fault are known as earthquake signals. They are
No.           Date             Longitude       Latitude      Depth    Magnitude       caused by the sudden release of seismic energy, making them
                                  (◦ )            (◦ )        (km)      (Mw )         short in duration and resembling the sound of a slamming
1.    2013-02-06T01:12:26       165.114        −10.799        24.0       8.0          door. Tremors have a longer duration and are generated by
2.    2013-04-16T10:44:19        61.996            28.033     80.0       7.7          a slow release of acoustic and seismic energy. Sped up to
3.    2013-11-17T09:04:56       −46.4011       −60.2738       10.0       7.7          audible frequencies, tremor can sound like a train darting over
4.    2014-04-01T23:46:47       −70.7691       −19.6097       25.0       8.2          railroad tracks.
5.    2014-04-03T02:43:14       −70.4931       −20.5709       22.4       7.7              The Earth is in constant motion under the influence of
6.    2014-04-12T20:14:38       162.1481       −11.2701       22.56      7.6          forces from atmosphere, hydrosphere (e.g., ocean currents
7.    2014-04-19T13:28:00       155.0241           −6.7547    43.37      7.5          and waves), and biosphere, including anthropogenic
8.    2014-06-23T20:53:09       178.7352           51.8486   109.0       7.9          activity, generated by traffic or industry, for example.
9.    2015-03-29T23:48:31       152.5623           −4.7294    41.0       7.5          Therefore, every seismogram contains relatively steady
10. 2015-04-25T06:11:26          84.7314           28.2305     8.22      7.8          noise, even in the absence of seismic signals or distinct
11. 2015-05-05T01:44:04         151.8751           −5.4624    55.0       7.5          noise events, which converts to a slowly varying, white
12. 2015-05-30T11:23:02         140.4931           27.8386   664.0       7.8          noise “baseline” for the sound file. These noise signals
13. 2015-09-16T22:54:32         −71.6744       −31.5729       22.44      8.3          sound like whistling wind, crinkling aluminum foil, or
14. 2015-10-26T09:09:42          70.3676           36.5244   231.0       7.5          radio static.
15. 2016-03-02T12:49:48          94.3299           −4.9521    24.0       7.8              Earthquakes and tremors as well as natural and anthropogenic
16. 2016-04-16T23:58:36         −79.9218            0.3819    20.59      7.8          sources generate seismic signals that may or may not exceed the
17. 2016-07-29T21:18:26         145.5073           18.5429   196.0       7.7          baseline noise level of a seismogram. These different sources can
18. 2016-11-13T11:02:59         173.054        −42.7373       15.11      7.8          be distinguished by the sound of their signals.
19. 2016-12-08T17:38:46         161.3273       −10.6812       40.0       7.8
20. 2016-12-17T10:51:10         153.5216           −4.5049    94.54      7.9
21. 2016-12-25T14:22:27         −73.9413       −43.4064       38.0       7.6          RESULTS
22. 2017-01-22T04:30:22         155.1718           −6.2464   135.0       7.9
23. 2017-01-22T04:30:22         155.1718           −6.2464   135.0       7.9          Of 2467 seismograms recorded by the AK network, 1103
24. 2017-07-17T23:34:13         168.857            54.4434    10.0       7.7          seismograms were classified as earthquakes by citizen scientists,
25. 2017-09-08T04:49:20         −93.8993           15.0222    47.39      8.2          141 as tremor, 770 as noise, and 228 were labeled as to
26. 2018-01-10T02:51:31         −83.52             17.4825    19.0       7.5          pertaining to none of these categories. The distribution of
27. 2018-08-19T00:19:40 −178.153               −18.1125      600.0       8.2          classifications in the four categories (Figure 2) indicates
28. 2018-09-06T15:49:14         179.3502       −18.4743      670.81      7.9          that earthquakes (74% of all classifications on seismograms
29. 2018-09-28T10:02:43         119.8462           −0.2559    20.0       7.5          identified as earthquakes are made for this category)
30. 2018-12-05T04:18:08         169.4266       −21.9496       10.0       7.5          and noise (66%) were identified with more certainty by

Frontiers in Earth Science | www.frontiersin.org                                  3                                       August 2020 | Volume 8 | Article 321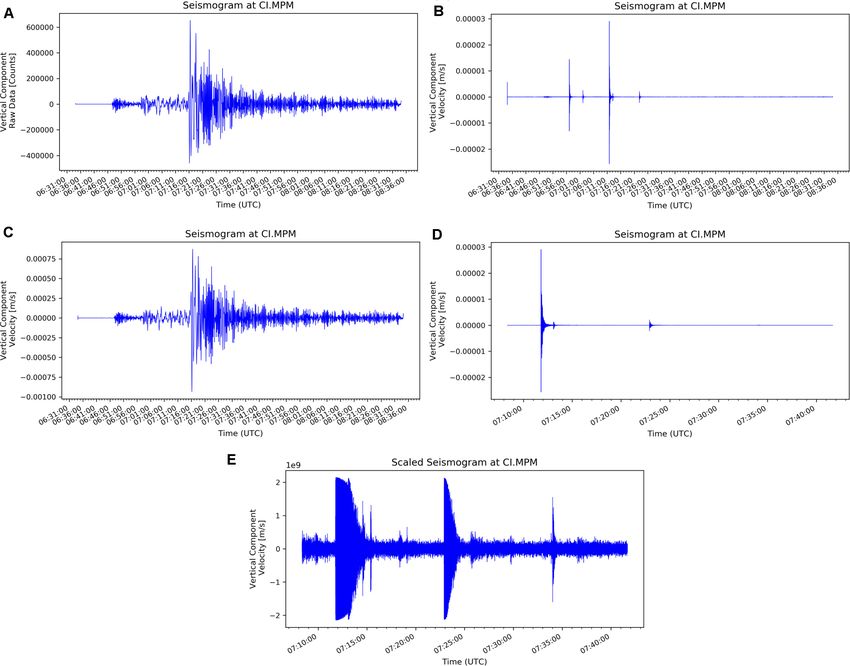
Tang et al.                                                                                                                                     Earthquake Detective

  FIGURE 2 | Histograms for each classified category. The four categories contain seismograms which have received a majority classification for one category and
  show the average of the classifications made for the seismograms contained in this category.

citizen scientists than tremor (50%) and other, unclear                               with our expert labels as well. Assuming that the expert
events (51%). Hence, citizen scientists were able to classify                         labels are “true,” citizen scientists’ labels were 85% accurate in
earthquakes and noise more consistently than tremor                                   classifying earthquakes and did not mislabel any seismogram
and other events.                                                                     without earthquakes though 23% of all earthquakes remained
    For one Mw 7.5 earthquake on December 5, 2018, seismologists                      undetected by citizen scientists (Figure 3). Figure 4 shows
independently classified the seismograms for which 7 of                               results from ML as projections into two-dimensional spaces via
10 citizen scientists agreed, in order to assess the accuracy                         the PCA (Principal Component Analysis) of 10-dimensional
of the project volunteers. For comparison, we applied a                               embeddings. PCA is a non-parametric statistical technique
machine-learning (ML) algorithm, trained to detect earthquake                         (George and Vidyapeetham, 2012) used for dimensionality
signals only (Tang et al., 2020), and compared its output                             reduction in machine learning and the principal components

Frontiers in Earth Science | www.frontiersin.org                                  4                                              August 2020 | Volume 8 | Article 321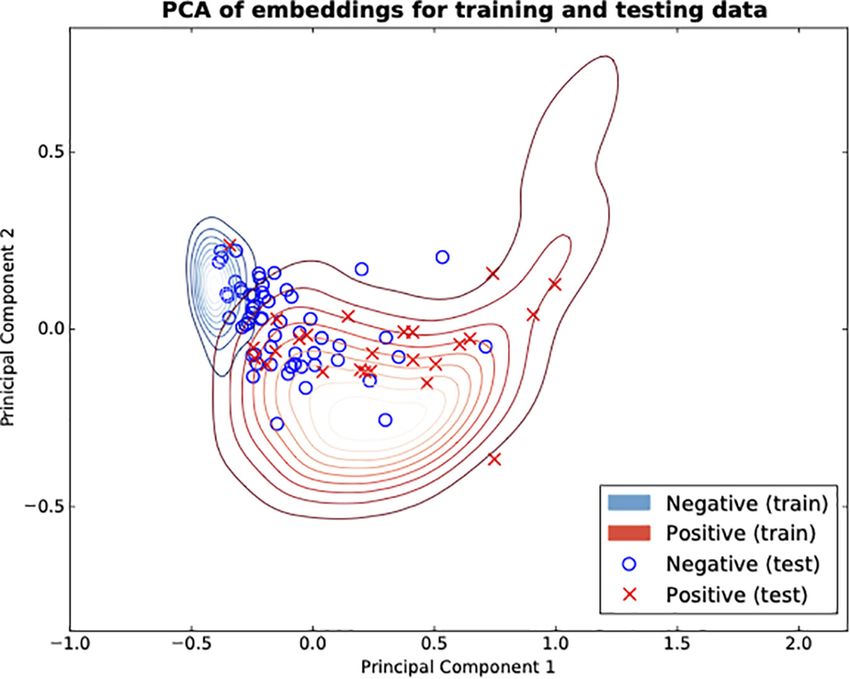
Tang et al.                                                                                                                                      Earthquake Detective

  FIGURE 3 | Confusion matrices for citizen scientists’ and the
  machine-learning algorithm’s classifications.

are the coefficients of orthogonal linear combinations of the
variables in the dataset. Contours indicate the distributions
of the training dataset and the symbols represent the
testing dataset. The machine-learning algorithm achieved
only 76.2% accuracy in classifying earthquakes in the same
dataset, a score nearly 10% lower than citizen scientists                             FIGURE 5 | Histograms for classifications made on seismograms without
(Figure 4).                                                                           conclusive label. The seismograms contained in this category have received
                                                                                      the same amount of classifications for at least two different categories with
                                                                                      less classifications for the other categories.

DISCUSSION
Seismograms are retired after having been classified by 10                           of classifications made for one category is not reached for
different users on Zooniverse. Of 2467 seismograms, 2242                             any other category as shown by a narrow distribution.
have received a conclusive label, meaning that the number                            There was a larger level of agreement between volunteers

  FIGURE 4 | The convolutional neural network for classifying the training dataset (contour maps) and the test dataset (symbols) from the December 5, 2018 Mw 7.5
  teleseimic earthquake. Shown in red are seismograms with an earthquake, seismograms without earthquakes are shown in blue.

Frontiers in Earth Science | www.frontiersin.org                                 5                                                August 2020 | Volume 8 | Article 321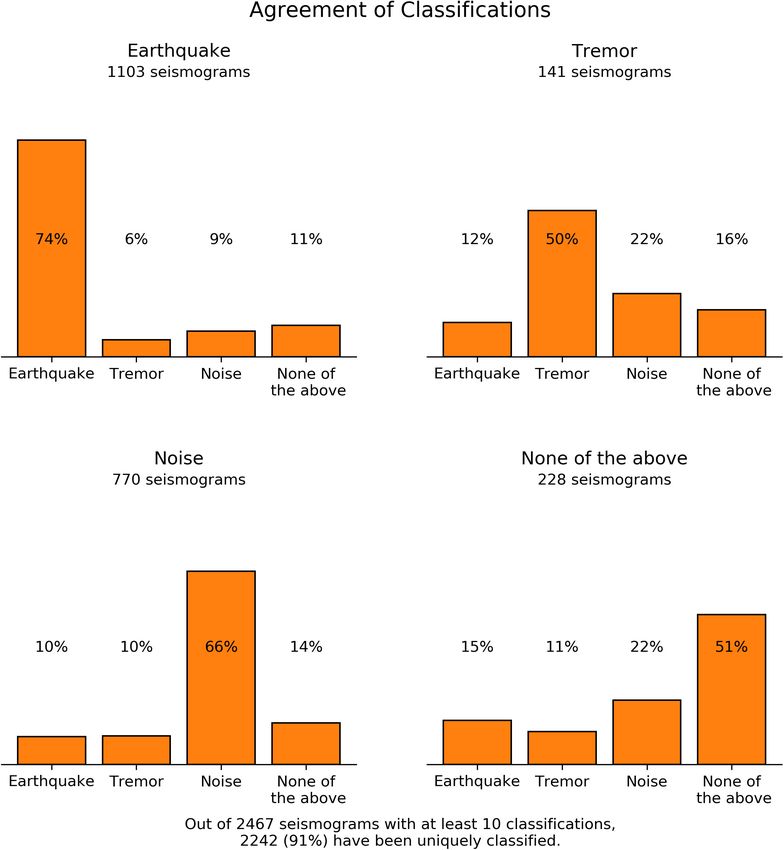
Tang et al.                                                                                                                                    Earthquake Detective

when the seismographs contained either earthquakes or                                  as not pertaining to any of the other categories when
noise (Figure 2). Citizen scientists agree less on which                               the seismograms contain several different signals or have
seismograms contain tremor and other signals as shown                                  unclear waveforms or audio signals. In these situations
by a wider distribution of classifications (Figure 5). We                              the seismograms are often classified as an earthquake or
assume that the degree of agreement of classifications                                 tremor. It is therefore unsurprising that the agreement
between citizen scientists reflects the collective confidence                          of classifications made on seismograms in the category
of citizen scientists in identifying the seismic signals.                              “none of the above” is lower than on seismograms in the
We found that earthquakes and noise have characteristic                                other categories.
waveforms and associated audio signals that make it                                       The 225 seismograms which have not received a conclusive
easy to distinguish them from other seismic signals.                                   label (Figure 5), meaning that the highest amount of
Citizen scientists are directed to classify seismic signals                            classifications has been reached for more than one category,

  FIGURE 6 | Map of stations showing the location of recordings of triggered earthquake for different teleseismic earthquakes.

Frontiers in Earth Science | www.frontiersin.org                                   6                                             August 2020 | Volume 8 | Article 321
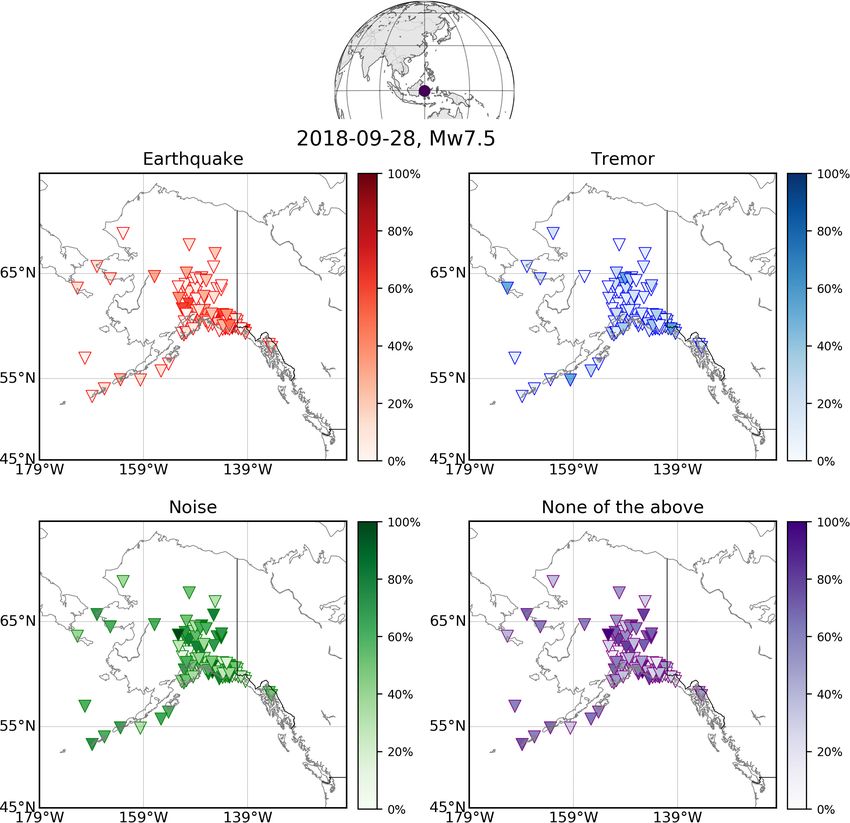
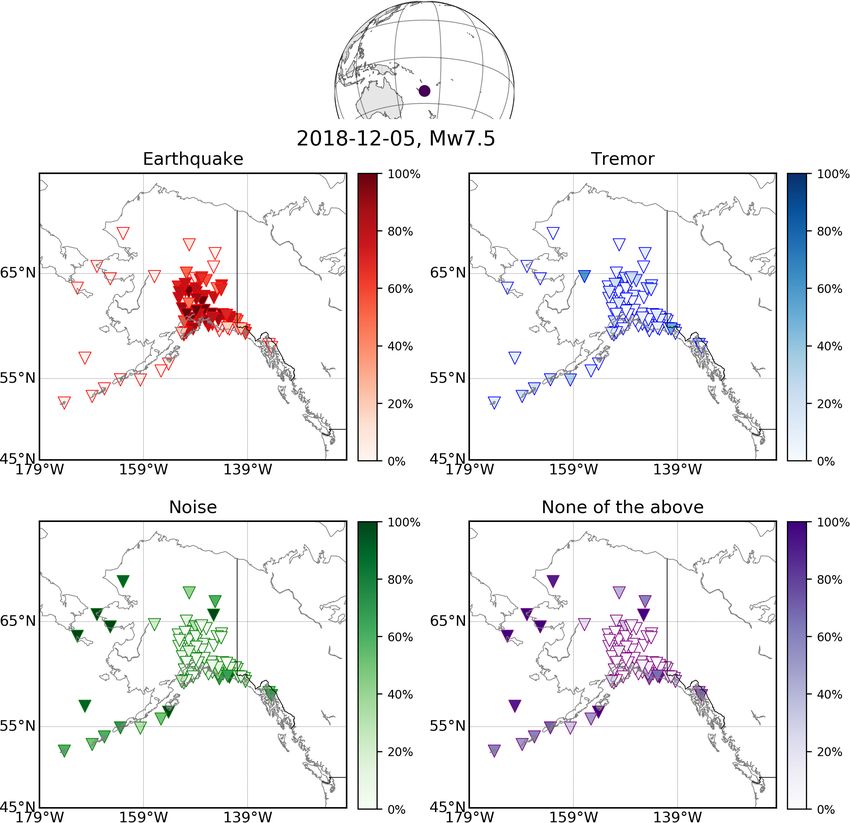
Tang et al.                                                                                                                                 Earthquake Detective

amount to only 9% of all seismograms. Unsurprisingly, the                                 The classifications made by citizen scientists of Zooniverse
distribution of classifications made on these seismograms                              make it possible to locate the stations with additional seismic
shows no clear preference for any of the categories. However,                          signals that occurred during the passage of surface waves
it stands out that classifications for tremor and “none of the                         of teleseismic earthquakes in the AK network (Figures 6–
above” are more numerous than for earthquakes and noise,                               8). Surface waves from the earthquake on December 5, 2018
reflecting that these seismic signals are more difficult to identify                   with Mw 7.5 southeast of the Loyalty Islands triggered local
and confirming the affirmations made for seismograms with                              earthquakes within 300 km north of Anchorage, (Figure 6).
a conclusive label. This may bias citizen scientists (Hart et al.,                     During the passage of surface waves from the September 8, 2017
2009; Swanson et al., 2016) to classify seismograms with                               Mw 8.2 Mexico earthquake, tremor occurred in central Alaska
“none of the above” events as earthquakes, tremor or noise.                            (Figure 7). The signals recorded during the passage of surface
These “none of the above” events reflect that seismograms                              waves from the September 28, 2018 Mw 7.5 Sulawesi earthquake
within the surface wave intervals may contain instrument                               (Figure 8) show a random mix of classifications by citizen
signals, and signals of anthropogenic and natural sources                              scientists, implying that signals are present, but are ambiguous
(Smith and Tape, 2019).                                                                in nature.

  FIGURE 7 | Map of stations showing the locations of recordings of triggered tremor for different teleseismic earthquakes.

Frontiers in Earth Science | www.frontiersin.org                                   7                                          August 2020 | Volume 8 | Article 321
Tang et al.                                                                                                                                       Earthquake Detective

   The focus on this study has been on harnessing the                                  From the above results, both methods can successfully
intelligence of citizen scientists to identify triggered seismic                       identify triggered earthquakes, but citizen scientists can
events. In the subtask of detecting triggered earthquakes,                             detect non-earthquake signals better than the machine-
we compared the results of citizen scientists to an existing                           learning algorithm. Citizen scientists are more successful at
machine-learning algorithm (Tang et al., 2020). The confusion                          identifying non-earthquake signals because we encourage
matrices in Figure 3 show that the machine-learning algorithm                          them to classify seismograms without clear earthquake
misidentified 11 of the expert-labeled non-earthquake signals                          signals as “none of above,” and the same standard used by
as earthquake signals and missed 9 of the expert-labeled                               seismologists to label the data. However, the machine-learning
earthquakes, while correctly labeling 47 earthquake and 17                             algorithm may identify triggered earthquakes hidden by
non-earthquake signals. On the other hand, citizen scientists                          high background noise as positive examples (Figure 9).
correctly identified 43 earthquakes and missed 13 earthquake                           Hence, the algorithm detects 11 more earthquake signals
signals, while correctly labeling 28 non-earthquake signals.                           than seismologists.

  FIGURE 8 | Map of stations showing the locations of recordings where no triggered seismicity (noise) occurred for different teleseismic earthquakes.

Frontiers in Earth Science | www.frontiersin.org                                   8                                               August 2020 | Volume 8 | Article 321
Tang et al.                                                                                                                           Earthquake Detective

  FIGURE 9 | Example seismogram with a triggered earthquake (red box) hidden in high background noise.

CONCLUSION                                                                         AUTHOR’S NOTE
Over 2000 citizen scientists helped classify more than                             All seismic data were downloaded through the IRIS web service
2000 seismograms from 30 large worldwide earthquakes                               (https://service.iris.edu/irisws/) using ObsPy (https://docs.obspy.
with magnitudes over 7.5 in the citizen science project                            org), including the following seismic networks (http://ds.iris.edu/
“Earthquake Detective” on Zooniverse. Citizen scientists                           mda): USArray (2003) and Alaska Earthquake Center (1987). The
generally agree more with each other when identifying (1)                          ANSS (Advanced National Seismic System) earthquake catalog
seismograms with earthquake signals and (2) the absence                            can be accessed at https://earthquake.usgs.gov/data/comcat/.
of distinct signals (noise) than when identifying tremor
or other signals. A subset of data we also classified by
experts (seismologists among the authors) and a machine-
learning algorithm trained to detect triggered earthquakes
                                                                                   DATA AVAILABILITY STATEMENT
(Tang et al., 2020). We compared these classifications                             The datasets generated for this study are available on request to
from a machine-learning algorithm, citizen scientists and                          the corresponding author.
seismologists with each other and with the earthquake
classifications of citizen scientists. We found that citizen
scientists did not misidentify seismograms without an
earthquake (no false positives) but missed 13 earthquake                           ETHICS STATEMENT
signals in seismograms (false negatives), while correctly
labeling 43 earthquake and 28 non-earthquake signals.                              Ethical review and approval was not required for the study
The machine-learning algorithm misidentified 11 non-                               on human participants in accordance with the local legislation
earthquake signals and failed to detect 9 earthquake signals                       and institutional requirements. Written informed consent from
in seismograms, while correctly labeling 47 earthquake and                         the participants’ legal guardian/next of kin was not required
17 non-earthquake signals. Both the citizen scientists and                         to participate in this study in accordance with the national
the machine-learning algorithm perform well in identifying                         legislation and the institutional requirements.
earthquakes, but the citizen scientists outperformed the
machine-learning algorithm in labeling non-earthquake
signals. Earthquake Detectives and a machine-learning                              AUTHOR CONTRIBUTIONS
algorithm experience similar degrees of difficulties for
example in identifying other seismic signals, which are                            VT, BR, and SL conceived and designed the project.
more challenging and requires more intelligence than                               VT organized the database of seismic data. VT,
identifying earthquakes, even though citizen scientists are                        BR, JN, and SL developed the project. JT and MP
currently better at both.                                                          contributed miscellaneous support for project development,

Frontiers in Earth Science | www.frontiersin.org                               9                                        August 2020 | Volume 8 | Article 321
Tang et al. Earthquake Detective
management, presentation, and strategy. KC contributed to data ACKNOWLEDGMENTS
collection and critical discussions of triggered seismic events. VT,
BR, and SL wrote the first draft of the manuscript and figures. All We thank Zhigang Peng and Laura Trouille for critical
authors contributed to the revision of the manuscript, read and discussions. We also sincerely thank over 2,000 citizen
approved the submitted version. scientists for important contributions to Earthquake Detective
on Zooniverse.
FUNDING
SUPPLEMENTARY MATERIAL
This research was funded by the Integrated Data-Driven
Discovery in Earth and Astrophysical Sciences (ID3 EAS) The Supplementary Material for this article can be found
program under National Science Foundation grant NSF- online at: https://www.frontiersin.org/articles/10.3389/feart.
NRT 1450006. 2020.00321/full#supplementary-material
REFERENCES Perol, T., Gharbi, M., and Denolle, M. (2018). Convolutional neural network for
earthquake detection and location. Sciencances 3:e1700578. doi: 10.1126/sciadv.
Aiken, C., and Peng, Z. (2014). Dynamic triggering of microearthquakes in three 1700578
geothermal/volcanic regions of California. J. Geophys. Res. Solid Earth 119, Prejean, S. G., Hill, D. P., Brodsky, E. E., Hough, S. E., Johnston, M. J. S., and
6992–7009. doi: 10.1002/2014jb011218 Malone, S. D. (2004). Remotely triggered seismicity on the United States west
Brodsky, E. E., and van der Elst, N. J. (2014). The uses of dynamic earthquake coast following the Mw 7.9 Denali fault earthquake. Bull. Seismol. Soc. Am. 94,
triggering. Annu. Rev. Earth Planet. Sci. 42, 317–339. doi: 10.1146/annurev- S348–S359.
earth-060313-054648 Rubinstein, J. L., Gomberg, J., Vidale, J. E., Wech, A. G., Kao, H., Creager, K. C.,
Chao, K., and Obara, K. (2016). Triggered tectonic tremor in various types of fault et al. (2009). Seismic wave triggering of nonvolcanic tremor, episodic tremor
systems of Japan following the 2012 Mw8. 6 Sumatra Earthquake. J. Geophys. and slip, and earthquakes on Vancouver Island. J. Geophysics. Res. 114:B00A01.
Res. Solid Earth 121, 170–187. doi: 10.1002/2015jb012566 Smith, K., and Tape, C. (2019). Seismic noise in central Alaska and influences
Chao, K., Peng, Z., Fabian, A., and Ojha, L. (2012). Comparisons of triggered from rivers, wind, and sedimentary basins. J. Geophys. Res. Solid Earth 124,
tremor in California. Bull. Seismol. Soc. Am. 102, 900–908. doi: 10.1785/ 11678–11704. doi: 10.1029/2019jb017695
0120110151 Swanson, A., Kosmala, M., Lintott, C., and Packer, C. (2016). A generalized
George, A., and Vidyapeetham, A. V. (2012). Anomaly detection based on machine approach for producing, quantifying, and validating citizen science data from
learning: dimensionality reduction using PCA and classification using SVM. wildlife images. Conserv. Biol. 30, 520–531. doi: 10.1111/cobi.12695
Int. J. Comput. Appl. 47, 5–8. doi: 10.5120/7470-0475 Tang, V., Seetharaman, P., Chao, K., Pardo, B. A., and van der Lee, S. (2020).
Gomberg, J., Rubinstein, J. L., Peng, Z., Creager, K. C., Vidale, J. E., and Bodin, P. Automating the detection of dynamically triggered earthquakes via a deep
(2008). Widespread triggering of nonvolcanic tremor in California. Science 319, metric learning algorithm. Seismol. Res. Lett. 91, 901–912.
173–173. doi: 10.1126/science.1149164 Xing, E. P., Jordan, M. I., Russell, S. J., and Ng, A. Y. (2003). “Distance metric
Hart, W., Albarracín, D., Eagly, A. H., Brechan, I., Lindberg, M. J., and Merrill, learning with application to clustering with side-information,” in Advances in
L. (2009). Feeling validated versus being correct: a meta-analysis of selective Neural Information Processing Systems, 521–528.
exposure to information. Psychol. Bull. 135, 555–588. doi: 10.1037/a0015701 Zwicker, E. (1961). Subdivision of the audible frequency range into critical bands
Ide, S. (2012). Variety and spatial heterogeneity of tectonic tremor worldwide. (Frequenzgruppen). J. Acoust. Soc. Am. 33, 248–248. doi: 10.1121/1.1908630
J. Geophys. Res. Solid Earth 117:B03303.
Kilb, D., Peng, Z., Simpson, D., Michael, A., Fisher, M., and Rohrlick, D. (2012). Conflict of Interest: The authors declare that the research was conducted in the
Listen, watch, learn: SeisSound video products. Seismol. Res. Lett. 83, 281–286. absence of any commercial or financial relationships that could be construed as a
doi: 10.1785/gssrl.83.2.281 potential conflict of interest.
Liang, W. T., Chen, K. H., Wu, Y. F., Yen, E., and Chang, C. Y. (2016). Earthquake
school in the cloud: citizen seismologists in Taiwan. Seismol. Res. Lett. 87, Copyright © 2020 Tang, Rösler, Nelson, Thompson, van der Lee, Chao and Paulsen.
177–185. doi: 10.1785/0220150061 This is an open-access article distributed under the terms of the Creative Commons
Miyazawa, M., and Mori, J. (2005). Detection of triggered deep low-frequency Attribution License (CC BY). The use, distribution or reproduction in other forums
events from the 2003 Tokachi-oki earthquake. Geophys. Res. Lett. 32:L10307. is permitted, provided the original author(s) and the copyright owner(s) are credited
Peng, Z., and Gomberg, J. (2010). An integrated perspective of the continuum and that the original publication in this journal is cited, in accordance with accepted
between earthquakes and slow-slip phenomena. Nat. Geosci. 3, 599–607. doi: academic practice. No use, distribution or reproduction is permitted which does not
10.1038/ngeo940 comply with these terms.
Frontiers in Earth Science | www.frontiersin.org 10 August 2020 | Volume 8 | Article 321You can also read