VITAMIN C DETECTION WITH ITALSENS IS-C - PALMSENS
←
→
Page content transcription
If your browser does not render page correctly, please read the page content below
Vitamin C Detection with ItalSens IS-C

Creating a calibration curve for ascorbic acid detection

Last revision: January 26, 2021

© 2021 PalmSens BV

www.palmsens.com
Vitamin C Detection with ItalSens IS-C

Contents
1     Introduction .....................................................................................................................................3
    1.1       Goals ......................................................................................................................................3
    1.2       Vitamin C ................................................................................................................................3
    1.3       Cyclic Voltammetry .................................................................................................................3
    1.4       Vitamin C Oxidation ................................................................................................................6
2     Experimental ...................................................................................................................................7
    2.1       Safety .....................................................................................................................................7
    2.2       Professional or Amateur? .......................................................................................................7
    2.3       Equipment ..............................................................................................................................7
      2.3.1      Solutions and Chemicals ....................................................................................................8
      2.3.2      Performing the measurement .............................................................................................9
    2.4       Simple and Quick Version ....................................................................................................10
      2.4.1      Equipment.........................................................................................................................10
      2.4.2      Solution and Chemicals ....................................................................................................10
      2.4.3      Performing the measurement ...........................................................................................11
3     Making a calibration curve.............................................................................................................11
      3.1.1      Example ............................................................................................................................12
4     Extra Information ...........................................................................................................................13
      4.1.1      Linear Range ....................................................................................................................13
      4.1.2      Background Correction .....................................................................................................13
      4.1.3      Other measurement techniques........................................................................................13
      4.1.4      Vitamin C beverages ........................................................................................................13

2                                                                                                                                        Introduction
Vitamin C Detection with ItalSens IS-C 1 Introduction 1.1 Goals This application note describes a simple experiment using non-toxic solutions, which can be disposed in household garbage or the regular wastewater. The experiment helps to get some hands on electrochemistry experience with safe substances. 1.2 Vitamin C It is common knowledge that ascorbic acid, which is also known as vitamin C, cures scurvy. Actually scurvy is the result of a vitamin C deficiency. The name ascorbic acid is referring to its anti-scurvy properties as well. Already in 1753 it was observed that citrus fruits cure scurvy, but the responsible substance, vitamin C, was discovered much later in 1912. It was isolated in 1928 and already in 1933 vitamin C was the first vitamin to be chemically produced. Vitamin C is necessary for collagen production inside the human body, which is the reason why vitamin C deficiency causes scurvy. Collagen is an important component of strong tissue. Vitamin C is required for a properly running immune system and it acts as a reducing agent (antioxidant), for example as a free radical scavenger. For this application the fact that vitamin C is easily oxidized while reducing other reactants will be exploited. Vitamin C has also applications outside the human body or an electrochemical cell. Fruits, which do turn brown when exposed to air like apples, won’t turn brown when sprinkled with vitamin C powder or lemon juice. Unfortunately, unlike many other animals humans cannot make their own vitamin C and thus humans need to consume vitamin C containing products in their diet. Usually, fresh fruit and vegetables contain enough ascorbic acid or ascorbates to cover our vitamin C requirement. Different health organizations give different recommendations, but a daily amount of vitamin C of around 100 mg should be more than sufficient. Vitamin C was promoted to be beneficial for preventing or reducing sicknesses especially the common cold when taken in higher dosage. There is very little to no scientific evidence to support this claim. However, the image of a health benefit due to a vitamin C rich diet makes ascorbic acid a great food additive. It makes the food sour, preserves it and promotes the idea that the product has health benefits. 1.3 Cyclic Voltammetry Cyclic Voltammetry (CV) is the most popular technique in electrochemistry. It gives quantitative information, allows studying mechanism, kinetics and gives qualitative information. Before the boom of Electrochemical Impedance Spectroscopy (EIS) and spectroelectrochemistry CV was said to be the elecrochemist’s spectroscopy. Just like an infrared (IR)- or nuclear magnetic resonance (NMR)- spectrum the shape of the CV, the position of the peaks and the amount of the current can tell an experienced electrochemist a lot about the inspected system. A detailed explanation of the theoretical background and analysis of a CV is beyond the scope of this application note. Fortunately, all standard electrochemistry textbooks cover this topic, for example: Allen J. Bard, Larry R. Faulkner, Electrochemical Methods: Fundamentals and Applications, 2nd Edition, January 2001, ISBN: 978-0-471-04372-0 Cynthia G. Zoski, Handbook of Electrochemistry, December 2006, ISBN: 978-0-444-51958-0 Joseph Wang, Analytical Electrochemistry, 3rd Edition, June 2006, ISBN: 978-0-471-67879-3 The next paragraphs are a very brief introduction to CV. While the name potentiostat implies that it can hold a constant potential, a potentiostat can also create precisely controlled dynamic potentials. Popular dynamic potential profiles are a linear increase (ramp or sweep) and pulses, which are short jumps between different potentials. The measuring principle is the same as during constant potential measurements: The potential is applied between the working and reference electrodes, while the current is flowing and measured between the working and counter electrode. Introduction 3
Vitamin C Detection with ItalSens IS-C

                           Figure 1 Potential profile of a cyclic voltammogram

Cyclic Voltammetry is related to Linear Sweep Voltammetry (LSV). During Linear Sweep Voltammetry
a linear potential sweep is applied from an initial potential to a final potential while the current is
measured. During a CV an additional sweep follows the first sweep. The second sweep has the same
potential slope as the first one, but in the opposite direction, so 100 mV/s become -100 mV/s and
usually the final potential of the second sweep is the starting potential of the first sweep, thus it is a
cyclic process (see Figure 1).
The current is recorded during these potential sweeps. Currents during electrochemical experiments
can be caused by two effects. It can be caused by a chemical reaction at the electrode. This is
Faraday current. Or the current can be caused by the movement and accumulation of ions in front of
the electrode, which makes the electrode behave like a capacitor. Every change of potential will create
a current as a result of the capacitor storing more or less charge. This current is called capacitive
charging current, which is often abbreviated to capacitive current.
Capacitive current is usually something that electrochemists try to avoid, because it is creating a
background current for their Faraday current, which they are actually interested in. During a CV the
potential is changed with a constant rate, the scan rate, and so a constant capacitive charging current
is present. The higher the scan rate the higher is the background current.
During most electrochemical experiments the Faraday current is the interesting part of the current.
The potential range of the CV is usually chosen in a way that the reaction of interest happens in that
potential range. For example, if you are interested in the oxidation of an iron species and you expect
that to occur at around 200 mV, you start the measurement at -200 mV and end at 500 mV.
As you know potentials aren’t absolute, but only potential differences can be measured. For a
potentiostat the reference point or the potential of 0 V is the reference electrode. In this application
note all the potential where measured versus a silver electrode covered with silver chloride. The
abbreviation for that is Ag/AgCl. Often you will find in literature the type of reference electrode together
with the potential, for example -200 mV vs Ag/AgCl.
Usually a starting potential, where the reaction does not happen, is chosen, e.g. -200 mV. When the
potential approaches the redox potential of the active species, the oxidation starts and a current
occurs. This current is potential limited and follows the Nernst equation.
At some point the current starts to decrease again until a steady value is reached. This part of the
curve is controlled by diffusion. When the reaction starts plenty of active species is in front of the
electrode. The species is depleted by the reaction and the current decreases. New species is
transported by diffusion from the bulk to the electrode. At this point of the CV the current is limited by
diffusion (see Figure 2).

4                                                                                              Introduction
Vitamin C Detection with ItalSens IS-C
Figure 2 Relationship between a potential ramp and the measured current in an LSV
After the scan rate changed direction and the potential gets closer to the redox potential the previously
consumed species will be now produced. Assuming that the reaction triggered in the previous step is
reversible. This will create a current as well, which is first potential limited and then limited due to the
depletion of the consumed species. If you want to visualize this process, you could imagine the
electrode is breathing out a cloud and in the next sweep inhaling the same cloud. The resulting current
versus time is visible in Figure 3.
Figure 3 Current versus time during a cyclic voltammogram
The results of voltammetry techniques are plotted as a voltammogram, which is a plot of current
versus potential. The shape of the current as described above and plotting I vs E leads to the iconic
“duck” shape of the CV (see Figure 4).
Introduction 5Vitamin C Detection with ItalSens IS-C
Figure 4 left scheme of a CV with some important parameters; right measured CV
Cyclic Voltammetry allows studying time dependency, because the scan rate can be adjusted. How
peaks are behaving when the scan rate is changed shows how fast certain reactions are happening
and if the species is on the surface or free diffusing. The potential of the peak is an indication for the
species that is reacting. The presence of a peak during the anodic (towards positive potentials) and
cathodic (towards negative potentials) sweep shows that a reaction is reversible. And the peak current
is proportional to the concentration of the reacting species.
Usually oxidation reactions happen during the anodic sweep and reduction reactions during the
cathodic sweep. The International Union of Pure and Applied Chemistry (IUPAC) has agreed that
positive currents are oxidating currents and negative currents are reducing currents. That means when
you measure a positive currents electrons are going into the working electrode while something in
solution is oxidized and electrons go from the counter electrode into the solution while something in
solution is reduced. If the measured current is negative, the working electrode reduces something in
the solution and the counter electrode oxidizes.
Unfortunately, there is another convention, which is called the polarographic convention. There
positive current is reducing and negative oxidizing, plus the negative potentials are plotted on the right
side and the positive potential on the left side of the abscissa.
1.4 Vitamin C Oxidation
The suggested mechanism for an electrochemical oxidation of ascorbic acid is shown in Figure 5. First
the ascorbic acid is oxidized under the loss of 2 electrons and 2 protons. This is a reversible process,
but the oxidized form of ascorbic acid reacts with water irreversibly. The product of this reaction is not
electroactive and thus cannot be reduced or oxidized at an electrode.
Figure 5 Electrochemical oxidation of ascorbic acid (source: Chem. Educator 2000, 5, 59–61)
6 IntroductionVitamin C Detection with ItalSens IS-C
Cyclic voltammetry supports this mechanism. In Figure 6 a cyclic voltammogram of a graphite paste
electrode in a vitamin C solution (1 g/L in phosphate buffer) is shown. A clear oxidation peak is visible
in the anodic sweep (from -0.5 to 0.9 V) at around 0.4 V. The reduction peak is entirely missing,
because the reduced species went through an irreversible reaction and cannot be reduced again. As a
result no peak is observed during the second sweep from 0.9 to -0.5 V.
Figure 6 Cyclic Voltammogram of 1 g/L ascorbic acid solution at a graphite paste working electrode,
potentials are versus Ag/AgCl (source: Chem. Educator 2000, 5, 59–61)
2 Experimental
2.1 Safety
As previously mentioned, this application note offers the opportunity to work with an electrochemical
detection method without working with toxic substances or needing special disposal regulations.
However, there are still some safety points to be considered.
• Don’t drink or eat something that was in contact with lab equipment. For example, don’t
dissolve vitamin C in a beaker, take your sample with a pipette and drink from the beaker. You
never know how well the beaker was cleaned before etc.
• Even harmless chemicals should be stored in an area, where no eating or drinking is allowed.
• While the solutions in this experiment have low concentrations that are harmless the powders
or concentrated solutions can still cause irritations especially in your eyes.
• When making and handling your stock solutions, please wear eye protection and know where
the next eye wash bottle or shower is. Keep in mind that should you get some substance in
your eyes, you might need to go to the eye wash bottle or eye shower with closed eyes.
• To work in an informed way read the safety sheet that is coming with the substances.
2.2 Professional or Amateur?
In this application note we present two ways of performing this measurement. If you have laboratory
experience and equipment, the steps described from chapter 2.3 onwards are usually low cost and
easy for you, because micro pipettes are a common item in chemistry and biology labs.
If you don’t have the experience, the equipment or the budget to get the equipment, we recommend
the version starting from chapter 2.4. It presents an easy and fast way to demonstrate the principle,
but is less accurate and won’t allow to make a real calibration curve, just the idea of the calibration
curve.
2.3 Equipment
- EmStat Pico Development Kit
- ItalSens IS-C (screen printed electrodes based on graphite ink)
- vessels to store solution (closed)
- vessels to mix solutions (can be same as storage solution)
- volumetric cylinder (200 mL)
Experimental 7Vitamin C Detection with ItalSens IS-C
- micro pipette for around 100 µL, e.g. 20 µL to 200 µL
- micro pipette for around 800 µL, e.g. 100 µL to 1000 µL
- paper tissues
2.3.1 Solutions and Chemicals
2.3.1.1 Phosphate Buffer
You need Phosphate buffer pH 7 with a concentration around 0.1 mol/L.
Phosphate buffer is very common and pH 7 is quite popular. There are many products that allow to
make phosphate buffer very easily. A powder or tablet will do the trick, because demineralized water is
often available. You can also buy pre-made phosphate buffer directly.
For these experiments Phosphate Buffered Saline (PBS) by VWR (Netherlands) was used. It has the
article number 0780-10L. 1.975 g of this powder was dissolved in 200 mL demineralized water to
make a phosphate buffer with a concentration of 0.1 mol/L and pH 7.
2.3.1.2 Vitamin C solution
Many vitamin C food supplements are available at drug stores, pharmacies and super markets. They
are the easiest ways to get vitamin C solutions. Unfortunately, they often contain additional
substances like aromas or colors that might show as well electrochemical activity. Choosing a product
with high vitamin C content increases the ratio of vitamin C to other substances. So it is a good idea to
buy high concentration products. It is even better if you manage to get pure ascorbic acid powder.
How you will make your stock solution depends on your vitamin C containing product.
If you have powder or an effervescent tablet you can just dissolve it in around 30 mL of buffer solution.
After dissolving the vitamin C product fill up to 40 mL and calculate the concentration of your solution.
In this application note, I will work with the mass concentration so c = m(vitamin C) / V(solution).
Where m(vitamin C) is the mass of vitamin C and V(solution) is the volume of the solution. The mass
concentrations units are for example g/L or mg/L.
If you have a vitamin tablet, you need to grind it with a mortar and pestle or other methods or ways of
turning it into a powder. You want to collect all the resulting powder and you don’t want anything else
than the tablet’s powder, so make sure the used tools are clean. Put your powder in 30 mL of buffer
solution and shake or stir for 10 minutes. Not all of the binders will dissolve in the buffer, so your
solution will have solid parts. The long stirring or shaking should make sure all the vitamin C is
extracted from the powder. Afterwards fill the solution up to 40 mL and calculate the concentration (c =
m(vitamin C) / V).
This is your stock solution.
Make 10 mL of a 200 mg/L solution by diluting a small amount of stock solution to 10 mL. If you have
never done this, this sounds a bit abstract. An example will be given in the next paragraph. Generic
instructions cannot be given, because the vitamin C products have different amounts of vitamin C
which results in different concentrations of your stock solution.
Example: Here is an example for an effervescent tablet with 1000 mg of vitamin C in it.
The original 1000 mg effervescent tablet was dissolved in 30 mL buffer and then diluted to 40 mL. This
means the 40 mL contain now 1000 mg vitamin C. 1000 mg / 40 mL = 25 mg/mL = 25 g/L. To make
10 mL of a 200 mg/L solution you need 2 mg of vitamin C. Which is calculated by multiplying the
volume you want to have with the concentration you want to have: Vwant * cwant = mwant
You need to know how much stock solution to add, so you calculate the volume like this:
Vstock = mwant / cstock
This means you need 2 mg / 25 000 mg/L = 80 µL of stock solution. This will be diluted with buffer to
10 mL.
2.3.1.3 Calibration solutions
Prepare multiple solutions that contain different known concentrations of vitamin C. I used the
following concentrations in the range of 20 mg/L and 150 mg/L.
You can make the different solutions from your 200 mg/L solution.
If you have vessels that are suitable for mixing 1 mL solution like Eppendorf tubes, this could be very
convenient.
Mix the following concentration by adding the stock vitamin C solution to the buffer:
8 ExperimentalVitamin C Detection with ItalSens IS-C End Concentration vitamin C 200 mg/L stock solution buffer 20 mg/L 100 µL 900 µL 40 mg/L 200 µL 800 µL 60 mg/L 300 µL 700 µL 80 mg/L 400 µL 600 µL 100 mg/L 500 µL 500 µL 120 mg/L 600 µL 400 µL 140 mg/L 700 µL 300 µL Should you find it difficult to handle such small volumes of solutions, just multiply the volumes by 10, for example 1 mL stock solution plus 9 mL of buffer will lead to 10 mL of 20 mg/L solution. These solutions should be stored dark and cold. I also recommend to not use them longer than a week, because the vitamin C will start to decay. 2.3.2 Performing the measurement 2.3.2.1 Cut the electrode The electrodes (ItalSens IS-C) are delivered in stripes of 20 pieces each piece with working, reference and counter electrode. They are printed on polyester, so you can cut the electrodes with a pair of scissors. Don’t touch the electrodes with bare hands to keep the electrodes clean. Wearing gloves during cutting is recommended. Make the first cut to separate one set of 3 electrodes from the strip. Then make the part around the connection pads narrow enough to fit them into the SPE connector delivered together with the EmStat Pico Development Kit. Be careful and don’t cut the leads or other conducting parts of the electrodes. If you haven’t already insert the SPE connector into the screw terminals of the development board and fix it, you need to do that now. The pins should be inserted into the WE, CE and RE connection of one channel. When you slide in the electrodes make sure the contact pads are aligned with the metal arcs in the connector. 2.3.2.2 Set the parameters Connect the development board to your computer and open PSTrace. Connect the EmStat Pico with the software as described in your quick start. Choose as technique Cyclic Voltammetry and set the following parameters: Parameter Value Technique Cyclic Voltammetry t equilibration 5s E begin -0.2 V E vertex1 0.7 V E vertex2 -0.2 V E step 0.005 V Scan rate 0.05 V/s Number of Scans 1 2.3.2.3 Background measurement First make a measurement of the phosphate buffer to know what signals are present without the vitamin C present. Take 100 µL of the phosphate buffer and put it on the electrodes. You need to cover the reference, counter and working electrode with the formed droplet. Press the Run-Button. The CV for the electrode just with buffer is recorded. Typical features are peaks close to 0 V resulting from silver that is released from the reference electrodes. Increasing current above 400 mV is the result of carbon species on the electrodes surface being oxidized or the onset of water oxidation. A typical background is visible in Figure 7. Experimental 9
Vitamin C Detection with ItalSens IS-C

         Figure 7 Cyclic Voltammogram of Phosphate buffer pH 7 0.1 mol/L on an IS-C electrode

2.3.2.4 Measurements for a Calibration Curve
Remove the buffer drop by carefully using a paper tissue. Apply 100 µL of the 20 mg/L vitamin C
solution.
Change the drop down menu next to the Run-button to Overlay.
Run the measurement. A CV with a prominent peak on the anodic sweep at around 270 mV, that has
no twin on the cathodic sweep, should have appeared. This is the vitamin C oxidation (see Figure 9).
It is handy to change the name of the measurement or curve to the vitamin C concentration used.
Remove the droplet with a paper tissue and repeat the measurement with a 100 µL droplet of the
40 mg/L solution.
Repeat this for all the solutions up to 140 mg/L.

2.4 Simple and Quick Version
In this chapter we will present a version of the experiment that is easy to perform even for someone
without experience in a laboratory. It is also a very fast version of the experiment, because less
solutions need to be prepared. A drawback is the missing information of the precise concentration
used for the calibration.

2.4.1 Equipment
     -   EmStat Pico Development Kit
     -   ItalSens IS-C (screen printed electrodes based on graphite ink)
     -   vessels to store solution (closed)
     -   vessels to mix solutions (can be same as storage solution)
     -   volumetric cylinder (200 mL) / or other means to measure volume
     -   Pasteur pipette
     -   paper tissues

2.4.2 Solution and Chemicals
Prepare the phosphate buffer as described in chapter 2.3.1.1.
Read chapter 2.3.1.2 until “This is your stock solution.” to learn how to make your stock solution.
This vitamin C stock solution has a very high concentration. To use it, it needs to be diluted. A 10-fold
dilution should work fine. Take 1 mL of this solution and add 9 mL buffer. If you have issues
measuring low volumes, you can use a kitchen or letter scale and work with the weight. You can
assume that 1 mL weigh 1 g. Or you multiply the used volumes by 10.
Vitamin c solutions should be stored dark and cold. I also recommend to not use them longer than a
week, because the vitamin C will start to decay.

10                                                                                          Experimental
Vitamin C Detection with ItalSens IS-C 2.4.3 Performing the measurement The steps described in the chapters 2.3.2.1, 2.3.2.2 and 2.3.2.3, i.e. cutting the electrodes, setting the parameters and performing the background scan, are exactly the same in this version and the one described in 2.3, but for one exception: Instead of a precise 100 µL drop use during recording the background the Pasteur pipette to place drop on the strip that covers all three electrodes. 2.4.3.1 Measurements for a Calibration Curve Add to 10 mL buffer one droplet of your 10-fold diluted vitamin C solution. Mix well. Remove the buffer drop from the strip by carefully using a paper tissue. Apply 1 droplet of the buffer spiked with one drop of the 10-fold diluted vitamin C solution. Change the drop down menu next to the Run-button to Overlay. Run the measurement. A CV with a prominent peak on the anodic sweep at around 270 mV, that has no twin on the cathodic sweep, should have appeared. This is the vitamin C oxidation (see Figure 9). It is handy to change the name of the measurement or curve to the number of drops added. Clean the pipette by taking up water and dispose of the water. Repeat this a few times. Or you can use one pipette for your stock solution and on to apply the sample to your electrode. Add another droplet of the 10-fold diluted vitamin C solution to the 10 mL of buffer. Mix well. Remove the droplet from the strip with a paper tissue and repeat the measurement with a new droplet of the solution containing 2 droplets of stock solution. Repeat this 3 more times, so that the 10 mL buffer solution was spiked with a total of 5 drops. This method is less reliable than solutions with known concentration. Due to this reason it can happen that the currents are too high and the instrument runs into the compliance voltage. This is usually visible due to a kink in the CV (see Figure 8). As long as that kink appears at a potential higher than the peak potential, the measurement should still be fine. To get rid of the kink dilute the vitamin C solution further than 10-fold, maybe 20-fold. Figure 8 Cyclic Voltammogram from Figure 7 (blue) and a CV with a solution containing 10 droplets of vitamin C solution 10-fold diluted (grey), kinks by running into the compliance voltage are highlighted 3 Making a calibration curve In a CV the peak current depends on the concentration in a linear way. So for the calibration curve we can just plot the peak current versus the concentration of the vitamin C. The peak current is the current at the top of the peak. This can be easily done in Excel or in any other spread sheet software. Making a calibration curve 11
Vitamin C Detection with ItalSens IS-C
Note down the concentration of the droplet on the electrodes and the peak current in the CV of the
corresponding measurement. If you have used the quick version described in 2.4, note down the
number of drops used to spike the buffer instead of the exact concentration.
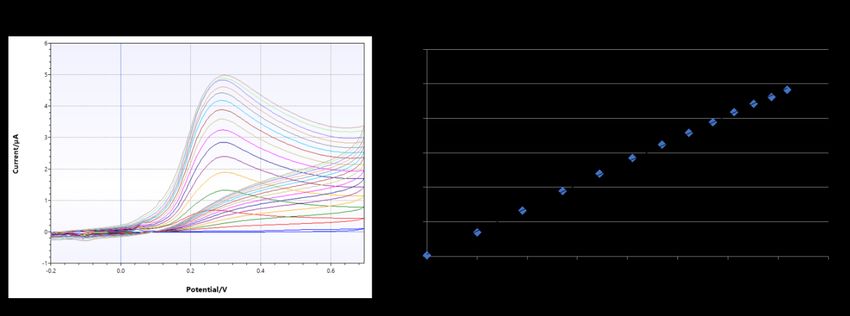
To find the peak current just choose the Select point tool and click on the peak. The peak current is
displayer (see Figure 9).
Figure 9 Cyclic Voltammogram from Figure 7 (blue) and a CV with a solution containing 20 mg/L
vitamin C, peak current and point selecting tool are highlighted
Afterwards plot in the spread sheet software the peak current versus the concentration. And perform a
linear fit to gain the function of the calibration curve.
3.1.1 Example
A series of measurements with different vitamin C concentrations is visible in Figure 10a. The peak
currents of these measurements were taken to create a calibration curve visible in Figure 10b.
Figure 10 Series of CVs with increasing vitamin C concentration (a) and the matching calibration
curve(b)
12 Making a calibration curveVitamin C Detection with ItalSens IS-C 4 Extra Information 4.1.1 Linear Range Most detection methods have some kind of function to calculate from a signal the concentration or another parameter of interest. A linear function is easy to understand and to handle, so usually a linear dependency between signal and concentration is preferable. Due to their physical or chemical properties the relationship of signal and concentration is not linear for all concentrations. If you develop a detection method you need to check for which concentrations the calibration curve is linear. 4.1.2 Background Correction In this experiment usually results are obtained, that don’t require a background correction. The measurement with no phosphate buffer shows negligible current compared to the measurement with vitamin C. The growing peak is even strong enough to ignore the baseline correction. For a baseline correction the curve from the start of the measurement is extrapolated and the peak current is measured with that baseline as 0. As an alternative the measurement of the phosphate buffer, which has a concentration of 0 mg/L could be subtracted from the other voltammograms. Experiments have shown that in this case only the intersection changes and not the slope of the calibration curve and thus it can be skipped. 4.1.3 Other measurement techniques I chose CV here as a technique because it allows to see that the peak associated with vitamin C has no reduction peak. Linear Sweep Voltammetry (LSV) would have worked as well, because it corresponds to have just the cathodic sweep of the CV. Differential Pulse Voltammetry (DPV) or Square Wave Voltammetry (SQV) could have worked as well, but they are usually more sensitive for reversible reactions. A very different approach is a Chronoamperometry (CA). During this technique a constant potential is applied and the current is measured. If a potential higher than the peak potential of vitamin C is applied and the electrode is immersed in a buffer solution, the concentration of vitamin in this solution could be increased and the corresponding current measured. This requires stirring, a holder for the potentiostat, etc. and I found it easier to work with drops of solution. 4.1.4 Vitamin C beverages I used the ItalSens I-C carbon electrodes. These electrodes are made from graphite paste and are not specific for vitamin C. This means other reaction can also take place at these electrodes. There are several publications describing how to make electrodes that allow more specific quantification of vitamin C, which allowed measurements of vitamin C inside beverages like orange juice or vitamin water. Unfortunately, I have tried several drinks in different buffer concentrations, but I was not able to measure the vitamin C content with unmodified IS-C electrodes. Extra Information 13
Vitamin C Detection with ItalSens IS-C

14                             Extra Information
You can also read