Optimization and Characterization Freeze Dried Fish Protein Hydrolysate Production
←
→
Page content transcription
If your browser does not render page correctly, please read the page content below
E3S Web of Conferences 302, 02007 (2021)                                                            https://doi.org/10.1051/e3sconf/202130202007
RI²C 2021

         Optimization and Characterization Freeze Dried Fish Protein
         Hydrolysate Production
         Sasithorn Kongruang1,*, Nicharee Wisuthiphaet1
         1Bioprocess Engineering and Biotechnology Center, Department of Biotechnology, Faculty of Applied Science, King Mongkut’s
         University of Technology North Bangkok, Bangkok, 10800, Thailand

                       Abstract. The production of fish protein hydrolysate from underutilized fish species is attracting the
                       industrial interest for increasing the rich protein values. The central composite design was used to optimize
                       the degree of enzymatic hydrolysis of freeze-dried fish protein hydrolysate (FPH) production by the
                       application of commercial Alcalase on the recovery mixed small fish protein. The effects of time,
                       temperature, pH and enzyme concentration on the degree of hydrolysis (DH) of five strains of fish as
                       Rastrelliger brachysoma (short-bodied mackerel), Rastrelliger kanagurta (Indian mackerel), Leiognathidae
                       (Ponyfish), Amblygaster leiogaster (Smooth belly sardinella) and Selaroides leptolepis (yellow-stripe scad)
                       were experimented. Result showed that the FSH production was optimized at 2.85%v/w enzyme
                       concentration at 61 ̊C, pH 8.50 for 27 min with 89.42% DH. Mathematical model was proposed and
                       validated under the optimum condition. The high proportion (46.43%) of smaller molecular weight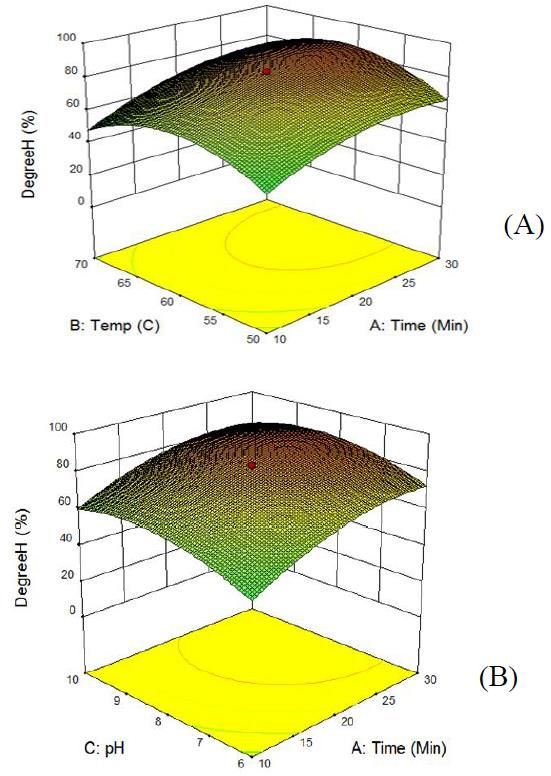
E3S Web of Conferences 302, 02007 (2021)                                                      https://doi.org/10.1051/e3sconf/202130202007
RI²C 2021

      U.mL-1; EC 3.4.21.14) was obtained from EMD
      Millipore, USA and stored at 40C until used. HPLC
      grade acetonitrile, chloroform and acetone were supplied                                                                  (1)
      by Fisher Scientific. All other chemicals used analytical
      grade.                                                           Here, X1, X2, X3, X4, are the parameter values for the
                                                                       independent variables (time, temperature, pH, enzyme
                                                                       concentration) as described in Table 2. The constants
      2.2 Substrate
                                                                       β0, βi, and βij (i, j = 1, 2, 3, 4) are coefficient estimates
                                                                       for degree of hydrolysis (y1), where β0 is an intercept
      Five fish strains as Rastrelliger brachysoma (short-             term, βi are linear terms, βii are quadratic terms, and βij
      bodied mackerel), Rastrelliger kanagurta (Indian                 are interaction terms. The accuracy and general
      mackerel), Leiognathidae (Ponyfish), Amblygaster                 suitability of the above polynomial model was evaluated
      leiogaster (Smooth belly sardinella) and Selaroides              by the coefficient of determination (R2). The
      leptolepis (yellow-stripe scad) were provided by animal          experimental data was analyzed using the statistical
      feed company, INTEQC Group., Co Ltd, Thailand.                   software, Design-Expert software version 8.0.6 (STAT-
      Equal proportion of fish was washed, minced to                   EASE Inc., Minneapolis, MN, USA)
      homogenous paste (< 3 mm in size) and then placed in
      plastic bags immediately after process. These 100 g of           Table1. Levels of factor for fish protein hydrolysis production.
      samples was stored in -20 0C individually until further
      use.                                                                   Factor                          Level
                                                                                               1       2        3      4       5
      2.3 Proximate chemical analysis                                  A: Time (min)           0       10      20      30      40
                                                                       B: Temp (0C)           40       50      60      70      80
      The chemical compositions of mixed fish samples and              C: pH                   4       6        8      10      12
      FPH were determined according to Association of                  D: Concentration        1       2        3      4       5
                                                                       (%v/w)
      Official Analytical Chemists (AOAC, 1990). All
      experiments performed in triplicate.
                                                                       2.6 Degree of hydrolysis
      2.4 Enzymatic hydrolysis
                                                                       DH of FPH was analyzed for the content of α-amino acid
      Each experiment run was carried out 10 g of samples              from the supernatant of each hydrolysis run according to
      were thawed at room temperature and adjusted pH 4-12             Adler-Nissan, 1979 [23]. The degree of hydrolysis
      according the experiment plan in 250 mL Erlenmeyer               calculation reported according to equation 2.
      flask. Samples were then adjusted the final volume to 30               DH= [(Lt - L0) / (Lmax - L0)] ×100        (2)
      mL and incubated in shaking incubator at desired
      temperature from 40-80 0C at 200 rpm for the reaction            2.7 Molecular distribution of FPH
      times from 0-40 min. Different concentrations of                 The supernatant of FPH was subjected to sequentially
      Alcalase were added at 1-5 %v/w during the control               ultramembrane filtration by using a series of membranes
      hydrolysis reaction temperature. To stop the reaction, the       (Centrifugal Devices, PALL Corporation, USA) from
      mixtures were stopped at 85 0C for 5 minutes. The                100, 30, 10, 5, 3 and 1 kDa, respectively. Fractions of
      samples were then transferred to microcentrifuge tube            hydrolysate separation were centrifuged at 2,000 g-force
      after centrifuged at 12,000 rpm for 15 min for analytical        for 5 min. to obtain both retentate and permeate. Both
      analysis.                                                        fractions were collected and measured its protein
                                                                       concentration by Nanodrop (Optizen NANOQ, Mecasys
      2.5 Central composite design                                     Co., Ltd, Korea).

      The chosen parameters on FPH were evaluated using
      response surface methodology (RSM). The Central                  2.8 Amino acid composition analysis
      Composite Statistical Design (CCD) was carried out the           Chromatographic conditions of the HPLC system
      statistical model for the individual and interactive the         consisted of 626 pump, a 727 autosampler, 600S
      effects of time (0-40 min), temperature (40-80°C), pH            controller (Waters, MA), and a scanning fluorescence
      (4-12) and enzyme concentration (1-5% v/w) on the                detector (Hewlett Packard), MillinniumTM 2010 were
      degree of hydrolysis. Levels of these factors were               used to determine the amino acid profile. The amino acid
      optimized for maximum degree of hydrolysis (the                  composition and chemical score of amino acid
      response) according to Table 1. All the 30-trial                 composition were previously calculated [24].
      experiments were investigated in triplicate. Degree of
      hydrolysis was determined as the response for the                2.9 Statistical analysis
      combination of the reaction effects given in Table 2.            All data were expressed as mean + SD for all
      The regression analysis of data obtained on degree of            experiment. ANOVA was used to determine the
      hydrolysis was chosen as quadratic model by equations            significance of each term in the fitted equation. A p-
      of the following form:                                           value less than 0.05 was considered statistically
                                                                       significant.

                                                                   2
E3S Web of Conferences 302, 02007 (2021) https://doi.org/10.1051/e3sconf/202130202007
RI²C 2021
3 Results and discussion two interactions with temperature (Table 3). For the DH,
the high coefficient of determination value (R2= 0.8465)
3.1 Degree of hydrolysis indicated that 84.65% of the variability in the response
could be explained by the model. The independent and
The influential parameters including time, temperature, dependent variables were re-analyzed to obtain a real
pH and enzyme concentration on the Alcalase hydrolysis effect parameter model from regression equation that
to DH were determined using CCD as described on the could predict the response within the given range. The
previous section. The design matrix of all the regression equation for DH was reevaluated by the
independent variables and the result of 30 runs in regression coefficient of linear, quadratic and interaction
triplicate on DH are exhibited in Table 2. The observed terms to fit a response surface model.
results found DH in the range of 0% to 95.38%. The
highest observed condition for the DH of 95.38% was
Table 3. ANOVA of enzymatic hydrolysis of fish protein
found at 60 0C, pH 8.0 with 3% v/w enzyme affected by condition parameters for full quadratic equation.
concentration over 40 min. The quadratic term for
Source Sum of d Mean F p-value
hydrolysis temperature was found highly significant f Value
Squares Square Prob >F
affecting DH (p < 0.0001) followed by pH with p-value
of 0.0019 as shown in the ANOVA (Table 3). Model
14344.1 1
1024.58 5.91 0.0008
2 4
Table 2. Actual levels of Alcalase hydrolysis conditions along 1
A-Time 240.93 240.93 1.39 0.2569
with the observed values for the response variable, degree of
hydrolysis. B-Temp 5997.38 1 5997.38 34.58 < 0.0001
Run Time Temp. pH Conc. DH C-pH 2437.11 1 2437.11 14.05 0.0019
(min) (0C) (% v/w) D- 1
concentr 14.82 14.82 0.085 0.7740
1 30 70 6 2 64.04 4.62 ation
2 30 70 10 2 69.62 6.40 AB 47.99 1 47.99 0.28 0.6065
3 20 60 4 3 32.5 1.90 AC 14.08 1 14.08 0.081 0.7796
4 30 50 6 2 35.96 1.28
AD 32.18 1 32.18 0.19 0.6728
5 20 60 8 3 82.88 1.17
BC 407.54 1 407.54 2.35 0.1461
6 20 80 8 3 8.85 4.89
1 3.397E
7 0 60 8 3 0 BD 0.59 0.59
-003
0.9543
8 20 60 8 1 86.92 0.74
CD 22.21 1 22.21 0.13 0.7254
9 20 60 8 5 84.81 0.09 2
A 1731.42 1 1731.42 9.98 0.0065
10 40 60 8 3 95.38 1.68
B2 6706.16 1 6706.16 38.67 < 0.0001
11 20 60 8 3 82.12 5.40
12 C2 2331.08 1 2331.08 13.44 0.0023
20 60 8 3 83.46 2.14
13 D2 70.10 1 70.10 0.40 0.5345
10 70 6 2 46.15 6.04
14 30 70 10 4 66.54 2.06 Residual 1
2601.20 173.41
5
15 20 60 8 3 82.69 2.03
Cor 16945.3 2
16 30 50 6 4 49.23 2.69 Total 1 9
17 10 50 10 4 53.46 1.54
18 10 50 6 2 33.46 0.62 The resulting ANOVA for the reduced quadratic
19 10 70 6 4 56.15 3.08 model (Table 4) summarizes the analysis of variance of
20 30 70 6 4 65.38 3.81 each response and shows the significant model terms.
21 20 60 8 3 81.92 0.78 The F-value of 11.57 implies that the model is
22 10 70 10 4 51.54 0.99 significant (at p < 0.0001). Values of “Prob > F” (p
23 30 50 10 2 56.15 0.38 values) less than 0.05 indicated that the model terms
24 20 60 8 3 82.31 0.54 were significant. There is only a 0.01% chance that a
25 10 50 6 4 25.00 0.59 “Model F Value” this large could occur due to noise. In
26 20 40 8 3 25.00 4.35 this case hydrolysis temperature and pH were highly
27 30 50 10 4 62.69 0.40 significant model terms with p-values of < 0.0001 and
28 10 50 10 2 59.62 0.44 0.0003. For the reduced model, we found R2=0.8726
29 10 70 10 2 51.54 2.31 showing that the model gives a satisfactory fit to the
30 20 60 12 3 52.69 2.17 experimental data. The following reduced quadratic
model in terms of tested fermentation parameters was
However, p-values of hydrolysis time and enzyme achieved as shown in equation (5).
concentration were insignificant (p=0.2569 and 0.7740).
DH = - 840.53 + (3.79*Time) + (20.97*Temp) + (56.70*pH) +
Results from the interaction terms between hydrolysis (0.02*Time*Temp) – (0.05*Time*pH) - (0.25*Temp*pH) –
time and temperature, time and pH, time and (0.08*Time2) - (0.16* Temp2) – (2.36* pH2) (5)
concentration were not significant with the p-values,
0.6065, 0.7796 and 0.6728, respectively as well as other
3E3S Web of Conferences 302, 02007 (2021) https://doi.org/10.1051/e3sconf/202130202007
RI²C 2021
Table 4. ANOVA of enzymatic hydrolysis of fish protein presented in Figure1B, the DH gradually increased with
affected by condition parameters for reduce quadratic equation. the increasing pH from 6 to 8.5. The obtained results
agreed with the nature of enzyme activity of commercial
Source Sum of df Mean F Value p-value
Alcalase® which normally active between pH 6.5 and
Squares Square Prob > F
8.5. As a further increase in pH up to 10, the DH
Model
1425.49 9 1579.5 11.57 < 0.0001
gradually decreased within the time range of 10-30 min.
However, the DH gradually increased to a plateau
A-Time
371.15 1 371.15 2.72 0.1148 between 25 to 30 min reaction time resulting in the DH
raised from 60% to 85% as in Fig.2A. The longer
B-Temp 6836.00 1 6836.00 50.08 < 0.0001 reaction time would allow Alcalase to act more
C-pH 2664.31 1 2664.31 19.52 0.0003 extensively on the fish muscle, thus resulting in an
AB 47.99 1 47.99 0.35 0.5599 increment in the DH as previously reported by Haslaniza
AC 14.08 1 14.08 0.10 0.7514 et al., 2010 [27].
BC 407.54 1 407.54 2.99 0.0994
2
A 1870.56 1 1870.56 13.70 0.0014
B2 7047.31 1 7047.31 51.63 < 0.0001
C2 2499.01 1 2499.01 18.31 0.0004
Residual 2729.82 20 136.49
Cor Total 16945.31 29
Results found that DH of FSH production was
significantly influenced by temperature and pH. Our
relationship of fish waste hydrolysis is well in agreement
with the previous studies reported a quadratic model for
production of protein hydrolysate [18, 25].
3.2 Optimization of FSH condition
From the optimization analysis of Alcalase hydrolysis to
produce FPH, the suggested optimum levels of all the
variables determined by the quadratic model of CCD in
this study to obtained 89.42% DH were 2.85%v/w
Alcalase concentration at pH 8.48 for 27.18 minutes of
hydrolysis time as 61°C. In terms of pH and
temperature, the results in this present study are in
accordance with the results of study of Yuan et al., 2008
[18] showing Alcalase 2.4 L exhibited the highest values
in terms of DH when optimum temperature at 60 0C, pH
8.0 with high protein yield up to 80.33%. Figure 1 shows Fig.1. The 3-D surface plot of interaction between the
the respective response surface plots (3-D). These plots parameters on degree of hydrolysis, (A) temperature and time,
illustrate the significant interaction of the two (B) pH and time.
independent variables to determine the optimum
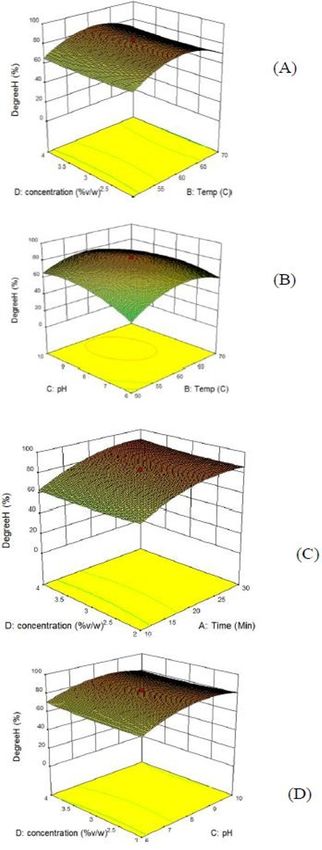
conditions for enzymatic hydrolysis in this study. However, the prolonging the reaction time beyond
Figure1A shows the effect of temperature and reaction 25 min, no significant increase in DH occurred. Based
time on DH. Results showed DH increased as time and on the obtained results, 27 min was selected as the
temperature increased. When the reaction temperature suitable reaction time. The effect of pH and hydrolysis
increased from 500C to 60 0C, the DH significantly temperature on DH was shown in Fig. 2B, the DH was
increased from 20% to 89%. increased 25% to 89% as the pH increased from 6 to 8.5.
The reaction temperature has a significantly impact However, by further increasing pH to 10, an obvious
on the DH of this mixed fish species. However, by decrease in the DH was detected once temperature
further increasing the reaction temperature to 700C, a exceed to 70 0C. The effect of enzyme concentration on
decline in the DH observed. The reduction in the DH the DH displayed in Fig.2C. The DH of hydrolysates
possibly resulted from the thermal denaturation of was insignificantly (p=0.7740) increased when enzyme
enzyme increased since the reaction shifted out from the concentration was increased from 2.0% to 4.0% at a
optimum temperature, thus leading to a decrease in the fixed temperature. As temperature gradually increased
DH. In this production, 610C was chosen as the optimum from 50 to 60 0C at 2% enzyme concentration, pH 6.0
reaction temperature once all other influential parameters resulting in the DH raised from 48% to 73 %. However,
were kept in the ranges. Our results agree with by extending the reaction temperature to 70 0C, a decline
Vannabun et al., 2014 [26] who characterized alkaline in the DH was observed. The influence of enzyme
protease with optimal temperature at 600C for hydrolysis concentration and pH change on the DH accessed within
the viscera of farmed giant catfish. From the result the same range as previously discussed and the results
4E3S Web of Conferences 302, 02007 (2021) https://doi.org/10.1051/e3sconf/202130202007
RI²C 2021
displayed in Fig 2D.Results showed that the DH was 3.3 Validation the CCD model of FPH
slightly increased from 70 to 83% when pH gradually
increased from 6 to 8.5 and slightly decreased to 79% In order to validate the statistical optimization of
when the pH reach to 10. hydrolysis conditions of Alcalase on mixed fish towards
degree of hydrolysis using response surface design. The
validation experiments for confirming the adequacy of
model was attempted for the accuracy of the model. The
validation of the model performed under the optimum
conditions in triplicate and found good agreement of DH
as 78.27% obtained from the model prediction value of
89.42%. The difference between the predicted and
experimental value was 11.16%. The difference of DH
was a little higher than 10% enough to justify the
validity of the response model with the high degree of
accuracy leading to the hydrolysis yield.
3.4 Criteria of bioprocess operation
FSH production in this study can be manipulated the
condition according to the criteria of process in terms of
reaction speed, operation temperature, pH and enzyme
concentration in order to obtain the desired product
under the constrain condition or lowest operation cost
[28]. We would suggest the following conditions to
produce the FPH to make the hydrolysis process more
controllable as the following four conditions. Firstly, in
order to minimize the hydrolysis time and maximize
degree of hydrolysis while temperature, pH and enzyme
concentration kept in range of this experiment, the FPH
production could be carried out at 65.58% DH using
3.74% v/w of enzyme concentration at 59.720C, pH 8.72
for 10 min. Secondly, an alternative process can be done
if the consideration focus on minimizing the hydrolysis
temperature and maximization of degree of hydrolysis
while pH, enzyme concentration and time were kept in
range of this study. FSH can be produced with 71.73%
DH by using 2.38% v/w of enzyme concentration at 50
0
C, pH 9.08 for 25.86 min. Thirdly, to minimize the pH
and maximize DH with maintaining time, temperature
and enzyme concentration in range of this study, the
FPH production could run to obtain 75.53% DH using
2.90% v/w of enzyme at 62.88 0C, pH 6.00 for 28.09
min. For final option of operation process, it required
3.15% v/w of enzyme loading at 60.83 0C, pH 8.49 for
27.18 min of operation time. This option would resulting
in the DH of 89.42 %.
3.5 Proximate composition
Result of proximate analysis revealed that protein
content was relatively the same between FSH (87.11%)
and dry weight powder of mixed fish raw material
(87.11%) as depicted in Table 5. The freezed-dried FSH
produced from this experiment was a brownish powder
with fishy smell. The hydrolytic process of minced fish
raw material by enzyme could generate molecules
ranging from smaller proteins, peptides and individual
amino acid. This FSH was then characterized molecular
Fig.2. The 3-D surface plot (A) enzyme concentration and distribution through the sequential membrane filtration.
time, (B) pH and hydrolysis temperature, (C) enzyme Result showed the smaller size proteins in range of 30–
concentration and temperature and (D) enzyme concentration
100, 10–30, 5–10, 3–5, 1–3 andE3S Web of Conferences 302, 02007 (2021) https://doi.org/10.1051/e3sconf/202130202007
RI²C 2021
FSH especiallyE3S Web of Conferences 302, 02007 (2021) https://doi.org/10.1051/e3sconf/202130202007
RI²C 2021
the RSM model prediction. Four alternative conditions antioxidant activities and applications: a review,
through RSM approach of optimization have a promising Food Chemistry, 135 (2012): 3020–3038
for FPH production in the future. In addition, the 5. M. Chalamaiah, W. Yu, J. Wu,
potential of this improved approach in the present study Immunomodulatory and anticancer protein
is affording a method for the efficiency of production hydrolysates (peptides) from food proteins: A
process, which may be beneficial for reducing enzymatic review, Food Chemistry, 245 (2017): 205–222
loading and hydrolysis temperature leading to reduction 6. P.J. García-Moreno, I. Batista, C. Pires, N. M.
of raw material for production and energy costs. The Bandarra, F. J. Espejo-Carpio, A. Guadix, and E.M.
implementation of optimization report is appropriate for Guadix, Antioxidant activity of protein
FPH in pilot scale and further study of bioactive hydrolysates obtained from discarded
compounds in feed and nutraceutical application. Mediterranean fish species, Food Research
International, 65 (2014): 469-476
Table 7. Amino acid composition comparison 7. N.A. Zakaria, N.M. Sarbon, Physicochemical
Feed ingredients (g/kg total amino acids) properties and oxidative stability of fish emulsion
Amino acid Fish Fish Soybean
protein meala mealb sausage as influenced by snakehead (Channa
hydrolysate striata) protein hydrolysate, Lebensmittel-
Arginine 42.7 65.4 81.3 Wissenschaft & Technologie, 94 (2018): 13-19
Histidine 22.5 19.5 33.7 8. O. Villamil, H. Váquiro, J. F. Solanilla, Fish
Isoleucine 22.4 34.6 39.7 viscera protein hydrolysates: Production, potential
Leucine 47.2 77.7 75.9 applications on functional and bioactive properties,
Lysine 55.5 101.7 30.5
Methionine 19.5 44.6 8.6
Food Chemistry, 224 (2017):160-171
Phenylalanine 24.7 39.8 79.2 9. A. Noman, Y. Xu, W. Q., AL-Bukhaiti, S. M.,
Threonine 31.5 44.4 40.4 Abed, A. H., Ali, A. H., Ramadhan, W. Xia,
Tryptophan1 ND ND ND Influence of enzymatic hydrolysis conditions on the
Valine 26.6 46.6 43.6 degree of hydrolysis and functional properties of
∑EAA 292.6 474.3 432.9
protein hydrolysate obtained from Chinese sturgeon
Alanine 43.5 65.2 43.6
Aspartic acid 62.1 103.9 109.7 (Acipenser sinensis) by using papain enzyme,
Glutamic acid 102.6 154.2 182.5 Process Biochemistry, 67 (2018): 19-28
Glycine 37.4 66 57.9 10. F. Alavi, M. Jamshidian, K. Rezaei, Applying
Proline 0 50.4 64 native proteases from melon to hydrolyze kilka fish
Serine 27.1 48.5 52.4 proteins (Clupeonella cultriventris caspia)
Tyrosine 0 37.6 57
∑NEAA 15.8 525.8 567.1
compared to commercial enzyme Alcalase, Food
a,bAmino acid composition of principle protein ingredients in Chemistry, 277 (2019): 314-322
the diets from Swanepoel and Goosen, 2011[30] 11. M.S. Benhabiles, N. Abdi, N. Drouiche, H.
Lounici, A. Pauss, M.F.A. Goosen, N. Mameri,
Fish protein hydrolysate production from sardine
Acknowledgement solid waste by crude pepsin enzymatic hydrolysis
in a bioreactor coupled to an ultrafiltration unit,
Author are indebted to a financial grant from KMUTNB-GOV- Materials Science and Engineering: C, 32 (2012):
59-35.The author also would like to thank INTEQC Group., Co 922-928
Ltd, Thailand for raw material and initiation to implement the
12. O. Villamil, H. Váquiro, J. F. Solanilla, Fish
fish protein hydrolysate production.
viscera protein hydrolysates: Production, potential
References applications and functional and bioactive
properties, Food Chemistry, 24 (2017): 160-171
1. I. Richter, J. Thøgersen, C.A. Klöckner, 13. N.R.A. Halim, H.M. Yusof, N.M. Sarbon,
Sustainable seafood consumption in action : Functional and bioactive properties of fish protein
relevant behaviors and their predictors, hydolysates and peptides: A comprehensive review,
Sustainability, 9 (2017): 1-19 Trends in Food Science and Technology, 51
2. S. I. Aspmo, S. J. Horn, V. G.H. Eijsink, (2016): 24-33
Hydrolysates from Atlantic cod (Gadus morhua L.) 14. H.C. Tran, H.A.T. Le, T.T. Le, V.M. Phan, Effects
viscera as components of microbial growth media, of enzyme types and extraction conditions on
Process Biochemistry, 40 (2005): 3714-3722 protein recovery and antioxidant properties of
3. O. Martínez-Alvarez, S. Chamorro, A. Brenes, hydrolysed proteins derived from defatted Lemna
Protein hydrolysates from animal processing by- minor, Applied Science and Engineering Progress,
products as a source of bioactive molecules with (2021) doi: 10.14416/j.asep.2021.05.003
interest in animal feeding: A review, Food
Research International, 73 (2015): 204-212 15. T. Aspevik, H. Egede-Nissen, Ĺ. Oterhals, A
4. M. Chalamaiah, B. Dinesh Kumar, R. Hemalatha, systematic approach to the comparison of cost
T. Jyothirmayi, Fish protein hydrolysates: efficiency of endopeptidases for the hydrolysis of
proximate composition, amino acid composition, Atlantic salmon (Salmo salar) by-products. Faculty
of Food Technology and Biotechnology. 54 (2016):
421-431
7E3S Web of Conferences 302, 02007 (2021) https://doi.org/10.1051/e3sconf/202130202007
RI²C 2021
16. A.M. Liceaga-Gesualdo, E.C.Y Li-Chan, 27. H. Haslaniza, M.Y. Maskat, W.M. Wan Aida, S.
Functional properties of fish protein hydrolysate Mamot, The effects of enzyme concentration,
from Herring (Clupea harengus). Journal of Food temperature and incubation time on nitrogen
Science, 64 (1999): 1000-1004 content and degree of hydrolysis of protein
17. H.G. Kristinsson, B.A. Rasco, Fish protein precipitate from cockle (Anadara granosa) meat
hydrolysates: Production, biochemical and wash water, International Food Research Journal,
functional properties. Critical Reviews in Food International Food Research Journal, 17 (2010):
Science and Nutrition, 40 (2000): 43-81 147-152
18. X. Yuan, X. Gu, J. Tang, Optimization of the 28. V.Venugopal, Enzymes from seafood processing
production of Momordica charantia L. Var. waste and their applications in seafood processing,
abbreviata Ser. protein hydrolysates with in Advances in Food and Nutrition Research, S.-K.
hypoglycemic effect using Alcalase, Food Kim and F. Toldrá, Academic Press, 78 (2016): 47-
Chemistry, 111 (2008): 340-344 69
19. T. P. Singh, R. A. Siddiqi, D. S. Sogi, Statistical 29. FAO/WHO, Energy and protein requirements,
optimization of enzymatic hydrolysis of rice bran Report of joint FAO/WHO/UNU Expert
protein concentrate for enhanced hydrolysate Consultation Technical Report. FAO/WHO and
production by papain, Lebensmittel-Wissenschaft United Nations University, Geneva, 724 (1985):
& Technologie, 99 (2019): 77-83 116-129
20. D. Betancur-Ancona, R. Martinez-Rosado, A. 30. NRC National Research Council, Nutrient
Corona-Cruz, A. Castellanos-Ruelas, M.E. Requirement of Fish, National Academy of
Jaramillo-Flores, L. Chel-Guerrero, Functional Science Washington, (1993): 124.
properties of hydrolysates from Phaseolus lunatus 31. J.C. Swanepoel, N.J. Goosen, Evaluation of fish
seeds, International Journal of Food Science and protein hydrolysates in juvenile African catfish
Technology, 44 (2009): 128-137 (Clarias gariepinus) diets, Aquaculture, 496 (2018):
21. N. Bhaskar, T. Benila, C. Radha, R.G. Lalitha, 262–269
Optimization of enzymatic hydrolysis of visceral 32. S. MacKenzie, Recent developments in amino acid
waste proteins of Catla (Catla catla) for preparing analysis by gas-liquid chromatography, in Methods
protein hydrolysate using a commercial protease, of biochemical analysis, D. Glick, Ed. John Wiley
Bioresource Technology, 99 (2008): 335-343 and Sons, 27 (2009): 1-88
22. K. Zhang, B. Zhang, B. Chen, L. Jing, Z. Zhu, K. 33. S. Benjakul, M.T. Morrissey, Protein hydrolysates
Kazemi, Modeling and optimization of from pacific whiting solid wastes, Agricultural and
Newfoundland shrimp waste hydrolysis for Food Chemistry, 45 (1997): 3423-3430
microbial growth using response surface 34. S.F. See, L.L. Hoo, A.S. Babji, Optimization of
methodology and artificial neural networks, Marine enzymatic hydrolysis of Salmon (Salmo salar) skin
Pollution Bulletin, 109 (2016): 245-252 by Alcalase, International Food research, 18
23. J. Adler-Nissan, Determination of the degree of (2011): 1359-1365
hydrolysis of food proteins hydrolysates by 35. H. Yin, J. Pu, Y. Wan, B. Xiang, P.J. Bechtel, S.
Trinitrobenzenesulfonic acid, Journal of Sathivel, Rheological and functional properties of
Agricultural and Food Chemistry, 27 (1979):1256- Catfish skin protein hydrolysates, Journal of Food
1262 Science, 75, 1 (2010): E11-E17
24. N. Wisuthiphaet, S. Klinchan, S. Kongruang, Fish 36. S.A., Santos, V.G. Martins, M. Salas-Mellado, C.
Protein Hydrolysate Production by Acid and Prentice, Evaluation of functional properties in
Enzymatic Hydrolysis, Applied Science and protein hydrolysates from Bluewing Searobin
Engineering Progress, 9 (2016): 261–270 (Prionotus punctatus) obtained with different
microbial enzymes, Food and Bioprocess
25. M.A. Amiza, S. Nurul Ashikin, A.L. Faazaz, Technology, 4 (2011): 1399–1406
Optimization of enzymatic protein hydrolysis from 37. L. You, M. Zhao, J. M. Regenstein, and J. Ren, In
silver catfish (Pangasius sp.) Frame, International vitro antioxidant activity and in vivo anti-fatigue
Food Research Journal, 18 (2011): 775-781 effect of loach (Misgurnus anguillicaudatus)
26. A. Vannabun, S. Ketnawa, S. Phongthai, S. Benjakul, peptides prepared by papain digestion, Food
S. Rawdkuen, Characterization of acid and alkaline Chemistry, 124 (2011): 188-194
proteases from viscera of farmed giant catfish, 38. M. Watford, Glutamine and glutamate:
Food Bioscience, 6 (2014): 9-16 Nonessential or essential amino acids?” Animal
Nutrition, 1 (2015): 119-122
8You can also read