Reply to Kroll and Schmid-Beurmann's comment on "Water decreases displacive phase transition temperature in alkali feldspar" by Liu et al. (2018) ...
←
→
Page content transcription
If your browser does not render page correctly, please read the page content below
Eur. J. Mineral., 32, 305–310, 2020
https://doi.org/10.5194/ejm-32-305-2020
© Author(s) 2020. This work is distributed under
the Creative Commons Attribution 4.0 License.

       Reply to Kroll and Schmid-Beurmann’s comment on “Water
        decreases displacive phase transition temperature in alkali
                       feldspar” by Liu et al. (2018)
                                          Wendi Liu, Yan Yang, and Qunke Xia
       Institute of Geology and Geophysics, School of Earth Sciences, Zhejiang University, Hangzhou 310008, China
                                  Correspondence: Yan Yang (yanyang2005@zju.edu.cn)
             Received: 26 November 2019 – Revised: 23 April 2020 – Accepted: 24 April 2020 – Published: 15 May 2020

       Abstract. It has long been known that hydrogen impurities can be incorporated in the structure of nominally
       anhydrous minerals (NAMs) and substantially influence their physical properties. One of the geologically most
       prominent NAMs is feldspar. The hydrogen concentration in NAMs is usually expressed in parts per million
       of water by weight (ppm H2 O wt.) In this paper, we use the term “hydrogen” for uniformity, except when we
       use “water” for describing its amount expressed as parts per million of H2 O by weight. In our article (Liu et
       al., 2018), we carried out in situ high-temperature X-ray powder diffraction and Raman spectroscopic stud-
       ies on three natural anorthoclase samples with similar Or (K-feldspar) contents (Ab67 Or31 An2 , Ab66 Or31 An2 ,
       and Ab65 Or33 An3 ) and Al–Si disordering but contrasting water contents. The spectroscopic results suggested
       that the displacive phase transition temperature is higher for the nearly anhydrous anorthoclase sample than the
       anorthoclase samples with about 200 ppm water, and we thus concluded that hydrogen is another factor im-
       pacting the displacive phase transition temperature. We thank Kroll and Schmid-Beurmann for pointing out the
       weakness in our interpretation that hydrogen is a possible important factor (Kroll and Schmid-Beurmann, 2020).
       To clarify this issue, we conducted transmission electron microscopy (TEM) experiments on the three samples
       to check texture effects. The TEM studies indicated that the nearly anhydrous anorthoclase sample consists of
       two feldspar phases, a K-poor and a K-rich one, and that the K-poor area may be responsible for the higher
       displacive phase transition temperature. According to the observation that the temperature of redistribution of
       hydrogen is accordant with the displacive phase transition temperature, the effect of hydrogen could not be ruled
       out. Based on these results, it can be concluded that hydrogen may not be the sole possible factor, and it was
       a proposition more than a definitive proof for the moment. Natural feldspars are complex, and factors affecting
       displacive phase transitions are multiple (e.g., Salje et al., 1991; Harrison and Salje, 1994; Hayward and Salje,
       1996; Dobrovolsky et al., 2017). Therefore, to further investigate hydrogen effects on displacive phase transi-
       tion in feldspar, synthetic samples with pure chemical compositions and hydrogen species are necessary. In the
       following, we address each issue in the same order as in the comment by Kroll and Schmidt-Beurmann (2020).

1   Reply to critique by Kroll and Schmid-Beurmann                the general relationship has to be clarified. The samples used
                                                                  in that study have similar Or content and Al–Si disordering;
Point (1): We have never denied the general relationship be-      thus, the deviation of sample no. 1 from the general relation-
tween Or content and displacive phase transition temperature      ship indicates that there should be other factors. It is worth
in Liu et al. (2018). However, the Tc value of anorthoclase       noting that water content in sample no. 1 is distinctly differ-
does not match with its Or content perfectly, especially when     ent to that in the other two samples (60 % and 70 % lower
the Or content is out of the range from 2 % to 30 % (Fig. 1).     than the other two). In addition, the displacive phase tran-
Thus, there is no reason to exclude other existing factors,       sition occurs coincidentally at the temperature of hydrogen
and the deviation of sample no. 1 in Liu et al. (2018) from       redistribution. Based on these two facts, Liu et al. (2018) as-

Published by Copernicus Publications on behalf of the European mineralogical societies DMG, SEM, SIMP & SFMC.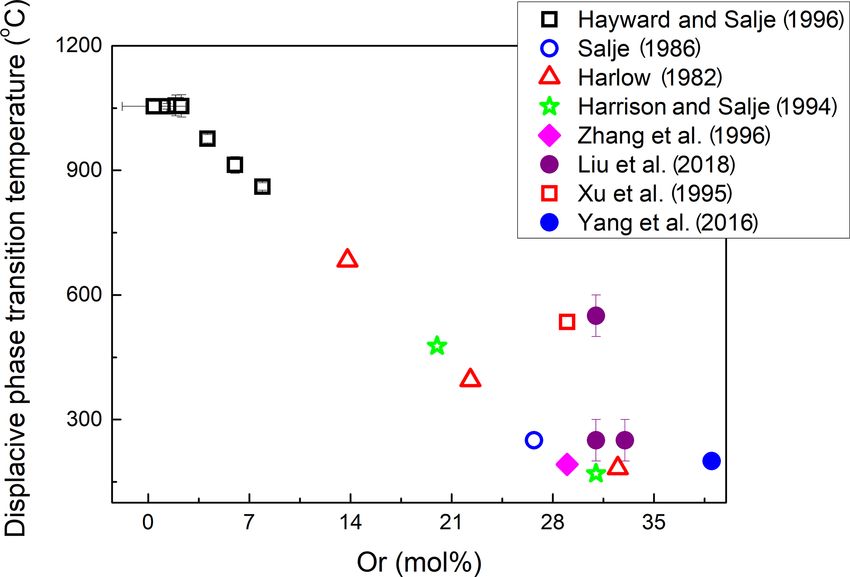
306                                                            W. Liu et al.: Reply to Kroll and Schmid-Beurmann’s comment

                                                                        Point (2): The limitation of FTIR calibration seem to be ig-
                                                                     nored by Kroll and Schmid-Beurmann (2020). Hydrogen is
                                                                     incorporated via point defects in nominally anhydrous miner-
                                                                     als. FTIR spectroscopy is widely used to detect trace amounts
                                                                     of water in nominally anhydrous minerals. About 30 % rep-
                                                                     resents the uncertainty of the calibration process using FTIR
                                                                     for quantitative analyses, which is inevitable due to the un-
                                                                     certainties from sample thickness, baseline correction, ab-
                                                                     sorption coefficient, etc. (Demouchy and Bolfan-Casanova,
                                                                     2018). However, it does not change the conclusion that wa-
                                                                     ter content of sample no. 1 is much different (60 % and 70 %
                                                                     lower) from that of sample no. 2 and sample no. 3. Further-
                                                                     more, despite the inevitable uncertainty in calculating water
                                                                     content using FTIR, the distinctly different water contents of
Figure 1. Relationship between displacive phase transition temper-   sample no. 1 from the other two samples can be obviously
ature in anorthoclase and Or content.                                observed from their absorbances in the IR spectra (Fig. 1 in
                                                                     Liu et al. 2018). In contrast, the water contents of sample
                                                                     nos. 2 and 3 (with 20 % difference) can be considered within
cribed the observed deviation from the relationship between          the uncertainties as being on the same level, which may ac-
Or content and displacive transition temperature to hydrogen         count for their similar transition temperature.
effects at the time.                                                    Point (3): We thank the authors for the notice of wrongly
   Hydrogen species in feldspar are very complex. There are          citing the transition temperatures. We have quoted the cor-
at least five types of hydrogen species in feldspar: type I          rect transition temperatures (183, 395, 683 ◦ C) from Har-
H2 O, type II H2 O, type I OH, type IIa OH, and type IIb OH,         low (1982) in Fig. 1. The correlation is much better in the
which can be distinguished from each other through Fourier           revised Fig. 1 with R 2 = 0.90 instead of R 2 = 0.68 in Fig. 9a
transform infrared (FTIR) spectra (Johnson and Rossman,              in Liu et al. (2018). We also added more data from previ-
2004). Even feldspars of similar composition and structural          ous references (Salje, 1986; Harrison and Salje, 1994; Xu et
state may have different hydrogen species (Hofmeister and            al., 1995; Hayward and Salje, 1996) in Fig. 1 than those in
Rossman, 1985; Beran, 1986; Shuai and Yang, 2017). Fur-              Fig. 9a in Liu et al. (2018). Table 1 lists the data shown in
thermore, different hydrogen species locate in different sites       Fig. 1. The different behavior of sample no. 1 can clearly be
in the structure (e.g., Johnson and Rossman, 2004; Hamada            seen in Fig. 1. Obviously, the general relationship between
et al., 2013) and have different mobility (Kronenberg et al.,        displacive phase transition and Or content exists. However,
1996; Johnson and Rossman, 2013). Thus, different hydro-             there are exceptions. As shown in Fig. 1, in addition to the
gen species may have different impacts on the displacive             fact that this relationship does not exist when the Or content
phase transition in feldspar. Since hydrogen species in those        is lower than 2 % (Hayward and Salje, 1996), the relationship
samples (hydrothermally synthesized or prepared from an-             is less apparent when the Or content is higher than 30 %.
nealing) mentioned by Kroll and Schmid-Beurmann (2020)                  In addition, it should be noted that the equation sug-
are unclear, hydrogen effects on the displacive phase transi-        gested by Kroll et al. (1980) is derived from synthetic alkali
tion could not be commented on. In contrast, the three sam-          feldspars of Or40 Ab60 −Or0 Ab100 and several natural alkali
ples used in Liu et al. (2018) are anorthoclases with the type       feldspar samples (in their Fig. 8). It is not clear whether the
IIa OH. Although the hydrogen site of the type IIa OH in             equation reported by Kroll et al. (1980) is universal and suit-
the crystal structure is still unclear, it is generally expected     able for all the complex natural chemical compositions pos-
that multiple hydrogen sites with a range of hydrogen bond           sible.
distances are involved (Johnson and Rossman, 2004). This                Point (4): It is unknown whether the relationship be-
type IIa OH will experience hydrogen redistribution from the         tween Or content and unit cell volume suggested by Kroll
site with stronger hydrogen bonding to the site with weaker          et al. (1986) is universal. The Or content of the anorthoclase
hydrogen bonding with increasing temperature, and the dis-           reported by Yang et al. (2016) is 39 rather than 41, and it
placive phase transition occurs coincidentally at the temper-        has been displayed in Fig. 1 in this paper. The X-ray diffrac-
ature of hydrogen redistribution (Fig. 4 in Liu et al., 2018).       tion (XRD) results have demonstrated that it is triclinic at
The redistribution of hydrogen among sites has also been ob-         ambient conditions (Yang et al., 2016). The chemical com-
served during pressure-induced displacive phase transition in        positions of our samples are obtained from electron probe
clinoenstatite and stishovite (Jacobsen et al., 2010; Nisr et al.,   microanalyzer (EPMA). We used natural crystals of albite,
2017), and it is suggested to have an effect on the displacive       rhodonite, plagioclase, orthoclase, pyrope, almandine, anhy-
phase transition in stishovite (Umemoto et al., 2016).               dride, and benitoite as standards. For EPMA data correction,
                                                                     a program based on the ZAE3 procedure was applied. We

Eur. J. Mineral., 32, 305–310, 2020                                                    https://doi.org/10.5194/ejm-32-305-2020
W. Liu et al.: Reply to Kroll and Schmid-Beurmann’s comment 307
Table 1. The data of displacive phase transition temperature of anorthoclase with different Or contents from the literature. The errors
unreported in those references are listed as zero here. For the transition temperature of anorthoclase from Xu et al. (1995), it was suggested
to lie between 535 and 440 ◦ C characterized by the structural variations during heating and cooling, respectively. Thus, we here cited the
critical temperature of 535 ◦ C for comparison with our data of heating experiments.
Or content Error Displacive phase transition Error
Number (mol%) (mol%) temperature (◦ C) (◦ C) Reference
1 0.4 0.0 1054 12 Hayward and Salje (1996)
2 1.3 0.0 1054 7 Hayward and Salje (1996)
3 1.9 0.0 1056 25 Hayward and Salje (1996)
4 2.3 0.0 1055 27 Hayward and Salje (1996)
5 4.1 0.0 976 10 Hayward and Salje (1996)
6 6.0 0.0 913 20 Hayward and Salje (1996)
7 7.9 0.0 861 9 Hayward and Salje (1996)
8 26.7 2.2 250 0 Salje (1986)
9 32.5 0.0 183 0 Harlow (1982)
10 22.3 0.0 395 0 Harlow (1982)
11 13.8 0.0 683 0 Harlow (1982)
12 31.0 0.0 170 0 Harrison and Salje (1994)
13 20.0 0.0 477 0 Harrison and Salje (1994)
14 29.0 0.0 192 0 Zhang et al. (1996)
15 31.0 0.0 550 50 Liu et al. (2018)
16 31.0 0.0 250 50 Liu et al. (2018)
17 33.0 0.0 250 50 Liu et al. (2018)
18 29.0 0.0 535 0 Xu et al. (1995)
19 39.0 0.0 200 0 Yang et al. (2016)
carried out multipoint measurements to improve the accu- lutions of the three cell edge lengths of sample nos. 2 and 3
racy. The total standard deviation is less than 0.3 %. Thus, for are less unapparent than those of sample no. 1 (Fig. 6 in Liu
determination of chemical compositions of minerals, EPMA et al., 2018). Therefore, variations in thermal expansion coef-
with good standards and procedures is more convincing than ficients of the three axes accompanied by the symmetry tran-
XRD. Additionally, the calculation of Or content from XRD sition are larger for sample no. 1 than the other two. There-
parameters raises more questions than it solves. It shifts the fore, variations in thermal expansion coefficients of the three
sample in Yang et al. (2016) by more than 20 Or components, axes accompanied by the symmetry transition are larger for
which is unrealistic and put the data point completely out of sample no. 1 than the other two.
the curves deduced from Kroll et al. (1980). Points (7), (8) and (9): The XRD pattern of sample no. 1 at
Point (5): Kroll and Schmid-Beurmann argued that γ ambient conditions is indeed different from those of the other
ranges from 90.1 to 90.2◦ based on An-poor anorthoclases two samples. It has been reported that incorporated hydrogen
(Or20-30) from references. The XRD results of sample no. 1 can change the symmetry of the host mineral (e.g., Smyth et
are really different from those of the other two. We attributed al., 1997). Although water contents in the samples in Liu et
this particular behavior to different water content of sample al. (2018) are not high enough to change the symmetry of the
no. 1 from the other two samples, but we agree that other starting samples, the difference of the XRD patterns between
parameters can influence it, even texture effects. See the fol- sample no. 1 and the other two may be ascribed to different
lowing part about TEM results. water contents, but other parameters such as texture can also
Point (6): Figure 6 in Liu et al. (2018) shows the evo- play a role. See the following part about TEM results.
lutions of cell edge lengths of the three samples with in- The best matched space groups were chosen by comparing
creasing temperature. The unit cell edges of sample nos. 1, diffractograms of anorthoclases with corresponding entries
2, and 3 expand with increasing temperature, with discon- in an existing database of powder diffraction files (PDFs)
tinuities around their transition temperatures. However, the from 2004 in the software Jade 5. The cell parameters were
discontinuities do not occur coincidently for each edge of refined meticulously, and peaks were fitted with the reflection
the three samples. We are also confused about the inconsis- as precisely as possible. With regards to the reflections, about
tent behavior of the cell edges. It may be caused by the fact 40–50 reflections have been used in many previous studies
that the displacive phase transition has a weaker impact on (Harlow, 1982; Hayward and Salje, 1996; Angel et al., 2013).
cell edge lengths than on cell angles. Actually, the turning Angel et al. (2013) emphasized that no significant deviations
points at displacive phase transition temperature of the evo- were found in triclinic structure when the unit cell parameters
https://doi.org/10.5194/ejm-32-305-2020 Eur. J. Mineral., 32, 305–310, 2020308 W. Liu et al.: Reply to Kroll and Schmid-Beurmann’s comment
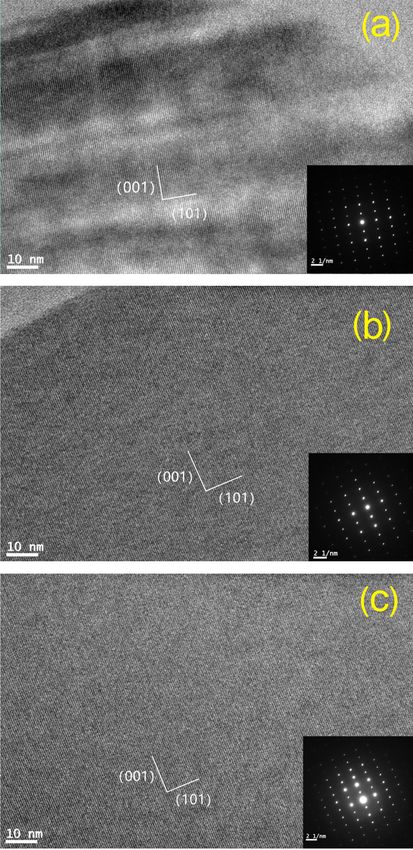
Figure 3. (a) High-resolution TEM diffractions and images of the
sample no. 1, showing the wavelike lattice fringes. The heteroge-
neous dark and bright parts may represent the K-rich and K-poor
Figure 2. XRD patterns of the three samples at elevated tempera- phases. (b) High-resolution TEM diffractions and images of sam-
tures with arrows indicating displacive phase transition. ple no. 2. No apparent texture effect was found. (c) High-resolution
TEM diffractions and images of sample no. 3. No apparent texture
effect was found.
were determined from 43 reflections. We admit that we did
not use an internal standard to eliminate systematic errors. agree with Kroll and Schmid-Beurmann (2020) that an inter-
But even with possibly inaccurate cell parameters obtained, nal standard should be applied to eliminate systematic errors
the displacive phase transition temperatures can also be de- and obtain accurate lattice parameters. But in this study, it
termined from variations in the XRD patterns (Fig. 2). Fig- will not change the main conclusions.
ure 2 shows the evolutions of XRD peaks in the three samples
at elevated temperatures up to 800 ◦ C. The variations can be
observed as the arrows. For sample no. 1, the peaks are sep- 2 TEM results
arated in the low-temperature phase whereas the peaks coa-
lesce at 600 ◦ C, corresponding to the phase transition from To check if there are any texture effects, we carried out
triclinic to monoclinic symmetry (Henderson, 1979; Harri- TEM measurements on the three anorthoclase samples. A
son et al., 1994). Similarly, the peaks coalesce at 200 ◦ C for FEI Quanta 3D FEG focused-ion-beam device was used for
sample nos. 2 and 3 with higher water contents. Anyway, we TEM sample preparation. The samples were cut into slices
Eur. J. Mineral., 32, 305–310, 2020 https://doi.org/10.5194/ejm-32-305-2020W. Liu et al.: Reply to Kroll and Schmid-Beurmann’s comment 309
around 10 µm × 2 µm along the similar direction, and stuck be responsible for the higher transition temperature. On the
on the Cu grid. Ion milling was operated for obtaining the other hand, the temperature of hydrogen redistribution is in
electron-transparent area with a thickness of around 100 nm. agreement with the displacive phase transition temperature
The TEM investigations were performed with a FEI Tecnai for sample nos. 2 and 3; thus, the effect of hydrogen cannot
G2 F20 S-TWIN TEM instrument operated at 200 kV. Since be ruled out. To further understand this effect, experiments
the samples became amorphous under the treatment of the and characterizations on synthetic samples with end-member
electron beam, all the images were collected quickly. compositions and hydrogen-bearing lattice are necessary.
It is evident that the TEM images of sample no. 1 are dif-
ferent from those of sample nos. 2 and 3. For sample no. 1
(Fig. 3a), there are apparent wavelike images as observed in Data availability. All figures and tables pre-
Xu et al. (1995). Xu et al. (1995) have suggested that the sented in this manuscript are available at figshare
wavelike (001) lattice fringes were thermodynamically un- https://doi.org/10.6084/m9.figshare.12275498 (Liu et al., 2020).
stable modulated structures whose symmetry was between
monoclinic and triclinic. Comparatively, the TEM images of
sample nos. 2 and 3 under high magnification are homoge- Author contributions. WL contributed to the experiments and data
analysis. YY worked on the manuscript with all authors.
neous. No apparent texture effect was found (Fig. 3b and c).
Therefore, the heterogeneous dark and bright parts may rep-
resent two phases existing in sample no. 1: the K-rich and K-
Competing interests. The authors declare that they have no conflict
poor phases. The K-poor areas will see transition at a higher of interest.
temperature like in Xu et al. (1995), and the K-rich areas will
see transition at much lower temperatures. Although the three
samples are all megacrysts hosted in Cenozoic basalt from Acknowledgements. The authors would like to thank the two re-
the same locality, they may experience temperature decrease viewers for their detailed and constructive comments and sugges-
at different rates. Sample no. 1 may experience a slower tions. Monika Koch-Müller and Patrick Cordier are warmly thanked
temperature decrease than the two others during eruption, for handling the manuscript.
thereby inducing the start of composition modulation. The
different temperature decrease rates can also explain the dif-
ferent water contents between the three samples. The lower Review statement. This paper was edited by Monika Koch-Müller
water content of sample no. 1 may be caused by late de- and reviewed by Reinhard X. Fischer and one anonymous referee.
gassing, while sample nos. 2 and 3 can better preserve their
water contents during their fast eruption.
References
3 Conclusion
Angel, R. J., Ross, N. L., Zhao, J., Sochalski-kolbus L., Kruger,
Liu et al. (2018) applied in situ high-temperature Raman H., and Schmidt, B. C.: Structural controls on the anisotropy
and XRD spectroscopy to investigate the displacive phase of tetrahedral frameworks: the example of monoclinic feldspars,
Eur. J. Mineral., 25, 597–614, https://doi.org/10.1127/0935-
transition in natural anorthoclase samples with similar Or
1221/2013/0025-2323, 2013.
contents and different water contents. The spectroscopic re-
Beran, A.: A model of water allocation in alkali feldspar, derived
sults suggested that the displacive phase transition tempera- from infrared spectroscopic investigations, Phys. Chem. Min-
ture is higher for the nearly anhydrous anorthoclase than the eral., 13, 306–310, https://doi.org/10.1007/BF00308347, 1986.
anorthoclase with about 200 ppm water. Combined with pre- Demouchy, S. and Bolfan-Casanova, N.: Distribution and trans-
viously published results, we tentatively proposed that hy- port of hydrogen in the lithospheric mantle: A review, Lithos,
drogen incorporated as defects in anorthoclase may be an- 240–243, 402–425, https://doi.org/10.1016/j.lithos.2015.11.012,
other factor influencing the displacive phase transition tem- 2016.
perature. Because of the complexity of natural samples, we Dobrovolsky, A., Merdasa, A., Unger, E. L., Yartsev, A., and
added TEM measurements on the three samples to check Scheblykin, I. G.: Defect-induced local variation of crystal phase
texture effects in this study. The TEM study revealed the transition temperature in metal-halide perovskites, Nat. Com-
mun., 8, 34, https://doi.org/10.1038/s41467-017-00058-w, 2017.
presence of two coexisting feldspars in sample no. 1, a K-
Hamada, M., Ushioda, M., Fujii, T., and Takahashi, E.: Hydro-
poor and a K-rich one, while nos. 2 and 3 were homoge-
gen concentration in plagioclase as a hygrometer of arc basaltic
nous. Maybe sample no. 1 experienced composition modu- melts: Approaches from melt inclusion analyses and hydrous
lation during eruption, although the EPMA suggests simi- melting experiments, Earth Planet. Sc. Lett., 365, 253–262,
lar chemical compositions of the three samples and although https://doi.org/10.1016/j.epsl.2013.01.026, 2013.
the three samples are megacrysts hosted in Cenozoic basalt Harlow, G.: The anorthoclase structures: the effects of temperature
from the same locality. The K-poor areas in sample no. 1 may and composition, Am. Mineral., 67, 975–996, 1982.
https://doi.org/10.5194/ejm-32-305-2020 Eur. J. Mineral., 32, 305–310, 2020310 W. Liu et al.: Reply to Kroll and Schmid-Beurmann’s comment Harrison, R. J. and Salje, E. K. H.: X-ray diffraction study of Liu, W. D., Yang, Y., and Xia, Q. K.: Reply to Kroll the displacive phase transition in anorthoclase, grain-size effects and Schmid-Beurmann’s comment on “Water de- and surface relaxations, Phys. Chem. Mineral., 21, 325–329, creases displacive phase transition temperature in al- https://doi.org/10.1007/BF00202097, 1994. kali feldspar” by Liu et al. (2018), Dataset, FigShare, Hayward, S. A. and Salje, E. K. H.: Displacive phase transition in https://doi.org/10.6084/m9.figshare.12275498, 2020. anorthoclase: The “plateau effect” and the effect of T1–T2 order- Nisr, C., Shim, S. H., Leinenweber, K., and Chizmeshya, A.: ing on the transition temperature, Am. Mineral., 81, 1332–1336, Raman spectroscopy of water-rich stishovite and dense high- https://doi.org/10.2138/am-1996-11-1204, 1996. pressure silica up to 55 GPa, Am. Mineral., 102, 2180–2189, Henderson, C. M. B.: An elevated temperature X-ray study of syn- https://doi.org/10.2138/am-2017-5944, 2017. thetic disordered Na-K alkali feldspars, Contrib. Mineral. Petrol., Salje, E. H. K.: Raman spectroscopic investigation of 70, 71–79, https://doi.org/10.1007/BF00371873, 1979. the order parameter bahaviour in hypersolvus alkali Hofmeister, A. M. and Rossman, G. R.: A model for the feldspar: displacive phase transition and evidence for irradiative coloration of smoky feldspar and the inhibit- Na-K site ordering, Phys. Chem. Mineral., 13, 340–346, ing influence of water, Phys. Chem. Mineral., 12, 324–332, https://doi.org/10.1007/bf00308352, 1986. https://doi.org/10.1007/BF00654342, 1985. Salje, E. H. K., Bismayer, U., Wruck, B., and Hensler, J.: Influ- Jacobsen, S. D., Liu, Z., Ballaran, T. B., Littlefield, E. F., Ehm, L. ence of lattice imperfections on the transition temperatures of and Hemley, R. J.: Effect of H2 O on upper mantle phase transi- structural phase transitions: The plateau effect, Phase Transit., tions in MgSiO3 : is the depth of the seismic x-discontinuity an 35, 61–74, https://doi.org/10.1080/01411599108203423, 1991. indicator of mantle water content?, Phys. Earth Planet. In., 183, Shuai, K. and Yang, X. Z.: Quantitative analysis of H-species in 234–244, https://doi.org/10.1016/j.pepi.2010.06.015, 2010. anisotropic minerals by polarized infrared spectroscopy along Johnson, E. A. and Rossman, G. R.: A survey of hydrous species three orthogonal directions, Contrib. Mineral. Petrol., 172, 14, and concentrations in igneous feldspars, Am. Mineral., 89, 586– https://doi.org/10.1007/s00410-017-1336-2, 2017. 600, https://doi.org/10.2138/am-2004-0413, 2004. Smyth, J. R., Kawamoto, T., Jacobsen, S. D., Swope, R. J., Hervig, Johnson, E. A. and Rossman, G. R.: The behavior of hydro- R. L., and Holloway, J. R.: Crystal structure of monoclinic hy- gen in plagioclase feldspar at 800–1000◦ : Implications for re- drous wadsleyite [b−(Mg, Fe)2 SiO4 ], Am. Mineral., 82, 270– equilibration of hydroxyl in volcanic phenocrysts, Am. Mineral., 275, https://doi.org/10.2138/am-1997-3-404, 1997. 98, 1779–1787, https://doi.org/10.2138/am.2013.4521, 2013. Umemoto, K., Kawamura, K., Hirose, K., and Wentzcov- Kroll, H., Bambauer, H. U., and Schirmer, U.: The high albite– itch, R. M.: Post-stishovite transition in hydrous alu- monalbite and analbite–monalbite transitions, Am. Mineral., 65, minous SiO2 , Phys. Earth Planet. Inter., 255, 18–26, 1192–1211, 1980. https://doi.org/10.1016/j.pepi.2016.03.008, 2016. Kroll, H. and Schmid-Beurmann, P.: Comment on “Water Xu, H. F., Veblen, D. R., and Zhang, Y. Q.: Structural modulation decreases displacive phase transition temperature in alkali and phase transition in a Na-rich alkali feldspar, Am. Mineral., feldspar” by Liu et al. (2018), Eur. J. Mineral., 32, 167–170, 80, 897–906, https://doi.org/10.2138/am-1995-9-1004, 1995. https://doi.org/10.5194/ejm-32-167-2020, 2020. Yang, Y., Wang, Z. P., Tian, Z. Z., Xia, Q. K., and Li, G. Kroll, H., Schmiemann, I., and Colln, G. V.: Feldspar solid solu- W.: High-temperature phase transition and local structure of tions, Am. Mineral., 71, 1–16, 1986. a hydrous anorthoclase, Phys. Chem. Mineral., 43, 111–118, Kronenberg, A. K., Yund, R. A., and Rossman, G. R.: https://doi.org/10.1007/s00269-015-0778-1, 2016. Stationary and mobile hydrogen defects in potassium Zhang, M., Wruck, B., Barber, A. G., Salje, E., and Carpenter, M. feldspar, Geochim. Cosmochim. Ac., 60, 4075–4094, A.: Phonon spectra of alkali feldspars: Phase transition and solid https://doi.org/10.1016/S0016-7037(96)00249-9, 1996. solutions, Am. Mineral., 81, 92–104, https://doi.org/10.2138/am- Liu, W. D., Yang, Y., Xia, Q. K., Ye, Y., Wang, Z. P., Zhang, P. 1996-1-212, 1996. P., and Li, G. W.: Water decreases displacive phase transition temperature in alkali feldspar, Eur. J. Mineral., 30, 1071–1081, https://doi.org/10.1127/ejm/2018/0030-2775, 2018. Eur. J. Mineral., 32, 305–310, 2020 https://doi.org/10.5194/ejm-32-305-2020
You can also read