EFFECT OF CAO ON CATALYTIC COMBUSTION OF SEMI-COKE
←
→
Page content transcription
If your browser does not render page correctly, please read the page content below
Green Processing and Synthesis 2021; 10: 11–20
Research Article
Luyao Kou, Junjing Tang, Tu Hu*, Baocheng Zhou*, and Li Yang
Effect of CaO on catalytic combustion
of semi-coke
https://doi.org/10.1515/gps-2021-0002 Keywords: semi-coke, catalytic combustion, chemical
received August 24, 2020; accepted November 08, 2020 reaction dynamics
Abstract: Generally, adding a certain amount of an addi-
tive to pulverized coal can promote its combustion
performance. In this paper, the effect of CaO on the com-
bustion characteristics and kinetic behavior of semi-coke 1 Introduction
was studied by thermogravimetric (TG) analysis. The
results show that adding proper amount of CaO can At present, it has become a routine technology for blast
reduce the ignition temperature of semi-coke and increase furnace ironmaking to replace coke with pulverized coal.
the combustion rate of semi-coke; with the increase in CaO It plays an important role in saving coke, reducing con-
content, the combustion rate of semi-coke increases first sumption, adjusting furnace conditions, reducing pig
and then decreases, and the results of TG analysis showed iron costs, and reducing environmental pollution [1].
that optimal addition amount of CaO is 2 wt%. The apparent The commonly used pulverized coal for blast furnace
activation energy of CaO with different addition amounts of injection includes bituminous coal and anthracite.
CaO was calculated by Coats–Redfern integration method. Because of its high volatility and flammability, bitumi-
The apparent activation energy of semi-coke in the combus- nous coal is widely used in blast furnace injection [2,3].
tion reaction increases first and then decreases with the Bituminous coal has good flammability, but it contains a
increase in CaO addition. The apparent activation energies lot of harmful substances such as S and P [4–6]. Anthra-
of different samples at different conversion rates were cal- cite has the characteristics of high fixed carbon and low S
culated by Flynn–Wall–Ozawa integral method. It was and P impurity content, but its combustion performance
found that the apparent activation energies of semi-coke is poor [7,8]. To increase the amount of coal injected into
during combustion reaction decreased with the increase the blast furnace and ensure that the coal powder is
in conversion. burned as much as possible inside the blast furnace,
anthracite is generally mixed with bituminous coal for
mixed injection [9,10]; this not only makes use of the
high fixed carbon content and high calorific value of
* Corresponding author: Tu Hu, Yunnan Provincial Key Laboratory of anthracite, but also takes advantage of the low ignition
Intensification Metallurgy, Kunming University of Science and
point and good combustion characteristics of bituminous
Technology, Kunming 650093, Yunnan, China; State Key Laboratory
of Complex Nonferrous Metal Resources Clean Utilization (Kunming
coal. With the increasing price of anthracite, the cost of
University of Science and Technology), Kunming 650093, Yunnan, blast furnace ironmaking is also increasing, and therefore
China; Faculty of Metallurgical and Energy Engineering, Kunming it is necessary to find another pulverized coal to replace
University of Science and Technology, Kunming 650093, Yunnan, anthracite. As a new type of carbon material, semi-coke
China, e-mail: hutu1219@126.com has huge reserves in China [11]. It has the advantages of
* Corresponding author: Baocheng Zhou, Kunming University of
low ash, low sulfur, low phosphorus, and high fixed
Science and Technology Design and Research Institute, Kunming
650093, Yunnan, China, e-mail: 976140116@qq.com carbon. Its pore structure is complex, its combustion per-
Luyao Kou, Junjing Tang, Li Yang: Yunnan Provincial Key Laboratory formance is good, and its price is lower than anthracite;
of Intensification Metallurgy, Kunming University of Science and therefore, the use of semi-coke combined with bitumi-
Technology, Kunming 650093, Yunnan, China; State Key Laboratory nous coal can further reduce the cost of blast furnace
of Complex Nonferrous Metal Resources Clean Utilization (Kunming
coal injection. However, at present, the blending amount
University of Science and Technology), Kunming 650093, Yunnan,
China; Faculty of Metallurgical and Energy Engineering, Kunming
of semi-coke in mixed injection pulverized coal is limited.
University of Science and Technology, Kunming 650093, Yunnan, After excessive addition, the combustion performance of
China mixed pulverized coal will be reduced, and the unburned
Open Access. © 2021 Luyao Kou et al., published by De Gruyter. This work is licensed under the Creative Commons Attribution 4.0
International License.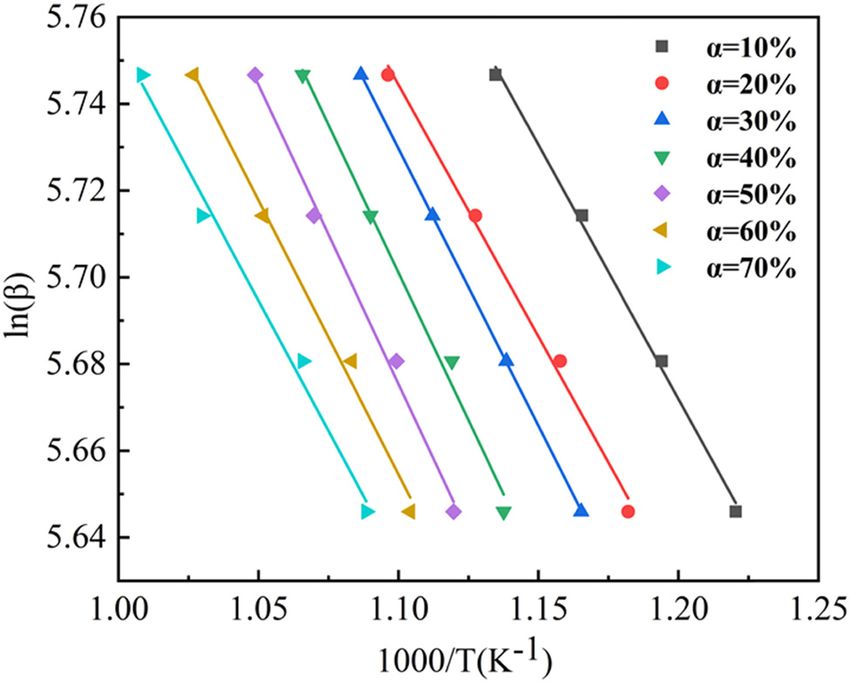
12 Luyao Kou et al.
pulverized coal will increase, which is not conducive to of semi-coke in the mixed pulverized coal injection is an
the blast furnace going forward. effective method. At present, there are many studies on
Zhang et al. [12] found that in the mixture of semi- the co-combustion characteristics of semi-coke and other
coke and bituminous, when semi-coke accounts for 20%, combustible substances, but there are few studies on the
it has a certain promotion effect on the entire combustion effect of combustion-supporting additives on the cata-
process. Yang et al. [13] used thermogravimetric (TG) lytic combustion performance of semi-coke. Although
analysis to study the co-firing behavior of Fushun low- alkali metals such as Na and K have a good catalytic
calorie oil shale and semi-coke. The results showed that effect on combustion, after being added, they easily
with the increase in oil shale mass fraction and oxygen cause corrosion to the combustion equipment, which is
concentration, the combustion characteristics of the not conducive to long-term use of the blast furnace
sample were improved. Yao et al. [14] used TG analysis [21,22]. Because CaO has obvious combustion-supporting
to study the combustion characteristics and kinetics of effect on coal powder, the price is cheap and easy to
the blend in an oxygen-rich atmosphere. Finally, it was obtain, and it will not cause corrosion to the blast fur-
found that CO2 instead of N2 can significantly improve the nace. In this paper, the catalytic combustion of semi-coke
burnout behavior of semi-coke under the same oxygen was studied using CaO combustion aid, which has certain
concentration. Yang et al. [15] used TG analysis to study guiding significance for increasing the amount of semi-
the mixed combustion process of several kinds of coal coke in mixed injection coal powder.
and semi-coke, and found that as the heating rate
increased, the combustion performance of mixed coal
powder and semi-coke was improved. All the above stu-
dies are about the mixed combustion of semi-coke and 2 Experimental
other combustible materials, and the experimental study
on the effect of combustion promoters on their catalytic
2.1 Sample preparation
combustion has not been carried out.
Alkaline earth metals such as Ca, Mg, Ba, and other
compounds can promote the interfacial reaction of carbon The semi-coke used in the experiment was obtained from
and oxygen and have a high reactivity. In particular, Ca a smelting company in Yunnan, China. First, use a ball
compounds are very cheap combustion-supporting cata- mill to grind the semi-coke to 200 meshes, then dry it to a
lysts. CaO, CaCO3, CaCl2, and other Ca-based catalysts constant weight at 80°C in a constant temperature oven,
have been widely studied by scholars [16,17]. Jayasekara and then store it in a sealed bag. The industrial analysis
et al. [18] studied the influence of Ca and Fe content on of semi-coke is presented in Table 1. The preparation of
the reactivity of coke with CO2. Compared with the addi- the experimental sample was as follows: weigh 10 g semi-
tion of Fe, the reactivity of Ca added to coke was doubled. coke, put it into a beaker, and then add 2 wt% CaO and
Cheng et al. [19] studied the catalytic effects of Na-rich 150 mL anhydrous ethanol; the mixture was magnetically
and Ca-rich industrial wastes on coal ignition. The results stirred at room temperature for 1 h, then the sample was
show that both metals have good catalytic effect on coal dried at 105°C for 24 h, and then taken out and ground for
ignition, but Na has higher catalytic activity on coal igni- 5 min. The above operation was repeated to prepare
tion than Ca. Abbasi-Atibeh et al. [20] used TG analyzers mixed semi-coke samples having CaO addition amounts
to study the effects of K, Ca, and Fe on the catalytic pyr- of 0, 2, 4, 6, and 8 wt%, which were designated as K1, K2,
olysis and combustion characteristics of low-calorie K3, K4, and K5, respectively.
Turkish lignite. The results show that the combustion
tests conducted under O2/CO2 environmental conditions
show that the relative activity of the catalyst is Fe ≫ K >
Ca and Fe > Ca ≫ K at O2 concentrations of 30% and 35%, Table 1: Proximate and ultimate analysis results of semi-coke, wt%
respectively. In addition, potassium catalysts have higher
reaction rates at all oxygen concentrations. The above Proximate analysis Ultimate analysis
results show that the combustion promoters have good Mad% Vad% Aad% FCad Cad Had Oad Nad Sad
catalytic effect on coal, but there is no specific experi-
5.28 17.57 8.69 70.28 83.74 3.43 0.76 0.72 0.4
mental study on the catalytic combustion of semi-coke.
To reduce the cost of pig iron in blast furnace and Note: ad – air dry basis; M – moisture; V – volatile matter; FC – fixed
reduce environmental pollution, increasing the amount carbon.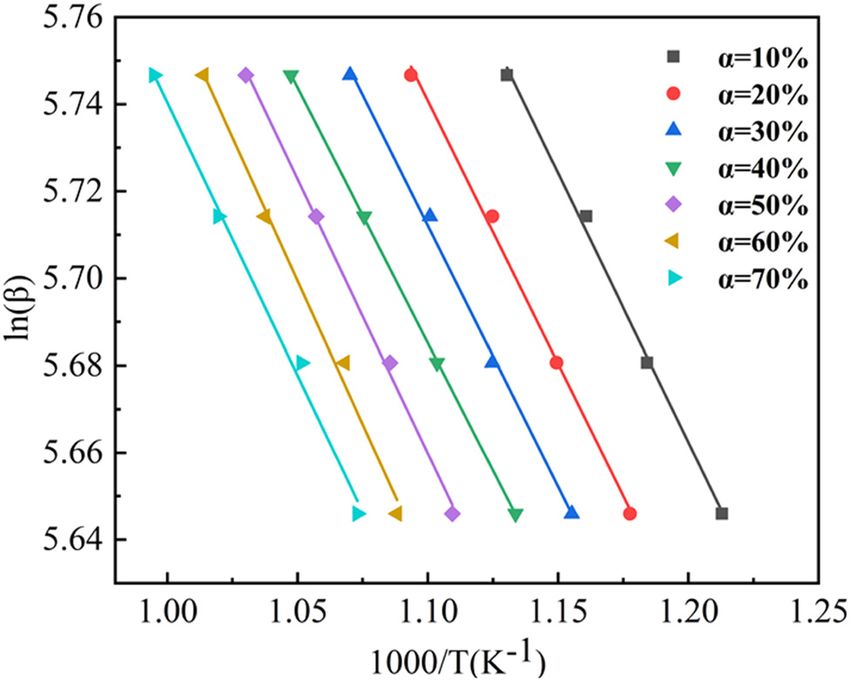
Catalytic combustion on semi-coke with CaO 13
2.2 Sample characterization seen from the TG curve that the combustion temperature
range of the mixed semi-coke sample is between 400°C
The combustion characteristics of the mixed samples and 750°C. Ignition temperature (Ti ) of the samples can
were analyzed by a thermal analyzer model STA6000/ be determined by TG-DTG tangent method, that is, the
8000. The temperature deviation of the thermal analyzer vertical point of the X-axis is made at the peak point of
was ±0.1°C, and the sensitivity deviation of the balance the DTG curve, and the TG curve is intersected at one
was less than 0.1 μg. In this experiment, the sample was point, and the tangent of the TG curve is made at this
raised to 1,000°C at room temperature at a heating rate of point, and the tangent of the point where the initial mass
10°C/min, 20°C/min, 30°C/min, and 40°C/min under an air is unchanged on the TG curve, the intersection of the two
flow rate of 50 mL/min. tangent lines is the ignition point of the samples. Ti
reflects the ignition performance of the sample, and the
smaller the Ti , the easier the sample is to catch fire [23].
The burnout temperature (Tb ) indicates the temperature
3 Results and discussion at which the combustibles in the samples are completely
burned out within a certain temperature range, and
usually the TG curve tends to a horizontal straight line,
3.1 Combustion performance
corresponding to the temperature at which the DTG curve
is close to zero. Ti and Tb reflect changes in combustion
Five samples of K1, K2, K3, K4, and K5 were tested by performance throughout the combustion process [24].
thermal analyzer. The TG and DTG curves of combustion The burnout temperature and ignition temperature of
tests for different samples are shown in Figure 1. It can be the sample are presented in Table 2. After the addition
of CaO, the burnout temperature and ignition tempera-
ture of the semi-coke are reduced. After adding 2 wt%
CaO, the ignition temperature of the semi-coke decreased
by 23.70°C, and the burnout temperature decreased by
7.23°C. As the amount of CaO added continues to increase,
although the ignition temperature of semi-coke is some-
what reduced, the reduction is much smaller than that of
semi-coke with 2 wt% CaO.
By analyzing the TG curve, the combustion rate of the
sample at different temperatures can be obtained. For the
convenience of analysis, the combustion rate of the sam-
ples at the combustion temperatures of 500°C, 600°C,
700°C, and 800°C is generally selected. The combustion
rate calculation formula is as follows:
Wi − Wt
R= × 100%, (1)
Wi × η
where Wi is the initial mass of the sample, g; Wt is the
mass after the sample is burned t min, g; η is the weight
loss rate when the sample is completely burned without
additives; and R is the combustion rate of the sample.
In the combustion process, integrated combustion
characteristic index (S ) is generally used to reflect the
whole process of burnout and ignition of the sample.
The larger the S , the better the combustion characteristics
of the sample. The calculation formula is as follows:
S=
( )
dw
dt max
× ( )
dw
dt mean
,
(2)
Figure 1: TG–DTG curves of the sample at the temperature rise rate Ti2 × Tb
of 20°C/min: (a) TG and (b) DTG curves.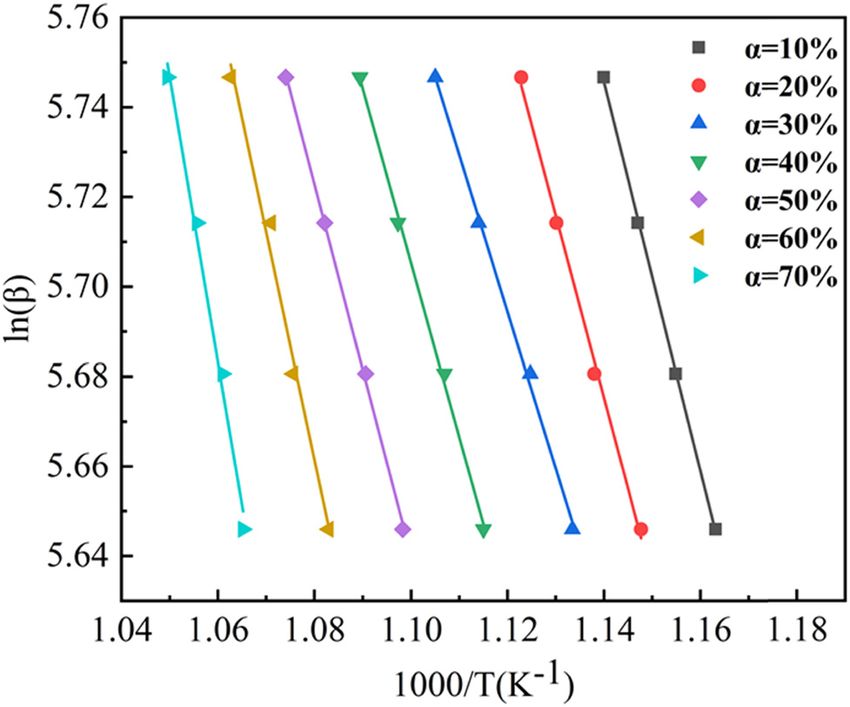
14 Luyao Kou et al.
Table 2: Combustion parameters of mixed semi-coke samples
Sample Ti (°C) Tb (°C) Combustion rate (%) S × 109 (%2 min−2 °C−3)
500°C 600°C 700°C 800°C
K1 439.15 757.52 5.36 24.52 91.99 99.99 0.44
K2 415.45 750.29 6.15 29.47 89.16 99.82 0.69
K3 428.38 753.68 5.53 24.61 87.24 96.96 0.63
K4 428.96 751.48 4.25 22.57 80.21 94.49 0.42
K5 430.96 754.29 4.24 21.71 76.53 91.53 0.35
where ( )
dw
dt max
is the maximum combustion rate of pul- is constantly shifting to the right as the rate of tempera-
ture rises, causing Ti and Tb to increase accordingly. For
verized coal, %/min; and ( )
dw
dt mean
is the average combus-
K3 sample, when the heating rate rises from 10°C/min to
tion rate, %/min. 40°C/min, the Ti of the sample rises from 428.38°C to
Comprehensive combustion characteristic index and
combustion rate of different samples at different tempera-
tures are presented in Table 2. It can be seen from Table 2
that the combustion rates at the combustion tempera-
tures of 500°C and 600°C are improved when the addition
amount of CaO in the semi-coke is 2 wt% and 4 wt% com-
pared with the semi-coke without the additive. With the
further increase in CaO addition, when the added amount
of CaO in the semi-coke is 6 wt% and 8 wt%, the combus-
tion rates between 500°C and 800°C are lowered. It shows
that CaO can promote the combustion of semi-coke, but
adding too much of CaO will inhibit its combustion. With
the increase in the amount of CaO, the comprehensive
combustion characteristics of the samples first increase
and then decrease; when the amount of CaO added is
2 wt%, the ignition temperature and burnout temperature
of the sample are the lowest, probably because CaO will
adsorb the macromolecular volatile components in the
semi-coke, which will cause the fixed carbon to locally
overheat, resulting in a decrease in the fixed carbon igni-
tion temperature [25,26]. Therefore, the oxidation reac-
tion is more likely to occur, but excessive CaO will inhibit
the combustion of semi-coke.
3.2 Impact of heating rates
Considering the impact of different heating rates of the
thermal analyzer on the samples, the K1, K2, K3, K4, and
K5 were tested in air atmospheres with heating rates of
10°C/min, 20°C/min, 30°C/min, and 40°C/min. The com-
bustion process of the mixed samples having similar
trends at different heating rates is shown in Figures
2–6, which indicates that the variation trend of combus-
tion process of mixed samples is similar under different
heating rates, but it has little impact on the whole com- Figure 2: TG–DTG curves of K1 sample at different heating rates:
bustion reaction process of pulverized coal. The TG curve (a) TG and (b) DTG curves.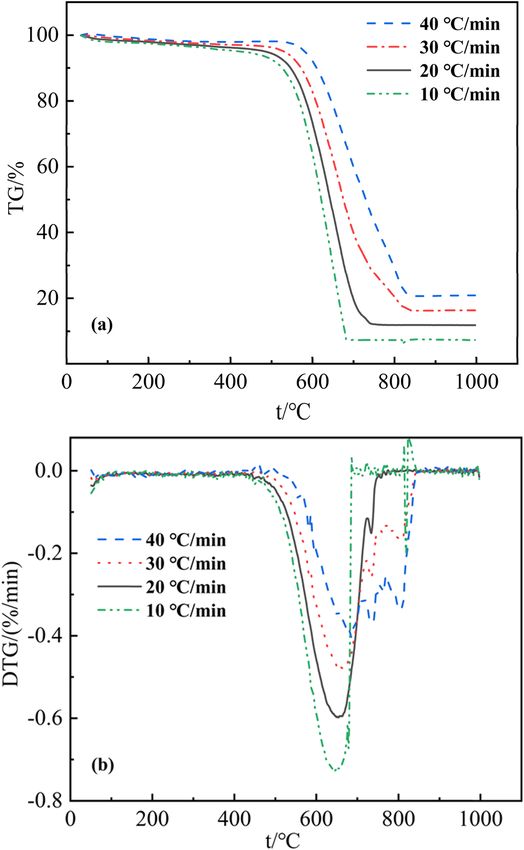
Catalytic combustion on semi-coke with CaO 15
Figure 3: TG–DTG curves of K2 sample at different heating rates:
(a) TG and (b) DTG curves. Figure 4: TG–DTG curves of K3 sample at different heating rates:
(a) TG and (b) DTG curves.
450.25°C, and the Tb rises from 753.68°C to 836.27°C. This
is because the propagation and heat transfer of the analysis of data results of a TG curve measured by an
medium take some time. If the heating rate of the pro- experiment at a fixed heating rate [27]. According to
gram is too fast, the time for the combustion reaction of Arrhenius’s law, if the initial mass of the coal powder
the sample will be insufficient, and then the entire TG involved in the reaction is m0, the mass after the reaction
curve will shift to the high temperature area. It can be t time is m, and the final mass is m∞ after the reaction is
obtained from the DTG curve that the mass loss rate of the completed, the expression of the reaction rate can be
sample also decreases as the rate of temperature rises. obtained as follows:
With the increase in the heating rate from 10°C/min to
= A(1 − α)n exp − α f (α),
40°C/min, the maximum weight loss rate of the sample dα E
(3)
decreases from 0.91% to 0.36% per degree Celsius. dt RT
m0 − m
α= , (4)
m 0 − m∞
3.3 Dynamic analysis results where A refers to the pre-exponential factor, min−1; α is
the conversion rate of coal powder; n is the reaction
The Coats–Redfern integration method belongs to a order; Eα is the activation energy, kJ/mol; and R is the
single scan rate method and is a method for kinetic gas constant.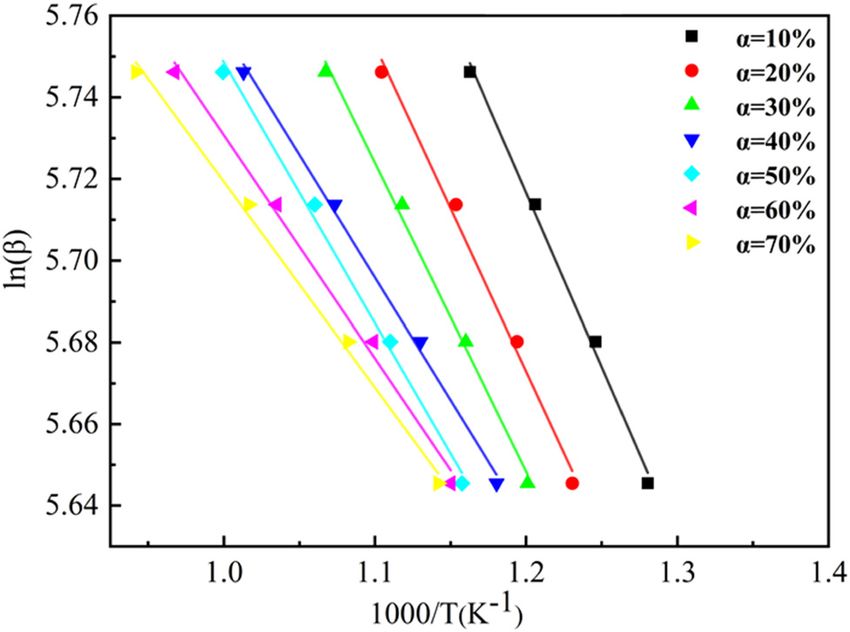
16 Luyao Kou et al.
Figure 6: TG–DTG curves of K5 sample at different heating rates:
(a) TG and (b) DTG curves.
Figure 5: TG–DTG curves of K4 sample at different heating rates:
(a) TG and (b) DTG curves.
AR 1 − 2RT
ln(1 − α)
ln − = ln
(
Eα ) − Eα
. (7)
T 2
βE RT
dT α
If the rate of temperature raises, β = dt
is brought to
Eq. 3, and a temperature approximation is made, then In the combustion process of pulverized coal sam-
there is: ples, the result of Eα is much larger than 1; therefore,
RT
α
∫ (1 −dαα)n =
ART 2 (1 − ) exp ( ) .
2RT
Eα
E
− RTα
(5)
the result of 1 −
2RT
Eα
is about equal to 1, that is, the expres-
βEα sion of the first term on the right-hand side of the
0 Coats–Redfern equation is independent of temperature.
When n = 1, in Eq. 7, ln − T 2 is plotted against 1 ,
ln(1 − α)
After Eq. 5, the Coats–Redfern equation can be
T
obtained: when n ≠ 1, E
and the graph is approximated as a straight line, − Rα is
AR 1 − 2RT
1 − (1 − α)1 − n
ln
( Eα ) − E α
(6)
the slope, and ln βE is the intercept. Therefore, in the
AR
α
2 = ln ,
T (1 − n)
βEα
RT end, the value of the exponential pre-factor and the acti-
vation energy of the combustion reaction of the semi-
when n = 1, coke mixed sample can be obtained.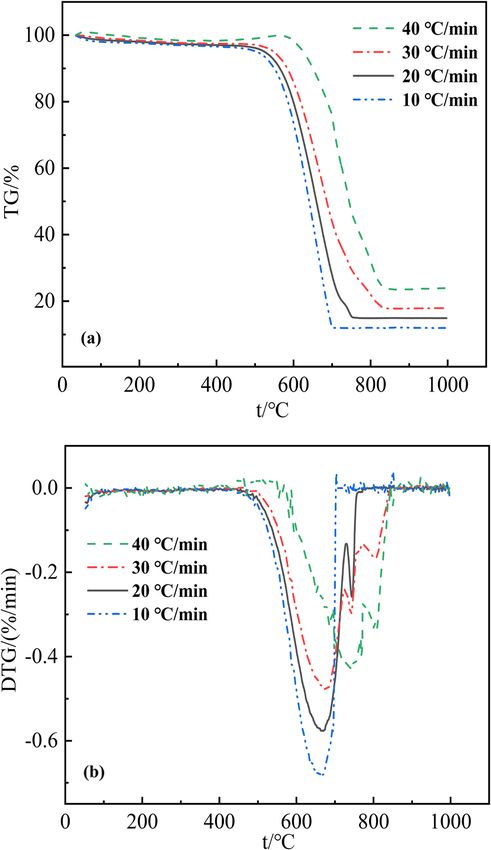
Catalytic combustion on semi-coke with CaO 17
first-order reaction. It can be obtained from Table 3 that
the activation energy of semi-coke has a certain degree of
reduction after adding CaO. When the addition amount is
2, 4, 6, and 8 wt%, the activation energy is reduced by
10.88, 6.50, 6.49, and 0.16 kJ/mol. This indicates that CaO
promotes the combustion of semi-coke, and the activa-
tion energy is also relatively reduced. When the CaO addi-
tion amount is 2 wt%, the reaction activation energy is the
smallest, which is consistent with the K2 sample combus-
tion characteristics of the mixed sample obtained above.
The kinetic analysis of different samples was per-
formed by multi-scan FWO integration method. This
Figure 7: Coats–Redfern method plots of different samples at
20°C/min.
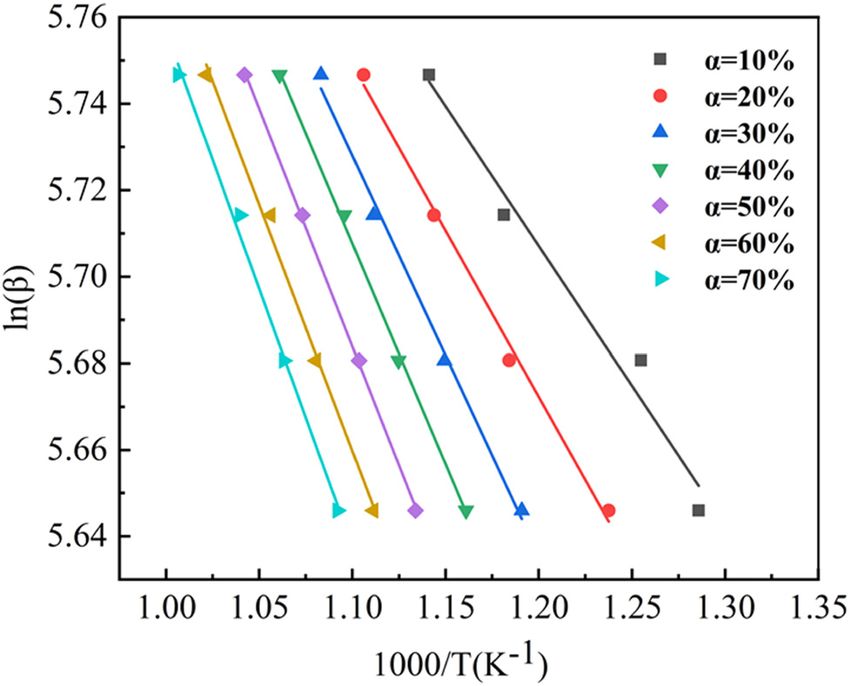
The Flynn–Wall–Ozawa integration method belongs
to the multiple scan rate method, which analyzes the
experimental data obtained by samples at different heating
rates [28,29]. The basic equation of the model is as follows:
AEα Eα
ln β = ln − 5.331 − 1.052 . (8)
G(α) RT
At different heating rates, if the same conversion rate
is chosen, integral form of reaction mechanism mode
function G(α) is a fixed value, plotted as ln β versus 1 ,
T
the data is fitted by least squares method, and the activa-
tion energy of the reaction can be determined from the
slope. Figure 8: FWO method plots of sample K1 in different conversion
Assume that the combustion reaction of the sample degrees.
in this experiment is a first-order reaction, that is, n = 1.
Figure 7 shows the Coats–Redfern kinetic analysis curve
of different samples at a programmed temperature rate of
20°C/min. The activation energy and pre-exponential
factor calculation results are presented in Table 3.
It can be seen from Figure 7 that the linearity of the
curve of ln − T 2 with 1000 is very good, indicating
ln(1 − α)
T
that it is reasonable to assume that the combustion reac-
tion of the sample under the experimental conditions is a
Table 3: Combustion kinetic parameters of different samples
Sample Eα (kJ/mol) A (min−1) R2
K1 93.74 3.70 × 10⁵ 0.998
K2 82.86 1.16 × 10⁷ 0.998
K3 87.24 1.36 × 10⁵ 0.998
K4 87.25 3.56 × 10⁴ 0.999
Figure 9: FWO method plots of sample K2 in different conversion
K5 93.58 2.72 × 10⁵ 0.996
degrees.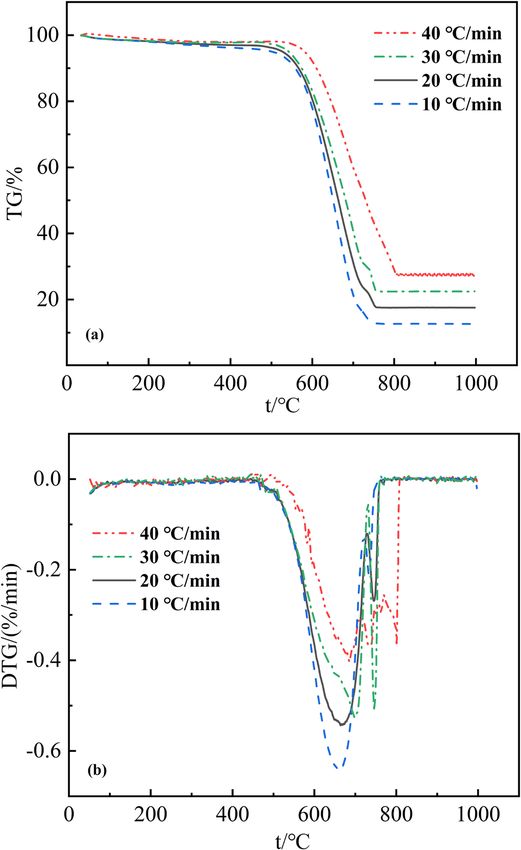
18 Luyao Kou et al.
method is to fit the experimental data by the conversion rate
α within a certain range. In the experiment, α is between 0.1
and 0.7, and the fitting data exceeding this range are dis-
carded because it is unreasonable. Figures 8–12 show the
FWO kinetic analysis curves of the different samples reacted
at different temperature programmed rates, and Tables 4–8
present the activation energy calculation and pre-exponen-
tial factor calculation results.
As shown in Figures 8–12, the straight line fitted by
the FWO integral method agrees well with the original
data, which indicates that the linearity of the kinetic
curve obtained by this method is high and the result is
reliable. Moreover, the slope of the fitted straight line
changes with the change in α of the conversion, that is,
Figure 12: FWO method plots of sample K5 in different conversion
degrees.
the reaction activation energy also changes. It can be
seen from Tables 4–8 that the activation energy decreases
with the increase in conversion in the same sample. This
is because the whole experimental process is carried out
under programmed temperature. As the temperature rises
gradually, the gas–solid reaction will transition from the
initial power control zone to the diffusion control zone, and
finally the resulting activation energy is reduced [30,31].
Table 4: Combustion kinetic parameters of sample K1
Figure 10: FWO method plots of sample K3 in different conversion Conversion Eα (kJ/mol) A (min−1) R2
degrees.
0.1 58.35 2.16 × 10⁶ 0.996
0.2 57.89 0.97 × 10⁵ 0.998
0.3 56.68 3.03 × 10⁷ 0.997
0.4 56.13 3.82 × 10⁵ 0.993
0.5 55.47 3.62 × 10⁷ 0.994
0.6 54.69 2.57 × 10⁷ 0.991
0.7 53.29 1.62 × 10⁶ 0.992
Average 56.07 — —
Table 5: Combustion kinetic parameters of sample K2
Conversion Eα (kJ/mol) A (min−1) R2
0.1 47.35 2.63 × 10⁶ 0.988
0.2 46.89 1.19 × 10⁵ 0.995
0.3 45.68 3.71 × 10⁷ 0.995
0.4 45.13 4.75 × 10⁵ 0.998
0.5 44.47 4.52 × 10⁷ 0.994
0.6 43.69 3.28 × 10⁷ 0.994
0.7 43.29 1.99 × 10⁶ 0.996
Figure 11: FWO method plots of sample K4 in different conversion
Average 45.21 — —
degrees.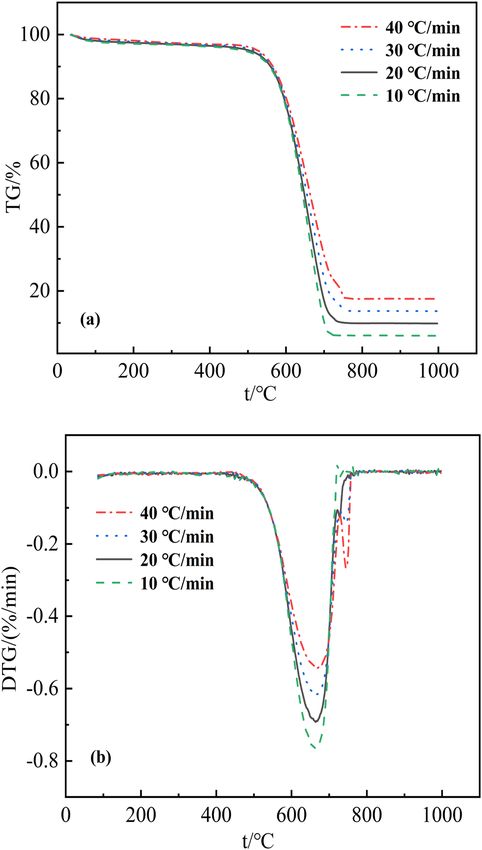
Catalytic combustion on semi-coke with CaO 19
Table 6: Combustion kinetic parameters of sample K3 semi-coke are obviously different because of the catalytic
combustion supporting characteristics of CaO. The main
Conversion Eα (kJ/mol) A (min−1) R2 conclusions are as follows:
0.1 53.25 2.35 × 10⁶ 0.995
(1) The addition of a certain amount of CaO can lower the
0.2 52.39 1.07 × 10⁵ 0.993 burnout and ignition temperature of the semi-coke.
0.3 51.79 3.28 × 10⁷ 0.995 When the addition amount was 2 wt%, the burnout
0.4 50.22 4.27 × 10⁵ 0.997 and ignition temperature of the semi-coke decreased
0.5 50.47 3.98 × 10⁷ 0.995 the most, which were 23.70°C and 7.23°C, respec-
0.6 49.61 2.89 × 10⁷ 0.994
tively. With the further increase in CaO addition,
0.7 49.18 1.76 × 10⁶ 0.996
Average 50.99 — — although the burnout and ignition temperature of
semi-coke decreased, it was significantly lower than
the semi-coke when the CaO addition amount was
2 wt%.
Table 7: Combustion kinetic parameters of sample K4 (2) The combustion rate and comprehensive combustion
characteristic index of different samples at different
Conversion Eα (kJ/mol) A (min−1) R2 temperatures indicate that the addition of CaO can
0.1 54.16 2.31 × 10⁶ 0.995
promote the combustion of semi-coke, but adding
0.2 53.26 1.05 × 10⁵ 0.993 too much of CaO will inhibit its combustion.
0.3 52.33 3.24 × 10⁷ 0.995 (3) The apparent activation energy of semi-coke with dif-
0.4 51.69 4.14 × 10⁵ 0.997 ferent addition amounts of CaO was calculated by
0.5 49.87 4.04 × 10⁷ 0.995 Coats–Redfern integration method. In this experi-
0.6 48.69 2.88 × 10⁷ 0.994
ment, the apparent activation energy decreases first
0.7 47.86 1.81 × 10⁶ 0.996
Average 51.12 — — and then increases with the increase in CaO addition.
When the added amount is 2 wt%, the apparent acti-
vation energy is reduced to 82.86 kJ/mol. The apparent
activation energies of different samples at four heating
Table 8: Combustion kinetic parameters of sample K5 rates were calculated by FWO integration method. In
this experiment, the apparent activation energy of the
Conversion Eα (kJ/mol) A (min−1) R2 combustion reaction of different samples decreased
0.1 59.35 2.11 × 10⁶ 0.995
with the increase in conversion. The calculated apparent
0.2 58.28 0.98 × 10⁵ 0.993 activation energy is closer to the real activation energy at
0.3 57.63 2.97 × 10⁷ 0.995 lower conversion, that is, the lower the reaction gas
0.4 56.38 3.79 × 10⁵ 0.997 temperature.
0.5 55.74 3.61 × 10⁷ 0.995
0.6 54.69 2.56 × 10⁷ 0.994
0.7 53.89 1.61 × 10⁶ 0.996
Average 56.57 — — Acknowledgments: This work was supported by the
National Nature Science Foundation of China (51764034),
Yunnan Provincial Science and Technology Talents
Five samples were tested at different heating rates, when Program (202005AC160033)and Yunnan Ten Thousand
the conversion rate α exceeds 0.7, under the condition of Talents Plan Young & Elite Talents Project (No. YNWRQNBJ-
high temperature programming rate, the sample is not com- 2019-222).
pletely converted, so the subsequent fitting data are unrea-
sonable and discarded.
References
4 Conclusions [1] Mathieson JG, Truelove JS, Rogers H. Toward an understanding
of coal combustion in blast furnace tuyere injection. Fuel.
2005;84(10):1229–37. doi: 10.1016/j.fuel.2004.06.036.
In this paper, the characteristics and kinetic behavior of [2] Gupta S, Al-Omari Y, Sahajwalla V, French D. Influence of
semi-coke mixed with CaO were studied by TG analysis. carbon structure and mineral association of coals on their
In the TG analyzer, the combustion characteristics of combustion characteristics for pulverized coal injection (PCI)
20 Luyao Kou et al.
application. Metall Mater Trans B. 2006;37(3):457–73. [17] Sanahuja-Parejo O, Veses A, Lopez JM, Murillo R, Callen MS,
doi: 10.1007/s11663-006-0030-y. Garcia T. Ca-based catalysts for the production of high-quality
[3] Saha M, Dally BB, Medwell PR, Chinnici A. Burning character- bio-oils from the catalytic co-pyrolysis of grape seeds and
istics of Victorian brown coal under MILD combustion condi- waste tyres. Catalysts. 2019;9(12):992. doi: 10.3390/
tions. Combust Flame. 2016;172:252–70. doi: 10.1016/ catal9120992.
j.combustflame.2016.07.026. [18] Jayasekara AS, Monaghan BJ, Longbottom RJ, Mahoney MR,
[4] Koene AC, Buke T. Forecasting of CO2 emissions from fuel Hockings K. The study of the Ca dispersion in coke and effect of
combustion using trend analysis. Renew Sust Energ Rev. Ca and Fe on the coke reactivity using the sole heated oven
2010;14(9):2906–15. doi: 10.1016/j.rser.2010.06.006. cokes. Fuel. 2020;264:116818. doi: 10.1016/j.fuel.2019.116818.
[5] Dmitrienko MA, Nyashina GS, Strizhak PA. Major gas emis- [19] Cheng J, Zhou F, Xuan XX, Liu JZ, Zhou JH, Cen KF. The catalytic
sions from combustion of slurry fuels based on coal, coal effect of the Na and Ca-rich industrial wastes on the thermal
waste, and coal derivatives. J Clean Prod. 2018;177:284–301. ignition of coal combustion. Chin J Chem Eng.
doi: 10.1016/j.jclepro.2017.12.254. 2019;27(10):2467–71. doi: 10.1016/j.cjche.2019.02.037.
[6] Li Q, Jiang JK, Wang SX, Rumchev K, Mead-Hunter R, [20] Abbasi-Atibeh E, Yozgatligil A. A study on the effects of cata-
Morawska L, et al. Impacts of household coal and biomass lysts on pyrolysis and combustion characteristics of Turkish
combustion on indoor and ambient air quality in China: lignite in oxy-fuel conditions. Fuel. 2014;115:841–9.
Current status and implication. Sci Total Env. doi: 10.1016/j.fuel.2013.01.073.
2017;576:347–61. doi: 10.1016/j.scitotenv.2016.10.080. [21] Bhattacharyya A, Schenk J, Rantitsch G, Thaler C, Stocker H.
[7] Fan WD, Lin ZC, Li YY, Kuang JG, Zhang MC. Effect of air-staging Effect of alkaline elements on the reactivity, strength and
on anthracite combustion and Nox formation. Bound Value structural properties of blast furnace cokes. Metalurgija.
Probl. 2009;23(1):111–20. doi: 10.1021/ef800343j. 2015;54(3):503–6.
[8] Wang QX, Chen ZC, Han H, Zeng LY, Li ZQ. Experimental char- [22] Humad AM, Habermehl-Cwirzen K, Cwirzen A. Effects of
acterization of anthracite combustion and NOx emission for a fineness and chemical composition of blast furnace slag
300-MWe down-fired boiler with a novel combustion system: on properties of alkali-activated binder. Materials.
Influence of primary and vent air distributions. Appl Energ. 2019;12(20):3447. doi: 10.3390/ma12203447.
2019;238:1551–62. doi: 10.1016/j.apenergy.2019.01.080. [23] Jiang LB, Yuan XZ, Li H, Xiao ZH, Liang J, Wang H, et al.
[9] Kim DW, Lee JM, Kim JS. Co-combustion of Korean anthracite Pyrolysis and combustion kinetics of sludge-camphor pellet
with bituminous coal in two circulating fluidized bed com- thermal decomposition using thermogravimetric analysis.
bustors. Korean J Chem Eng. 2007;24(3):461–5. doi: 10.1007/ Energ Convers Manage. 2015;106:282–9. doi: 10.1016/
s11814-007-0080-0. j.enconman.2015.09.046.
[10] Lee JM, Kim DW, Kim JS. Characteristics of co-combustion of [24] Kok MV. Temperature-controlled combustion and kinetics
anthracite with bituminous coal in a 200-MWe circulating of different rank coal samples. J Therm Anal Calorim.
fluidized bed boiler. Energy. 2011;36(9):5703–9. doi: 10.1016/ 2005;79(1):175–80. doi: 10.1007/s10973-004-0581-6.
j.energy.2011.06.051. [25] Linares-Solano A, Almela-Alarcón M, Lecea CS-Md. CO2 che-
[11] Li Q, Li XH, Jiang JK, Duan L, Ge S, Zhang Q, et al. Semi-coke misorption to characterize calcium catalysts in carbon gasifi-
briquettes: Towards reducing emissions of primary PM2.5, cation reactions. J Catal. 1990;125(2):401–10. doi: 10.1016/
particulate carbon, and carbon monoxide from household 0021-9517(90)90313-9.
coal combustion in China. Sci Rep UK. 2016;6(19306). [26] Marquez-Montesinos F, Cordero T, Rodriguez-Mirasol J,
doi: 10.1038/srep19306. Rodriguez JJ. CO2 and steam gasification of a grapefruit skin
[12] Zhang JP, Jia XW, Wang CA, Zhao N, Wang PQ, Che DF. char. Fuel. 2002;81(4):423–9. doi: 10.1016/S0016-2361(01)
Experimental investigation on combustion and NO formation 00174-0.
characteristics of semi-coke and bituminous coal blends. Fuel. [27] Carroll B, Manche EP. Kinetic parameters from thermogravi-
2019;247:87–96. doi: 10.1016/j.fuel.2019.03.045. metric data. Nature. 1964;201(4914):68–9. doi: 10.1038/
[13] Yang Y, Lu XF, Wang QH. Investigation on the co-combustion of 201068a0.
low calorific oil shale and its semi-coke by using thermogra- [28] Šesták J. Philosophy of non-isothermal kinetics. J Therm Anal
vimetric analysis. Energ Convers Manage. 2017;136:99–107. Calorim. 1979;16(2):503–20. doi: 10.1007/BF01910714.
doi: 10.1016/j.enconman.2017.01.006. [29] Starink MJ. A new method for the derivation of activation
[14] Yao HF, He BS, Ding GC, Tong WX, Kuang YC. energies from experiments performed at constant heating
Thermogravimetric analyses of oxy-fuel co-combustion of rate. Thermochim Acta. 1996;288(1):97–104. doi: 10.1016/
semi-coke and bituminous coal. Appl Therm Eng. S0040-6031(96)03053-5.
2019;156:708–21. doi: 10.1016/j.applthermaleng.2019.04.115. [30] Starink MJ. The determination of activation energy from
[15] Yang GS, Yang ZH, Zhang JL, Yang ZH, Shao JG. Combustion linear heating rate experiments: A comparison of the
characteristics and kinetics study of pulverized coal and semi- accuracy of isoconversion methods. Thermochim Acta.
coke. High Temp Mat PR-ISR. 2019;38:783–91. doi: 10.1515/ 2003;404(1–2):163–76. doi: 10.1016/S0040-6031(03)00144-8.
htmp-2019-0034. [31] Chisato Y, Shinichi S, Syu H, Koji T, Yoshimasa K, Syusaku K,
[16] Wu XX, Radovic LR. Catalytic oxidation of carbon/carbon compo- et al. Fundamental study on combustion of pulverized coal
site materials in the presence of potassium and calcium acetates. injected into coke bed at high rate. ISIJ Int.
Carbon. 2005;43(2):333–44. doi: 10.1016/j.carbon.2004.09.025. 2007;32(6):725–32. doi: 10.2355/isijinternational.32.725.You can also read