The Spatial and Temporal Distribution of Process Gases within the Biowaste Compost - MDPI
←
→
Page content transcription
If your browser does not render page correctly, please read the page content below
data
Data Descriptor
The Spatial and Temporal Distribution of Process
Gases within the Biowaste Compost
Sylwia Stegenta 1, * , Karolina Sobieraj 1 , Grzegorz Pilarski 2 , Jacek A. Koziel 3
and Andrzej Białowiec 1, *
 1   Faculty of Life Sciences and Technology, Wroclaw University of Environmental and Life Sciences, 37a
     Chełmońskiego Str., 51-630 Wrocław, Poland; karolina.sobieraj@upwr.edu.pl
 2   Best-Eko Sp. z o.o., 1 Gwarków Str., 44-240 Żory, Poland; grzegorz.pilarski@best-eko.pl
 3   Iowa State University, Department of Agricultural and Biosystems Engineering, IA 50011-3270, USA;
     koziel@iastate.edu
 *   Correspondence: sylwia.stegenta@upwr.edu.pl (S.S.); andrzej.bialowiec@upwr.edu.pl (A.B.)

 Received: 13 February 2019; Accepted: 25 February 2019; Published: 1 March 2019

 Abstract: Composting is generally accepted as the sustainable recycling of biowaste into a useful and
 beneficial product for soil. However, composting processes can produce gases that are considered air
 pollutants. In this dataset, we summarized the spatial and temporal distribution of process gases
 (including rarely reported carbon monoxide, CO) generated inside full-scale composting piles. In total
 1375 cross-sections were made and presented in 230 figures. The research aimed to investigate the
 phenomenon of gas evolution during the composting of biowaste depending on the pile turning
 regime (no turning, turning once a week, and turning twice a week) and pile location (outdoors, and
 indoors in a composting hall). The analyzed biowaste (a mixture of tree leaves and branches, grass
 clippings, and sewage sludge) were composted in six piles with passive aeration including additional
 turning at a municipal composting plant. The chemical composition and temperature of process gases
 within each pile were analyzed weekly for ~49–56 days. The variations in the degree of pile aeration
 (O2 content), temperature, and the spatial distribution of CO, CO2 and NO concentration during the
 subsequent measurement cycles were summarized and visualized. The lowest O2 concentrations
 were associated with the central (core) part of the pile. Similarly, an increase in CO content in the pile
 core sections was found, which may indicate that CO is oxidized in the upper layer of composting
 piles. Higher CO and CO2 concentrations and temperature were also observed in the summer season,
 especially on the south side of piles located outdoors. The most varied results were for the NO
 concentrations that occurred in all conditions. The dataset was used by the composting plant operator
 for more sustainable management. Specifically, the dataset allowed us to make recommendations
 to minimize the environmental impact of composting operations and to lower the risk of worker
 exposure to CO. The new procedure is as follows: turning of biowaste twice a week for the first two
 weeks, followed by turning once a week for the next two weeks. Turning is not necessary after four
 weeks of the process. The recommended surface-to-volume ratio of a compost pile should not exceed
 2.5. Compost piles should be constructed with a surface-to-volume ratio of less than 2 in autumn and
 early spring when low ambient temperatures are common.

 Dataset: Submitted as the supplementary file at: https://www.mdpi.com/2306-5729/4/1/37/s1.

 Dataset License: CC-BY

 Keywords: biomass; agricultural residues; organic waste; sewage sludge; municipal waste; waste
 management; composting; aeration; emissions; carbon monoxide; greenhouse gases; carbon cycle;
 nitrogen cycle

Data 2019, 4, 37; doi:10.3390/data4010037                                          www.mdpi.com/journal/data
Data 2019, 4, 37                                                                                    2 of 7

1. Summary
      Limited public awareness and the recent increase in consumption are contributing to the excessive
exploitation of natural resources and modification of the environment, which includes the production
of larger amounts of biowaste. The term ‘biowaste’ encompasses a wide variety of bio-based materials
such as the organic fraction of municipal solid waste, yard waste (grass clippings, leaves, and wood
residues), and sewage sludge. All these are abundant, especially in urban settings, and can present
challenges for proper collection, treatment, and disposal. The most common method of biowaste
treatment is composting. Composting processes result in the reduction of volume and weight of waste
intended for final disposal (e.g., landfill). Composting can also be used to produce organic fertilizer.
Current EU goals aim to phase out landfill and instead focus on ‘zero waste’ and ‘circular economy’
objectives consistent with sustainable development. Thus, policy pressure will increasingly be applied
to improve and optimize common biowaste composting practices to align with the above goals.
      Gaseous emissions from compost operations are important for several reasons. They can impact
local and regional air quality via emissions of volatile organic compounds (VOCs) and odor. Stegenta
et al. [1] reported that full-scale municipal waste composting operations release other air pollutants
such as CO, CO2 , NH3 , NO, NO2 , SO2 , and H2 S, counted as greenhouse gases, odors, and fine
particulate matter (PM2.5) precursors. Thus, it is reasonable to consider spatial and temporal variations
of process gases that could be mitigated to lower the risk of worker exposure and for more sustainable
composting. The chimney effect and its influence on thermal conditions and the degree of aeration have
been studied [2,3]. The presence of CO in gases emitted from composting piles has been reported [4–8].
The distribution of CO in composting piles and the influence of the turning regime on CO formation
has not yet been studied. Gases generated inside compost can also provide useful information about
the status of the biomass decay process and could potentially be exploited to optimize and control
the process. The concept of using compost gases for the non-invasive, biosecure monitoring of decay
process completion has been used for disposal of potentially infectious animal carcasses [9–15].
      The quantitative detection of gases emitted from fugitive and area sources (such as composting
operations) to the environment is important to develop, optimize and implement composting
technologies, and improve emission models and air quality inventories. To date, relatively little
is known about gaseous emissions (especially CO) from composting, specifically in systems with
passive aeration. We hypothesized that the CO spatial distribution depends on the composting pile
turning regime and is correlated with temperature, O2 , and CO2 distribution. We also hypothesized
that the measurement of the temporal and spatial variations of temperature and process gases might
be a useful tool for observing the organic matter stabilization. In addition, the resulting dataset
may enable the optimization of biowaste composting, which increases the rate of organic matter
decomposition while lowering process gas generation.
      Therefore, the research aimed to investigate the phenomenon of gas evolution during the
composting of biowaste depending on the pile turning regime (no turning, turning once a week,
and turning twice a week), and pile location (outdoors and inside a composting hall). The analyzed
biowaste (a mixture of tree leaves and branches, grass clippings, and sewage sludge) were composted
in six piles with passive aeration. The chemical composition and temperature of the process gases
of each pile were analyzed weekly for ~49–56 days. The variations in the degree of pile aeration
(O2 content), temperature, and the spatial distribution of CO, CO2 and NO concentrations during the
subsequent measurement cycles were summarized and visualized.
      The emission of NO was the most varied and occurred in all conditions. There was no noticeable
impact of turning and no apparent trend towards greater gas generation in larger piles. The lowest
O2 concentrations were associated with the central (core) part of the pile. Higher CO and CO2
concentrations and temperature were observed in the summer season, especially on the south side of
piles located outdoors.
      The dataset (consisting of 230 figures, and the raw data in the Excel spreadsheet in the
supplementary materials) highlights the effect of different turning regimes and pile location on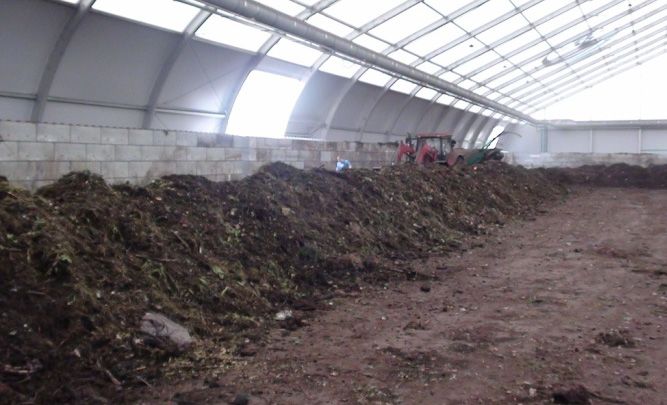
Data 2019, 4, 37                                                                                  3 of 7

the spatial and temporal distribution of O2 , CO, CO2 , NO and temperature within the compost.
The dataset can also allow a more accurate understanding of the N and C transformations in the
composted material, which in turn can be potentially explored to mitigate gaseous emissions from the
process. The obtained data can be used to derive some technological recommendations for composting
plant management. Examples of recommendations include:

(a)   The frequency of turning for a particular phase of composting.
(b)   The volume-to-surface ratio for different environmental conditions (e.g.,               ambient
      temperature, seasons)

     This research can help in developing improved and environmentally-friendly methods for
composting process management. The data may be relevant for composting optimization and further
research that focuses on increasing the efficiency of the composting process.
     Two main limitations associated with data acquisition and processing were identified. First,
the measurements were time- and labor-consuming due to the full-scale size of the composting piles
and the logistics of working at a large composting plant. Only two piles were examined per day by
one three-member team. One possible solution to overcome this problem is to budget for additional
properly-trained teams with analyzers that could be collecting data simultaneously. Another possible
solution is to perform statistical analyses to determine if it is possible to limit the density and the
number of samples collected and still represent the spatial and temporal variations of the composting
process. The permanent installation of stainless steel probes is not possible due to the turning of the
piles. The second limitation was the labor-consuming data processing, namely transferring the data
to the Surfer software. More user-friendly software allowing dynamic modeling and visualization
of the spatial distribution of temperature and gases in the composting piles within the timeframe in
both 2D and 3D modes would be useful. It would bring new insights into the process monitoring
and optimization.
     Further full-scale research on the temperature and the spatial distribution of gases, especially
with regard to the influence of the operational regime—turning frequency, pile size, pile moisture
content, and waste type (biodegradability)—on CO (as a primary air pollutant) should be continued.
The next experiment should include the measurement of additional gases—CH4 , NH3 , H2 S, N2 O,
and VOCs—to produce a better understanding of the C and N cycle. In addition, the microbial
characteristics and activity (e.g., the biodiversity of microbial population dynamics, respiration
activity, and carbon monoxide dehydrogenase expression) should be studied. Finally, the compost
matrix measurements should be complemented by surface temperature and gas emission distribution
measurements. This would allow the creation of a holistic model for C and N in compost. It could
allow the building of a multicriteria model for the optimization of biowaste composting to increase the
organic matter decay rate while mitigating pollutant emissions.

2. Data Description
      An example of the data visualization is provided in Figure 1. The figures presented in the
supplementary materials (Figures.zip) summarize visualizations of the degree of pile aeration
(O2 concentrations), temperature, CO, CO2 , and NO concentrations and their spatial distribution
variations during measurement cycles. For each of the six piles, four cross-sections and two
longitudinal cross-sections (left and right side of the pile) were made. In total 1375 cross-sections
were made and are presented in 230 figures. Figures S1–S46 summarize the spatial and temporal
distribution of temperature in piles S1–S6. Figures S47–S92 summarize the spatial and temporal
distribution of O2 . Figures S93–S138 summarize the spatial and temporal distribution of CO2
concentrations. Figures S139–S184 summarize the spatial and temporal distribution of CO. Figures
S185–S230 summarize the spatial and temporal distribution of NO. The raw data are also summarized
in a separate file (Table S1.xlsx).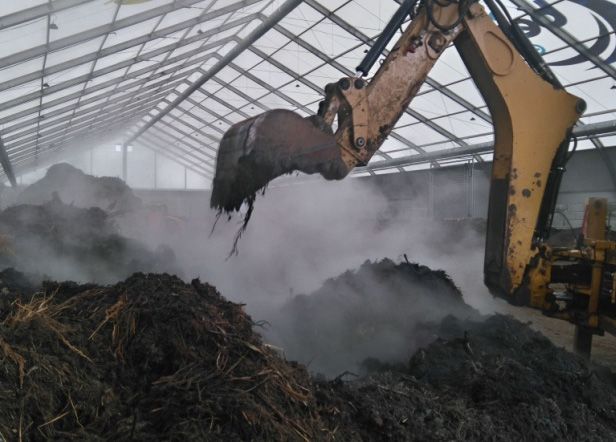
Data 2019, 4, 37
x FOR PEER REVIEW 44 of
of 7
Data 2019,
Data 2019, 4,
4, xx FOR
FOR PEER
PEER REVIEW
REVIEW 44 of
of 77
145
145
145
146 Figure 1.1.Example
Exampleof of the spatial distribution
of O2 ,of O2CO, CO, COCross-sectional
2, NO. Cross-sectional areas of the
146
146
147
Figure
Figure 1.
Figure
monitored
1. Example
Example of
compost
the spatial
of the
the
piles
distribution
spatial
spatial
are
distribution
distribution
presented in 230
CO,
of
of O
figures
2 , NO.
O22,, CO,
CO, CO22,, NO.
CO
summarizing
areas of the
NO. Cross-sectional
Cross-sectional
the spatial
monitored
areas
areas
and
of the
of
temporal
the
147 compost piles are presented in 230 figures summarizing the spatial and temporal distributions of gas
147
148 monitored compost
monitored compost
distributions
concentrations ofand
piles are presented
piles are presented
gas temperatures.
concentrations
in 230 figures summarizing the spatial
in 230 figures summarizing the spatial and temporal
and temperatures.
and temporal
148
148 distributions of
distributions of gas
gas concentrations
concentrations and and temperatures.
temperatures.
149 3. Methods
149
149 3. Methods
3. Methods
150 The evolution
evolutionof of
gasgasandand
temperature (analyzed
temperature using ausing
(analyzed Kigaz 300 provided
a Kigaz 300 by Kimo Instruments,
provided by Kimo
150
150
151 The
The evolution
evolution
Chevry-Cossigny, of
of gas
gas and
and temperature
temperature
France) duringFrance)
Instruments, Chevry-Cossigny, the composting (analyzed
(analyzed
during the
using
using
of composting aa
biowaste dependingKigaz
Kigaz
of biowaste
300
300
on the provided
provided byregime
onbythe
pile turning
depending
Kimo
Kimo
pile
151
151
152 Instruments,
Instruments,
(no turning,
turning regime
Chevry-Cossigny,
Chevry-Cossigny,
turning once a week,
(no turning,
France)
France)
turning
duringtwice
during
andonce
turning
a week,
the composting
the composting
a week)
and
of biowaste
of
(Figure
turning
biowaste
twice2),a and depending
depending
pile
week) location
(Figure
on
on
2),
the pile
the pile
(outdoors
and pile
152
152
153 turning
turning
and regime
regime
inside
location
(no turning,
(noand
turning,
a composting
(outdoors
turning
hall)turning
inside a(Figure
once
once
3) a week,
wasahall)
composting week, and turning
and turning
investigated.
(Figure
twice a week) (Figure 2), and
twice a week) (Figure 2), and pile
3) was investigated.
pile
153
153 location (outdoors
location (outdoors and
and inside
inside aa composting
composting hall)
hall) (Figure
(Figure 3)
3) was
was investigated.
investigated.
154
154
154 (a) (b)
(a)
(a) (b)
(b)
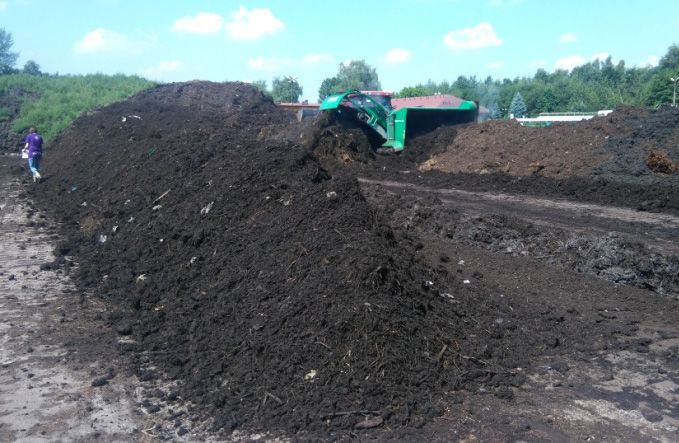
155 Figure 2. Turning of the compost material (a) pile A2 outdoors; (b) pile A5 inside a composting hall.
155
155 Figure 2.
Figure
Figure 2. Turning
2. Turning of
Turning of the
of the compost
the compost material
compost material (a)
material (a) pile
(a) pileA2
pile A2outdoors;
A2 outdoors;(b)
outdoors; (b)pile
(b) pileA5
pile A5inside
A5 insideaaacomposting
inside compostinghall.
composting hall.
hall.
156
156
156
(a) (b)
(a)
(a) (b)
(b)
157 Figure
Figure 3. Composted biowaste
3. Composted biowaste at
at the
the beginning
beginning of
of the
the process
process in
in piles
piles located
located (a)
(a) outdoors;
outdoors; (b)
(b) indoors
indoors
157
157
158 Figure
Figure
in the 3.Composted
3. Composted
composting biowasteat
biowaste
hall.
in the composting hall.
atthe
thebeginning
beginningof
ofthe
theprocess
processininpiles
pileslocated
located(a)
(a)outdoors;
outdoors;(b)
(b)indoors
indoors
158
158 in the composting hall.
in the composting hall.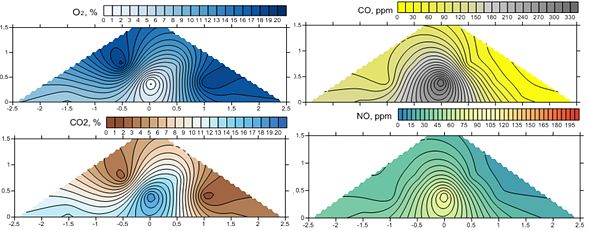
Data 2019, 4, x FOR PEER REVIEW                                                                                                   5 of 7

159         The analyzed biowaste (a mixture of tree leaves and branches, grass clippings, and sewage
160    sludge in volumetric proportion 4:2:1, respectively) were composted in six piles with passive aeration
161    including
      Data          additional turning. The experimental design and methods used to acquire the data, 5such
           2019, 4, 37                                                                                             of 7
162    as the characteristics of the composted waste, physicochemical properties of the pile components, the
163    dimensions of the tested piles, placement of measurement points in the piles and detailed information
            The analyzed biowaste (a mixture of tree leaves and branches, grass clippings, and sewage
164    of the test configurations are presented in the research article [16]. Briefly, the experimental design is
      sludge in volumetric proportion 4:2:1, respectively) were composted in six piles with passive aeration
165    presented in Table 1.
      including additional turning. The experimental design and methods used to acquire the data, such
      as the characteristics of the composted waste, physicochemical properties of the pile components,
166         Table 1. The configuration of the experiment design, data acquisition cycles and a number of collected
167   the dimensions         of the tested piles, placement of measurement points in the piles and detailed
            gaseous concentration samples and temperature measurements (Measurements were conducted
168   information
            from July  of the test configurations
                           to December,   2017). are presented in the research article [16]. Briefly, the experimental
      design is presented in Table 1.
                                                                   Number of          Number of          Number of           Number of
                 Process
                         Turning
                  1. The configuration   oflocation    temperature
                                            the experiment design,and      samplingcycles and
                                                                   data acquisition       sampling
                                                                                               a number collected samples
                                                                                                         of collected
       PileTable
               time,                  Pile
                          regime                      gaseous sampling       cross-     points in each    of temperature
                daysconcentration samples and temperature measurements (Measurements were conducted from
           gaseous
                                                           cycles           sections    cross-section         and gas
           July to December,   2017).
                         2 times a
        A1         50                          Outdoor                  8                  4                  7                  224
                              week
                                                                      Number of                          Number of           Number of
                   Process   1 time   a                                                Number of
                                    Turning                         Temperature and                    Sampling Points   Collected Samples
        A2Pile     57Time,          Regime     Outdoor
                                                   Pile Location       8
                                                                       Gaseous              4
                                                                                       Sampling                7
                                                                                                           in Each                224 and
                                                                                                                         of Temperature
                     Days     week                                                    Cross-Sections
                                                                    Sampling Cycles                     Cross-Section           Gas
        A3         52         None              Indoor                  8                  4                  7                  224
          A1          50        2 times a week       Outdoor                8               4                 7                224
        A4A2       52 57      None
                                1 time a week OutdoorOutdoor            8   8              44                 77                 224
                                                                                                                               224
          A3            52   1 time aNone             Indoor                8              4                  7                224
        A5A4       50 52             None Outdoor/indoor
                                                     Outdoor            8   8              44                 77                 224
                                                                                                                               224
          A5            50    week
                                1 time a week     Outdoor/indoor            8              4                  7                224
          A6            50   1 time
                                1 timea a week        Indoor                8              4                  7                224
        A6
         Total     50311               -        Indoor   -              8   48             44                 77                 224
                                                                                                                               1344
                              week
       Total      311             -                -                   48                  4                  7                 1,344
           The chemical composition and temperature of the process gases in each pile were analyzed weekly
169        The chemical composition and temperature of the process gases in each pile were analyzed
      for ~49–56 days with the application of a stainless steel probe capable of collecting and analyzing gas
170    weekly for ~49–56 days with the application of a stainless steel probe capable of collecting and
      samples from within piles. A flue gas analyzer Kigaz 300 by (Kimo Instruments, Chevry-Cossigny,
171    analyzing gas samples from within piles. A flue gas analyzer Kigaz 300 by (Kimo Instruments,
      France) equipped with electrochemical sensors (O2 , CO2 , CO, and NO) and thermocouple was used
172    Chevry-Cossigny, France) equipped with electrochemical sensors (O2, CO2, CO, and NO) and
      (Figure 4).
173    thermocouple was used (Figure 4).

174
             Figure 4. Gas (O2 , CO, CO2 , NO) concentrations and temperature measurements at a full-size
175          Figure 4. Gas (O2, CO, CO2, NO) concentrations and temperature measurements at a full-size
             composting operation processing biowaste (a mixture of leaves, branches, grass clippings, and sewage
176          composting operation processing biowaste (a mixture of leaves, branches, grass clippings, and sewage
             sludge). A perforated stainless steel gas probe was introduced into a pile at predetermined depths and
177          sludge). A perforated stainless steel gas probe was introduced into a pile at predetermined depths
             cross-sections. Red points show the position of gas and temperature sampling points. The schematic
178          and cross-sections. Red points show the position of gas and temperature sampling points. The
             probe for measuring the chemical composition of the gas and temperatures in a pile combined with the
179          schematic probe for measuring the chemical composition of the gas and temperatures in a pile
             analyzer unit is provided.
180          combined with the analyzer unit is provided.
           The variations in the degree of pile aeration (O2 content), temperature, and the spatial distribution
      of CO, CO2 and NO concentration during the subsequent measurement cycles were summarized and
      visualized. On the basis of the results (measurements at 28 points in each pile), visualizations of the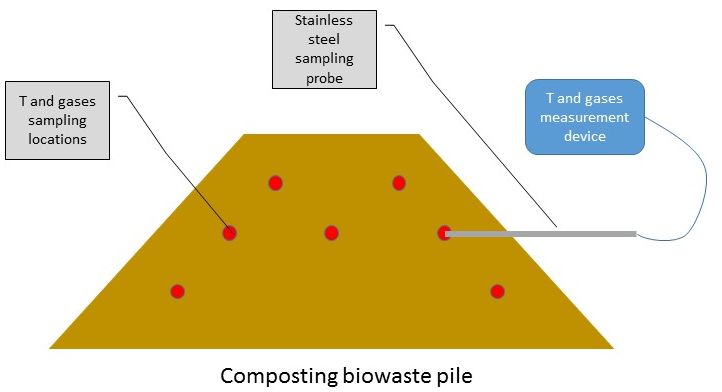
Data 2019, 4, 37                                                                                                   6 of 7

spatial distribution of the gas concentrations (CO, CO2 , O2 and NO) and temperature distribution
in the piles was performed using the Surfer 10 software by Golden Software (estimation based on
created value nets) and an example of the results is shown in Figure 1. Four cross-sections and two
longitudinal cross-sections (left and right side of the pile) were made for each of the six piles.

Supplementary Materials: File 1: Table S1.xlsx contains Table S1. Summary of O2, CO, CO2, NO concentration
and temperature within the composting process.; File 2: Figures.zip contains files (Figures S1–S230.pdf) with a
graphical visualization of temperature and gases distribution during composting. Figure captions are included in
the Figure-captions-Data.docx file.
Author Contributions: Conceptualization, A.B., S.S., G.P.; methodology, A.B., S.S, G.P.; formal analysis, A.B., J.K.;
validation, A.B., G.P. J.K.; investigation, S.S. K.S. resources, K.S., S.S., data curation, A.B., K.S.; writing—original
draft preparation, K.S., S.S., writing—review and editing, A.B., G.P., J.K.; visualization, K.S., supervision, A.B., J.K.
Funding: This work was supported by the Best-Eko Sp. z o.o. (Poland) as the research program ‘Selection of
substrates based on BEST-TERRA compost and composting technology at the composting plant at Boguszowice
sewage treatment plant’, No. B090/0010/17. Authors would like to thank the Fulbright Foundation for funding
the project titled “Research on pollutants emission from carbonized refuse derived fuel into the environment”,
completed at Iowa State University. In addition, the preparation of this paper was partially supported by the Iowa
Agriculture and Home Economics Experiment Station, Ames, Iowa. Project no. IOW05556 (Future Challenges in
Animal Production Systems: Seeking Solutions through Focused Facilitation) sponsored by Hatch Act and State
of Iowa funds.
Conflicts of Interest: The authors declare no conflict of interest. The funders had no role in the design of the
study; in the collection, analyses, or interpretation of data; in the writing of the manuscript; or in the decision to
publish the results.

References
1.    Stegenta, S.; D˛ebowski, M.; Bukowski, P.; Randerson, P.F.; Białowiec, A. The influence of perforation of
      foil reactors on greenhouse gas emission rates during aerobic biostabilization of the undersize fraction of
      municipal wastes. J. Environ. Manag. 2018, 207, 355–365. [CrossRef] [PubMed]
2.    Norstedt, R.A.; Barkdoll, A.W.; Schroeder, R.M. Composting of yard wastes. Science and Engineering
      of Composting: Design, Environmental and Utilization Aspects. In Proceedings of the International
      Composting Research Symposium, Columbus, OH, USA, 27–29 March 1992; pp. 154–167.
3.    Haga, K.; Osada, T.; Harada, Y.; Izawa, T.; Nishimura, Y. Constituents of the anaerobic portion occurring in
      the pile during composting of cattle wastes. J. Soc. Agric. Struct. Jpn. 1998, 29, 125–130. [CrossRef]
4.    Haarstad, K.; Bergersen, O.; Sorheim, R. Occurrence of carbon monoxide during organic waste degradation.
      J. Air Waste Manag. Assoc. 2006, 56, 575–580. [CrossRef] [PubMed]
5.    Hellebrand, H.J.; Schade, G.W. Carbon monoxide from composting due to thermal oxidation of biomass.
      J. Environ. Qual. 2008, 37, 592. [CrossRef] [PubMed]
6.    Stegenta, S. The Abiotic and Biotic Determinants of Carbon Monoxide Emissions during Composting Process.
      Ph.D. Thesis, Wrocław University of Environmental and Life Sciences, Wrocław, Poland, 2018.
7.    Hellebrand, H.J.; Kalk, W.D. Emission of carbon monoxide during composting of dung and green waste.
      Nutr. Cycl. Agroecosyst. 2001, 60, 79–82. [CrossRef]
8.    Rich, J.J.; King, G.M. Carbon monoxide consumption and production by wetland peats. FEMS Microbiol.
      Ecol. 1999, 28, 215–224. [CrossRef]
9.    Akdeniz, N.; Koziel, J.A.; Ahn, H.K.; Glanville, T.D.; Crawford, B.; Raman, R.D. Air sampling and analysis
      method for VOCs in field-scale mortality composting operations. J. Agric. Food Chem. 2009, 57, 5658–5664.
      [CrossRef] [PubMed]
10.   Akdeniz, N.; Koziel, J.A.; Ahn, H.K.; Glanville, T.D.; Crawford, B.; Raman, R.D. Laboratory scale
      evaluation of VOC emissions as indication of swine carcass degradation inside biosecure composting
      units. Bioresour. Technol. 2010, 101, 71–78. [CrossRef] [PubMed]
11.   Akdeniz, N.; Koziel, J.A.; Ahn, H.K.; Glanville, T.D.; Crawford, B.P. Field scale evaluation of volatile organic
      compound production inside biosecure swine mortality composts. Waste Manag. 2010, 30, 1981–1988.
      [CrossRef] [PubMed]
Data 2019, 4, 37 7 of 7
12. Akdeniz, N.; Koziel, J.A.; Glanville, T.D.; Ahn, H.K.; Crawford, B.P. Air sampling methods for VOCs related
to field-scale biosecure swine mortality composting. Bioresour. Technol. 2011, 102, 3599–3602. [CrossRef]
[PubMed]
13. Glanville, T.D.; Ahn, H.K.; Akdeniz, N.; Crawford, B.P.; Koziel, J.A. Performance of a plastic-wrapped
composting system for biosecure emergency disposal of disease-related swine mortalities. Waste Manag.
2016, 48, 483–491. [CrossRef] [PubMed]
14. Koziel, J.A.; Ahn, H.K.; Glanville, T.D.; Frana, T.S.; van Leeuwen, H.; Nguyen, L.T. Lab-scale evaluation of
aerated burial concept for treatment and emergency disposal of infectious animal carcasses. Waste Manag.
2018, 76, 715–726. [CrossRef] [PubMed]
15. Koziel, J.A.; Ahn, H.K.; Glanville, T.D.; Frana, T.S.; van Leeuwen, H.; Nguyen, L.T. Data evidencing slow
anaerobic digestion in emergency treatment and disposal of infectious animal carcasses. Data Brief 2019, 22,
227–233. [CrossRef] [PubMed]
16. Stegenta, S.; Sobieraj, K.; Pilarski, G.; Koziel, J.A.; Białowiec, A. The analysis of spatial distribution of process
gases within a pile during composting of biowaste. Sustainability 2019, forthcoming.
© 2019 by the authors. Licensee MDPI, Basel, Switzerland. This article is an open access
article distributed under the terms and conditions of the Creative Commons Attribution
(CC BY) license (http://creativecommons.org/licenses/by/4.0/).You can also read