BY THE NUMBERS CITY OF SCHENECTADY - PREPARED FOR MAYOR GARY MCCARTHY BY HEATHER A. IPSEN
←
→
Page content transcription
If your browser does not render page correctly, please read the page content below
City of Schenectady
By the Numbers
January 2021 Monthly Report

                              Prepared for Mayor Gary McCarthy
                                             By Heather A. Ipsen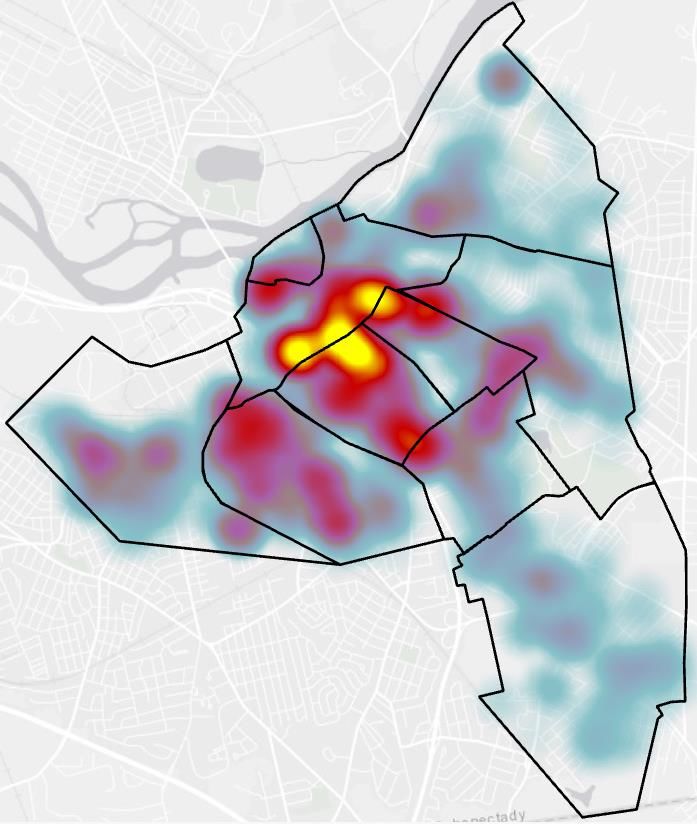
Table of Contents

                       This Photo by Unknown Author is licensed under CC BY-SA

City Services Data
   •   City Energy Use & Waste Collection                                  p.3-4
   •   Vehicle Fleet/EV charging                                           p.5-6
   •   Website Data                                                        p.7-8
   •   Engineering Capital Projects________________________________________p.9-10
Public Safety Data
   • Fire Dept.                                                                  p.11-12
   • Police Dept.                                                                p.12-15

Property Information
   • Receipts                                                                    p.16-17
   • Code Enforcement                                                            p.18-19
   • Property Sales/Ownership                                                    p.20-21

Data Sources
   • All Report Sources                                                          p.22

January 2021                                                                               2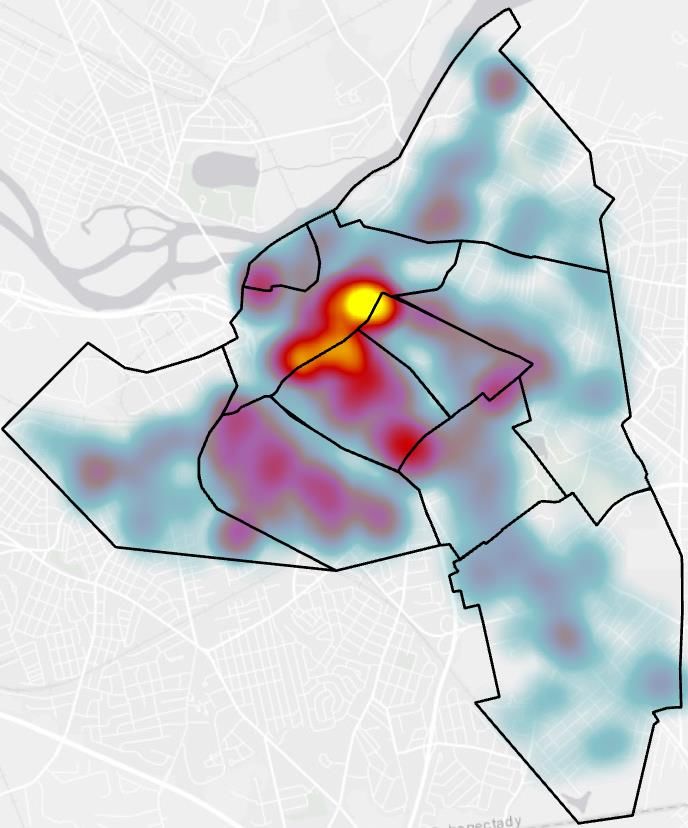
City Services Data

      City Energy Use [1]

      Total electricity use in January 2021 for the City’s main energy-using facilities has been
      slightly lower than in January 2020, with the exception of the Wastewater Treatment
      Plant (WWTP), where electricity use increased by about 32%. Gas use increased by
      about 5% at both the Police Department (PD) and the WWTP, whereas it decreased
      by 9% in City Hall. Electricity delivery costs have been on the rise, and as a result, total
      costs increased for each facility: by 9% for City Hall, by 101% for the PD, and by 119%
      for the WWTP. The WWTP usually receives credits from the Bevis Hill solar array, which
      reduces the monthly cost of electricity to power the facility; however, due to
      transformer replacement, that amount has not been subtracted from the WWTP bill
      since June 2020. Replacement has occurred and the City should be getting credits
      again soon.

                                  Electric (kWh)       Gas (Therms)      Costs ($)
                Year                2020       2021     2020    2021       2020            2021
                City Hall          25,360     22,080    6,533   5,948     $4,226          $4,600
                PD                 73,600     69,200    4,581   4,810     $4,820          $9,718
                WWTP              304,837 402,481       8,826   9,261    $15,742         $34,527
                Totals            403,797 493,761      19,940 20,019     $24,788         $48,845

                  Electricity Use (kWh)                                 Gas Use (Therms)
                     2020 vs. 2021                                       2020 vs. 2021
 450,000                                                10,000
 400,000                                                 9,000

 350,000                                                 8,000

 300,000                                                 7,000

                                                         6,000
 250,000
                                                         5,000
 200,000
                                                         4,000
 150,000
                                                         3,000
 100,000
                                                         2,000
  50,000                                                 1,000

      0                                                     0
               City Hall           PD       WWTP                 City Hall          PD             WWTP

                           2020    2021                                      2020    2021

January 2021                                                                                              3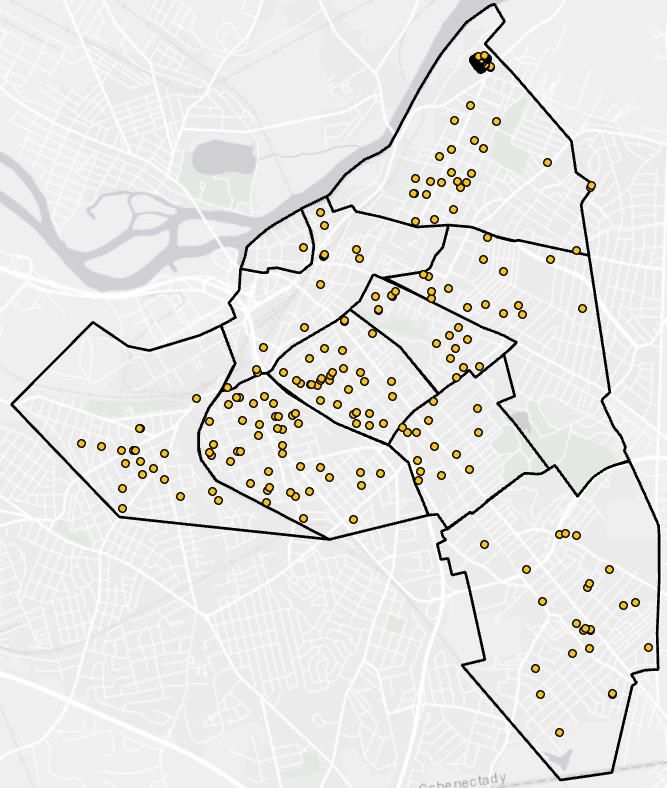
City Services Data

Waste & Recycling Collection [2]

          Waste & Recycling Tonnages in January
                       2019-2021
 2500
                                        2,298
                                                2,218 2,189
                                                                         Waste collection totals went
 2000
                                                                         down very slightly in January 2021
                                                                         as compared to January 2020
 1500                                                                    and 2019. This month the recycling
                                                                         tonnage collected was 7% higher
                                                                         than in January of last year.
 1000

  500
               216 224 239

    0
                 Reycling                    Waste

                        2019   2020   2021

                                                            Total Waste & Recycling Cost in January
                                                                           2019-2021
                                                 $180,000
The total spent on waste and                                   $166,059.12
recycling collection was essentially             $160,000
the same in January 2021 as it was in
January 2020. That said, total costs             $140,000

decreased by 36% as compared to                  $120,000
January 2019. The decline in                                                    $106,119.24   $105,862.70
expenses in 2020 and 2021 was a                  $100,000
result of a new contract deal with the
                                                  $80,000
waste processing company, which
lowered the City’s solid waste                    $60,000
disposal rate by almost 50% starting in
April 2019. New contract prices will              $40,000

be negotiated again in April 2021.                $20,000

                                                       $0
                                                                  2019             2020          2021

January 2021                                                                                                  4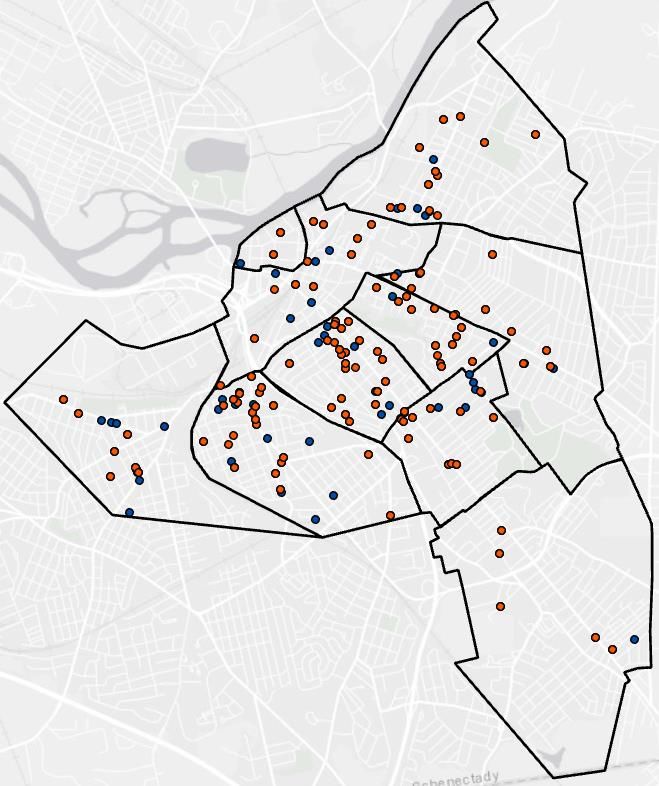
City Services Data

Vehicle Fleet - Electric Vehicle (EV) Charging [3]

  January Quick Stats
     • Average Session Length: 11hr 3min                      January             2020       2021
     • Total Sessions: 220                                    Energy (kWh)        3,497      2,196
     • Unique Drivers: 54                                     GHG savings (kg)    1,469       963
     • Dispensed Energy: 2,196 kWh
                                                              No. of Sessions      379        220
     • Average Cost to City (per month): $114

        As compared to January 2020, the City dispensed 37% less energy and as a result,
        accrued 34% kilograms fewer in GHG savings in January 2021. Ten new stations were
        installed behind City Hall, however, so both totals should go rise as drivers make use of
        these stations.

                                      Public Station Usage (kWh)
                                             2020 vs. 2021
 1400       1,245
 1200
 1000
  800               644                          624
  600
  400                                                  298                                 252
                              224
  200                               120                                   92         134
                                                                     75
    0
           LIBERTY-YATES   UPPER UNION LOT       CITY HALL         CENTRAL PARK     ERIE BLVD

                                               2020    2021

   As in January 2021, the station in the Liberty Street parking lot station continues to be the
   most utilized in 2021 so far, followed by the station next to City Hall. The Central Park and
   Erie Boulevard stations have also gained popularity this year as compared to last, while
   the Upper Union lot and City Hall stations have been used less.

January 2021                                                                                         5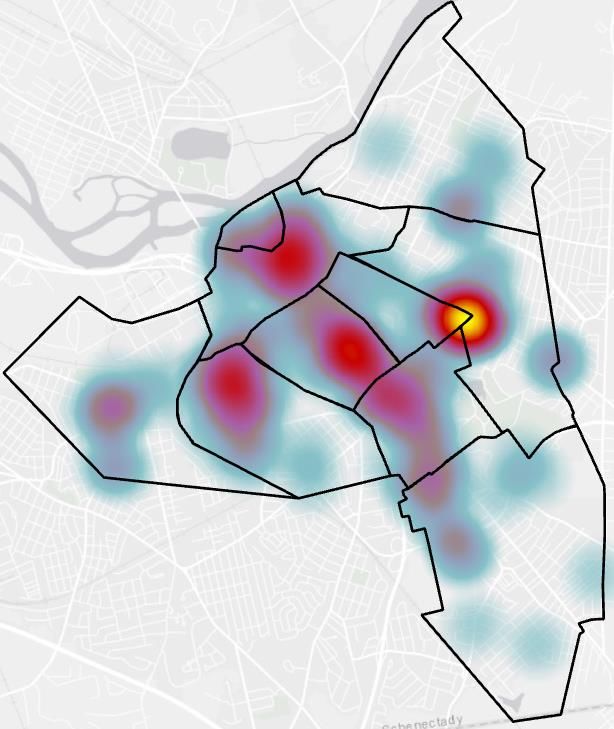
City Services Data

Vehicle Maintenance & Fuel Transactions [4]

The City of Schenectady pays Schenectady County fees                                              Total Costs
associated with vehicle maintenance. In 2020, the City spent                                         2020
$238,180 on actual maintenance to vehicles from all                              Maintenance
                                                                                                      $238,180
departments, with the average cost of about $19,850 per                          (All Depts.)
month. Fire and Police departments spend the most money                          Additional
on vehicle maintenance each month, with an average                                                    $217,292
                                                                                 (County)
monthly cost of about $6,500 and $9,430, respectively.
Schenectady County charged the City $217,292 in additional                       TOTAL                $455,472
fees for vehicle maintenance in 2020, for a total expenditure
of $455,472 on vehicle maintenance.

                                  All Vehicle Maintenance Spending by Month
                                                    2018-2020
 $90,000
 $80,000
 $70,000
 $60,000
 $50,000
 $40,000
 $30,000
 $20,000
 $10,000
      $-
              Jan      Feb       Mar    Apr    May       Jun      Jul      Aug    Sep    Oct    Nov    Dec

                                               2018        2019         2020

           County Charges vs. City Maintenance Costs
                          2018-2020
 $600,000                                                                 As compared to the total spent in
               $503,671
 $500,000
                                                                          previous years, the City spent much
                                                                          less on maintenance overall in
                      $379,652
 $400,000                          $346,589                               2020. That said, maintenance
                                         $314,910                         spending was higher between
 $300,000
                                                      $238,180            August and December 2020 than it
                                                            $217,292
 $200,000                                                                 was for those months in 2019.
                                                                          County costs are consistently more
 $100,000
                                                                          than 40% of total maintenance
       $-                                                                 spending, and this year it was
                    2018               2019               2020            nearly 50%.
                    City Maintenance     Extra Charges

January 2021                                                                                                    6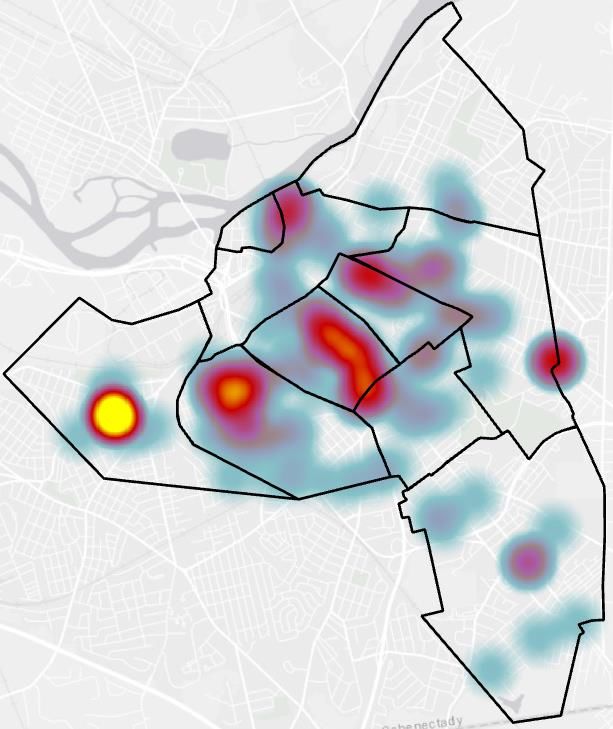
City Services Data

City Website Data [5]

  January Quick Stats                                    Top Page Visits              2020   2021
     • Unique Visitors: 40,987                           (January)
     • Average Visit Duration: 2min 10sec                Waste Collection             9,201 11,966
     • Top Visited Page: Waste Collection                Garbage & Recycling          2,043  2,719
     • Mode of Visitation: Smartphone (54%)              Tax Payments                 2,879  4,014
     • Primary Visitor Locations: Schenectady,           Police Dept.                 2,472  1,815
       Brooklyn                                          COVID-19 Info                    0  1,695

         In January 2021, there were more total unique visitors to the website than there were in
         January 2020, with over 60% more new people visiting the site this year than last. Most
         people now visit our site via smartphone (54%), but many visit via desktop computers
         as well (40%). Those who visit the site are also primarily located in Schenectady or
         Albany, though there was an uptick in visitors from Brooklyn, NY this month. Users spend
         an average of 2.1 minutes per visit on our site. Top page views are consistent between
         January of this year and January of last year as well, except for the COVID-19 page,
         since it did not exist in January 2020.

                                  Unique Visitors in January
                                            2019-2021
 45000                                                                      40,987
 40000
 35000
 30000
                                                25,289
 25000              22,943
 20000
 15000
 10000
  5000
     0
                     2019                        2020                          2021

January 2021                                                                                         7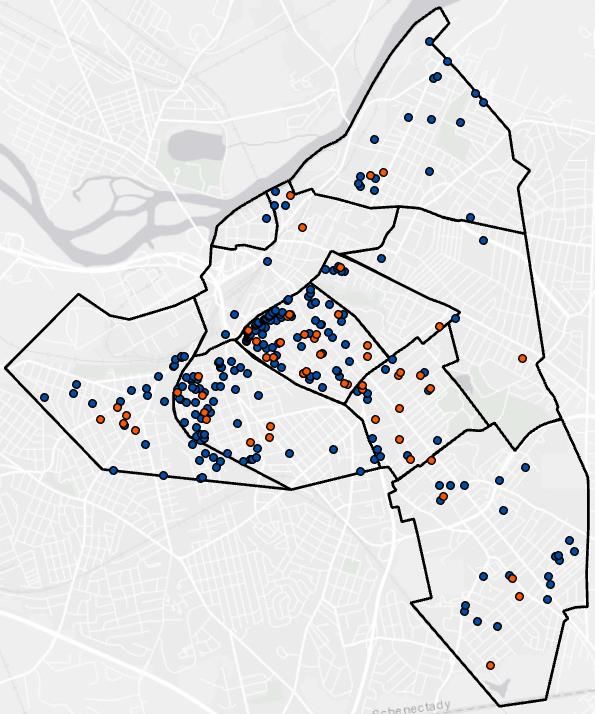
City Services Data

      Citizen Request Tracker

      In January 2021, the Utilities Department received the most requests, with 5 total,
      followed by the Bureau of Services, with 4 total. As a reminder, many requests are
      reassigned to the appropriate department after they are received, and their closing
      times will vary. As of the end of January 2020, all submitted requests were closed
      through the Request Tracker portal. Locations of all these requests are approximated
      in the map below, provided by Civic Plus. In 2021 so far, 11 requests were submitted by
      residents, which is much less than in previous years.

               Department            New
                                   Requests
        Utilities                             5
        Bureau of Services                    4
        Parks/SNAP                            1
        Engineering                           1
        Total                                11

                                      Total Requests in January
                                              2017-2021
                   30                 28

                   25                             23
                                                              21
                   20       18

                   15
                                                                     11
                   10
                   5
                   0
                            2017      2018        2019        2020   2021

January 2021                                                                                8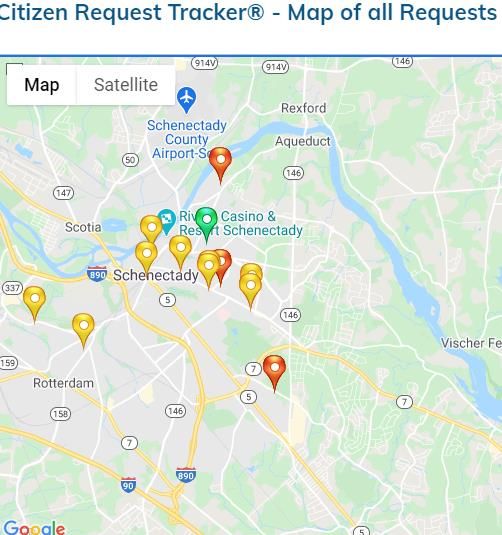
City Services Data

Engineering Capital Projects [6]

In Design

                                                                                                     Active
   Project Name                    Project Description                         Notes                 Budget
                                                                                                      ($M)
 PIN 1758.00 - Erie   Continuation of the 2016 Federal Aid              New overhead sign        -
 Blvd/Nott St.        project.                                          under review by
 Intersection Imp.                                                      DOT
 PIN 1758.95 -        A Federal Aid project to replace the existing     ROW Acquisition          3.851
 Kings Road over      three span Kings Road Bridge with a new           and Amtrak Review
 CSX                  single span structure. Work includes the          Pending,
 Replacement          installation of a sidewalk on the north side of   Construction 2021
                      the structure and will include shoulders wide
                      enough for bicycles.
 PIN 1760.57 -        A Federal Aid project to improve pedestrian       Design Report            1.660
 Brandywine           accomodations and increase safety along           under review by
 Avenue, State St.    Brandywine Avenue between State Street            NYSDOT,
 to I-890             and Interstate 890.                               Construction Spring
                                                                        2021
 PIN 1760.57 -        A Federal Aid project to improve pedestrian       Design Report            0.400
 Rosa Road,           safety at the five legged intersection of         under review by
 Wendell Ave.         Rosa Road, Nott Street and Wendell                NYSDOT,
 and Nott St.         Avenue.                                           Construction Spring
                                                                        2021
 PIN 1760.95 -        A Federal Aid project to upgrade select           Design Report            1.055
 Pedestrian Safety    signals in the downtown neighborhood.             under review by
 Action Plan (DOT)    Upgrades will include pedestrian heads,           NYSDOT,
                      push buttons and ADA ramps were required.         Construction Spring
                                                                        2021
 South                Complete street redesign of South Church          Draft design             TBD
 Church/Railroad      Street between Fuller and State St                concepts
 Street                                                                 underway by
 Improvements                                                           consultant. Existing
                                                                        utilities under review
 PIN 1761.18 -        A Federal Aid preservation project to             Design Report            3.459
 Francis Avenue       replace the existing concrete deck and            under review by
 over I-890           sidewalk on the Francis Avenue bridge over        NYSDOT,
                      Interstate 890.                                   Construction Spring
                                                                        2021
 Stormline            Installation of a stormline on Wyoming            Preliminary Design       0.900
 installation,        Avenue to Oneida Street with additional           complete, peer
 Wyoming,             connections made to Lancaster and                 review to be
 Lancaster,           Grenocide.                                        performed by
 Grenocide                                                              consultant to verify
                                                                        pipe sizes
 Citywide GIS         Evaluation and creation of a Citywide GIS         City working with        0.100
 Initiative           program built from the ground up with             consultant on
                      existing City mapping, publicly available         recommended
                      data and as builts.                               Phase 1 collection
                                                                        focus. Currently

January 2021                                                                                                  9
leaning towards
                                                                    complete mapping
                                                                    of storm system

 PIN 1760.42 -      A Federal Aid project to mills and pave         Design Report          1.209
 Broadway, 4th to   Broadway between 4th and Weaver Street.         under review by
 Weaver St.         This work will include the upgrade of           NYSDOT,
                    handicap ramps and pedestrian                   Construction Spring
                    accomodations.                                  2021
 SAM #9330 -        A State funded project to renovate the          Meeting held with      0.450
 Police Pistol      existing indoor firing range at the             design consultant
 Range (DASNY)      Schenectady Police Department. Project          to create RFP for
                    includes lead and asbestos abatement.           HVAC/Range Install
 Nott & McClellan   Installation of pedestrian accomodations        City comments sent
 Traffic Signal     such as push buttons and ped heads at this      to B&L for
 Improvements       existing signal.                                incorporation into
                                                                    plan set. Work to be
                                                                    included in 2021
                                                                    City Paving
                                                                    Program.

Under Construction

 SAM #7148 - Fire   Renovations and improvements to the             Renovations and        0.430
 Station 3          existing fire station 3 facility.               improvements to
 Improvements                                                       the existing fire
 (DASNY)                                                            station 3 facility.
 "A" Diamond        Installation of dugouts, bullpens, flagpole     Installation of        0.400
 Improvements -     and scoreboard                                  dugouts, bullpens,
 Phase II                                                           flagpole and
                                                                    scoreboard
 Replacement of     Replacement of existing built up roof at City   Main roof              0.500
 City Hall Roof     Hall.                                           replacement
                                                                    completed w/e
                                                                    10/16/20. Gutter
                                                                    design found to be
                                                                    inadequate, new
                                                                    design was
                                                                    investigated,
                                                                    proposed and
                                                                    accepted by City.

January 2021                                                                                       10
Public Safety Data
Fire Department [7]
Year Medical Fire, Rescue, Hazardous Total
Conditions
2019 1,079 510 1,591
2020 1,149 462 1,623
2021 963 433 1,400
The total number of calls in January 2021 was about 14% less than January of last year.
This decrease was primarily driven by the lower number of medical calls, since there
were 1% fewer medical calls in January 2020 than there were in January 2020. The
number of calls other than medical calls (Fire, Hazardous Conditions, Rescue) was
about 6% less than last year.
Total Calls in January Medical vs. Non-Medical Call Ratio
2019-2021 January 2021
1650 1,623
1,591
1600
1550
1500
31%
1450
1,400
1400 69%
1350
1300
1250
2019 2020 2021 Fire/Rescue/Hazardous Conditions Medical
The ratio of medical to non-medical calls was about the same in 2021 as is generally
expected based on call trends over the past three years.
January 2021 11Public Safety Data
911 Call Hotspots 911 Call Hotspots
January 2020 January 2021
Locations of Fire Department calls in 2020 were consistent with previous years. Hotspots
tend to be in Hamilton Hill and Downtown neighborhoods, with a lesser, but still
prominent concentration of calls coming from the Mont Pleasant and Central State
neighborhoods.
Police Department [8]
Call Data
Total calls in January 2021 decreased about 8.5% as compared to January 2020. The
largest number of calls this month fell in the Traffic Stop category, followed by Property
Check and Domestic Dispute. These top call categories are consistent with last year’s
data and last month’s as well; however, Traffic Stop calls have been much higher YTD.
Type 2020 2021
Traffic Stop 496 630
Property Check 400 393
Get a Report 399 383
Domestic Dispute 361 341
Check A Subject 316 262
January 2021 12Public Safety Data
The ratio of citizen to officer-initiated calls was 4:6 in January 2021, which is consistent
with previous years. This January, however, there were far fewer officer-initiated calls
as compared to last year (-6%) and citizen-initiated calls (-10%).
Officer and Citizen Initiated Calls in January Officer vs. Citizen Initiated
2019-2021 Calls
7000 January 2021
6000
5000
2,253 2,127
4000 1,995
3000 38%
2000 3,656 3,645 62%
3,285
1000
0
2019 2020 2021
Citizen Officer Citizen Officer
Parking Enforcement
Under the new scofflaw regulations, those delinquent in vehicle fines have been
entered into the License Plate Reader (LPR) system, so violators can be more easily
prosecuted. New revenue in 2021 to date amounts to $6,136, which is 47% less than this
time last year. That said, it is only slightly less than the average collected per month in
2020.
Scofflaw Revenue in January
2020 vs. 2021
14,000
$11,588.75
12,000
10,000
8,000
$6,136.00
6,000
4,000
2,000
0
2020 2021
January 2021 13Public Safety Data
Last month, the City switched to a new parking system, Passport Parking. Total revenue
from paid parking in January 2021 was $7,931.65 from 2,289 transactions. Total revenue
from parking violations was $29,498. And 575 payments were made, primarily via the
online payment portal. Compared to January 2020, parking violations revenue is down
41%, since the number of violations was 51% less in January 2021.
Violation Income (Jan 2021) Parking Income (Jan 2021)
Payment Method Amount Payments Metric Totals
Cash $4,112.50 80 Transactions 2289
Check $2,095.00 37 Avg Fee $3.61
Credit/Debit $8,595.70 135 Parking Income $8,275
Web $14,695.00 323 Passport fees $343.35
Total $29,498.20 575 Net Revenue $7,931.65
Crime Data
As the CompStat report below (issued February 3, 2021) indicates, in the past 28 days,
the overall Part I (PI) Crime rate was down 20.4% as compared to January last year. In
2021 YTD, as compared to the 5-year average, the crime rate was down 20.5%. This
month there were notable reductions in robbery (-50%), burglary (-35%), and larceny (-
31%) cases, while there was a large increase in motor vehicle thefts (+160%).
January 2021 14Public Safety Data
Locations of Part I (PI) Crimes in January 2021 were similar to January of last year,
though there was a stronger concentration of crime than usual in the Bellevue
neighborhood. Hotspots generally tend to be in Hamilton Hill/Vale, Mont Pleasant, and
Downtown neighborhoods. Similar locational trends were also observed for PI Crimes in
2019 and 2018.
PI Crime Hotspots PI Crime Hotspots
January 2020 January 2021
January 2021 15Property Information
Receipts – Liens & Tax Delinquency [9]
2018 - 2020 Liens Update
As of January 31, 2021, total 2018 liens, including interest, amount to $1.3 million, with an
average of $2,886 due per bill. Normally, parcels with 2018 liens would become
foreclosures, but due to COVID-19 regulations, the City has been unable to foreclose on
properties. Total 2019 liens with interest are now $2.87 million, with an average of $2,518
due per bill. This total represents a 20% reduction from last month, primarily attributed to
residents paying school taxes. Total 2020 liens are $6.3 million, with an average of $2,055
due per bill. A larger proportion of liens from all 3 years are attributed to city taxes than to
school taxes.
Year Total Average City Tax School Tax
2018 $1.3 million $2,886 $777,743 $512,268
2019 $2.87 million $2,518 $1.76 million $1.11 million
2020 $6.3 million $2,055 $4.0 million $2.3 million
2021 Tax Delinquency
Total first quarter delinquency for 2021 taxes as of January 31, 2021 was about $2.5 million.
The average amount due per bill is approximately $769.
Neighborhood % 2019 Liens % 2020 Liens % Delinquent 2021 % 2018-2020 Liens &
Taxes 2021 Delinquency
Northside 5.0 9.5 15.7 2.5
Downtown 2.6 9.5 18.5 1.5
Eastern Avenue 5.2 13.4 19.6 1.5
Hamilton Hill & Vale 4.8 15.8 25.2 1.5
Mont Pleasant 4.4 11.9 18.6 1.3
Central State 4.0 11.6 19.1 0.8
Bellevue 2.9 7.9 14.6 0.8
Woodlawn 2.7 6.4 12.4 0.7
Union Street 1.7 5.1 9.8 0.5
Stockade 1.2 6.7 11.5 0.2
As indicated on the map below, delinquency and 2018-2020 liens are widespread. The
Hamilton Hill/Vale neighborhood has the highest percentage of parcels with 2021
delinquency and 2020 liens. Eastern Avenue has the highest proportion of parcels with
2019 liens, but Northside has the largest proportion of parcels with both 2018-2020 liens
and 2021 delinquency.
January 2021 16Property Information
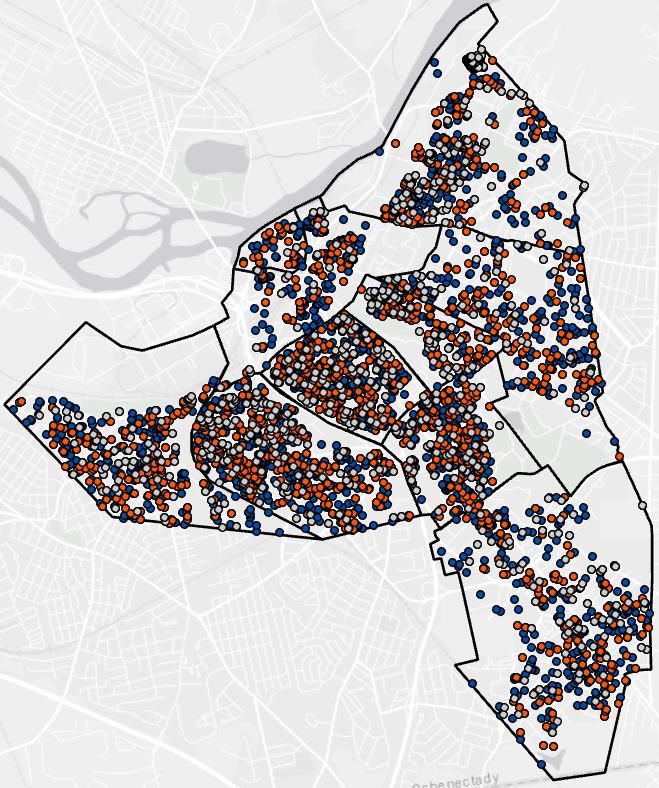
2019 & 2020 Liens All Delinquent Properties
1st Quarter Delinquency for 2018-2020 Liens, &
January 2021 2021 Taxes
240 parcels have 2018, 2019, and 2020 liens, and are also delinquent in 2020 taxes as of
January 31, 2021. Parcel locations are shown in the map to the left above.
Total Parcels with Overdue Taxes in January
2018-2021 The number of parcels with tax
delinquency is highest for the 2021 tax
3500 16.23%
year, as is expected. A total of 3,288
3000 parcels, or 16% of all parcels in the city
owe 2021 taxes. There are also 1,942
2500 (9.6%) parcels that have 2020 liens and
9.59% 720 (3.6%) parcels that have 2019 liens.
2000
Again, those with 2018 and 2019 liens
1500
would normally be foreclosed on or go
through the foreclosure process this
1000 3.56%
year, but the City has not been able to
do so. As such, 1.2% of parcels in the
500 1.19% city owe taxes from 2018, 2019, 2020,
and 2021.
0
2019 2020 2021 4 Years
January 2021 17Property Information
Code Enforcement [10]
Violations & Complaints
In January 2021, there were a total of 281 violations and 186 complaints. These numbers
are similar to last month, but significantly less than in January 2020. Violations decreased
54% and complaints decreased 57% as compared to January of last year.
Violations & Complaints in January
2019-2021
700 Violations Complaints
600
651 2019 124 245
500
2020 651 400
400
300 400 2021 281 186
200 281 245
100 124 186
0
Violations Complaints
2019 2020 2021
Violations & Complaints
January 2021
The Hamilton Hill/Vale and Mont
Pleasant neighborhoods had the most
complaints and violations in January
2021. Expressed as a percentage of total
parcels per neighborhood, however,
Hamilton Hill/Vale and Downtown
neighborhoods ranked highest.
January 2021 18Property Information
New Permit Applications
The 191 new permit applications in January 2021 represent just over $44,400 in fees and
$4.8 million in construction costs. There was been a slight decrease in the number of new
applications since last month. For comparison, the 271 new permits in January 2020
totaled $170,678 in fees and approximately $15 million in construction costs. The permits
most commonly applied for this month are listed below.
Type Count Fees Cost of
Construction
Plumbing - Residential 41 $8,219.00 $147,245
Building Permit - Residential 25 $4,326.44 $385,697
Electrical Permit - Residential 20 $1,248.00 -
Roof Permit - Residential 20 $2,400.00 $150,626
Small Cell Wireless Facility 17 $1,700.00 -
New Permit Applications
January 2021
The highest number of new permits
were applied for in the Bellevue
and Northside neighborhoods in
January 2021. The Eastern Avenue
and Stockade neighborhoods had
the highest proportion of
applications when expressed as a
total percentage of parcels in
each.
Fees for all applications, violations, and permits amounted to approximately $125,618 in
January 2020. This is a 12% increase from last month. All fees have been paid in full.
January 2021 19Property Information
Property Sales & Ownership [11]
City/SURA Owned Property
Prop. Class Description Count As of February 1, 2021, the City
311 Vacant Residential Lot 265 owns 317 properties and SURA
220 Two-family Residential 114 owns 382 properties, for a total
210 Single-family Residential 79 of 699 properties. The majority
330 Vacant Commercial Lot 41 of these parcels are classified
312 Res. Land Incl. Sm. Imprvmt. 13 as vacant residential lots.
The number of structures and lots the City owns has fluctuated month to month, but in
general, the total vacant lots has historically been around 360, but now hovers around
320. The number of City-owned structures has steadily declined since last year, and is now
241 as compared to February 2020, when the City owned 358 structures. Listed structures
and lots* vary by month, but the City now generally lists at least 45% of total owned
structures. In 2020 the proportion of listed property went from a low of 35% in February to a
high of 61% in November. There are currently 217 listed lots and 56 listed structures for a
total of 273 listings, which is slightly higher than this time last year.
Total Listings by Month Proportion of City-Owned Property
2020 vs. 2021 Listed by Month 2021
350 600
291
300 279 273 500
242
250
400
200
300
150
200
100
49% 48%
50 100
0 0
Jan Feb Jan Feb
2020 2021 City Owned Total Listed
*“Listed structures” are those that are officially assigned to a realtor. “Listed lots” are those that are available for sale.
Most lots, however, are not assigned to any realtor.
January 2021 20Property Information
Property Sales
As of January 31, 2021, total property sales amounted to $280,600 and 7 properties were
sold. The average selling price was $40,086. The most properties the City sold this month
were located in the Hamilton Hill neighborhood. As compared to January 2019 and 2020,
the number of properties sold, as well as the average selling price and total sales amount,
was much higher in January 2021.
Property Sales in January
2019-2021
$300,000 $280,600
$250,000
$200,000
$150,000
$100,000
$42,100
$50,000
$7,900
$0
2019 2020 2021
Property & Lots for Sale
February 2021
As of February 5, 2021, there are 56 city-owned
structures and 217 lots for sale. Most of these
parcels are located in Hamilton Hill/Vale and
Mont Pleasant neighborhoods.
January 2021 21Data Sources Where does all this data come from? Data for this report is pieced together from many different, decentralized locations in various departments across the City. The list below, which explains where each dataset comes from, contains numbers that coordinate with section titles throughout the report. [1] Energy data comes directly from National Grid bills for each location listed in the report. [2] Waste and recycling numbers are obtained from the Office of General Services (OGS). They track their bills, which are confirmed by county representatives, and provide a monthly update to an Excel spreadsheet hosted on the City Public server [3] All electric vehicle (EV) and charging station data is extracted from the ChargePoint dashboard system provided to the City by ChargePoint. [4] Vehicle maintenance numbers come from Schenectady County. Invoices from the county are transferred to an Excel spreadsheet maintained by the Maintenance Dept. in the City. City staff also tracks fuel transactions by department via credit card statements. The total amounts are put into excel for analysis. [5] The City uses CivicPlus as a platform to host our website. CivicPlus provides statistics on website usage via PikWik, and on Citizen Request Tracker via the CivicPlus dashboard. These can be downloaded to Excel. [6] The Engineering Dept. track capital projects in Excel as each progresses from design to completion. [7] The Fire Dept. maintains a database of their daily call records through an external service. Each month they provide an update to an Excel spreadsheet that contains the relevant call types and the locations from which the calls come (no personal identification data is recorded). [8] Call data and crime records from the Police Dept. is stored in their CAD database and exported each month to Excel. Traffic enforcement data comes from both the City and County databases and is also stored and updated in Excel and/or Word each month. [9] The Receipts Dept. stores tax lien and delinquency information in Munis, which is updated as residents pay down their dues. The dept. then exports this data to Excel monthly. These Excel files contain locational data that is transferred to ESRI’s ArcGIS Pro and mapped. [10] Municity houses Code Enforcement data. The “LogiReports” tool is used to export pre- selected sets of data from Municity to Excel. From there datasets can be mapped in ArcGIS Pro to track locational trends. [11] The Assessment Office maintains the list of city-owned property and lots – which is updated as soon as there are any changes – and sends a copy of the Excel file monthly. Houses and vacant lots that are available for purchase are tracked by the Development Dept. and the Excel spreadsheet is updated monthly. The Law Dept. keeps a list of official property information, including sales, which is updated as changes in property status are made. This list is stored in both Access and Excel. Demolitions are tracked by the development department in Microsoft Office. January 2021 22
You can also read