Population Survey and Projections - The City of Terrace and Regional District of Kitimat-Stikine Electoral Areas C and E
←
→
Page content transcription
If your browser does not render page correctly, please read the page content below
Population Survey and Projections
The City of Terrace and Regional District of Kitimat-Stikine Electoral
Areas C and E

Date: September 15, 2020

Prepared for:
David Block
City of Terrace
Phone: 250.605.4028
Email: dblock@terrace.ca

Amelia Andrews
Regional District of Kitimat-Stikine
Phone: 205.615.6100
Email: aandrews@rdks.bc.ca

Prepared by:
Hannes Edinger
Big River Analytics Ltd.
4795 Merkley Rd. Terrace, BC, V8G0B5
Phone: 250.922.4999
Email: hannes@bigriveranalytics.com
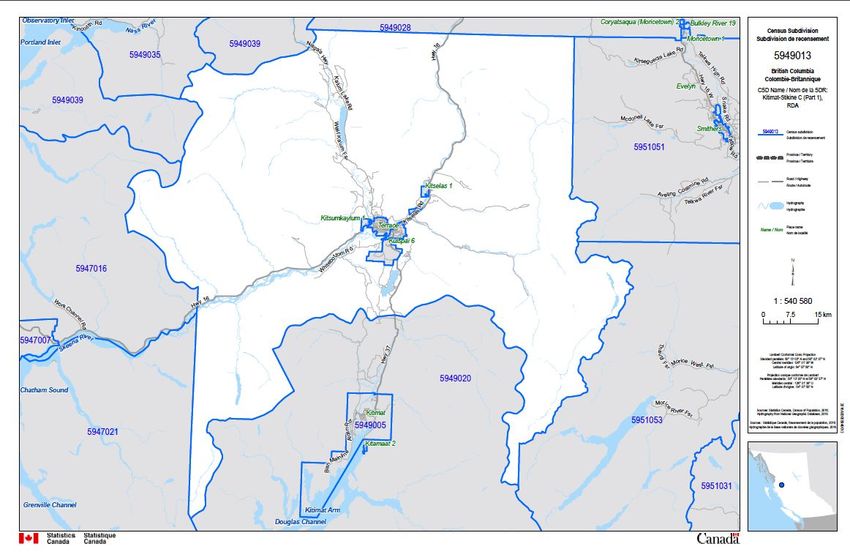
Table of Contents
Table of Contents 1
Terms and Acronyms 2
Executive Summary 3
1.0 Background 4
2.0 Results 5
2.1 Population Estimates 5
2.2 Population Projections: 2020-2030 6
Scenarios 7
Appendix A - Methodological Appendix: Population Estimates 15
A1. Producing the Sample 15
A2. Enumeration 17
A3. Questionnaire 17
A4. Additional Survey Results 18
Appendix B - Methodological Appendix: Economic Scenarios & Population Projections 19
B1. Detailed Assumptions 19
B.2 Additional Figures 20
Appendix C - Geographic Areas 28
C1. 2016 Census Boundaries 28
C2. Local Health Authority Boundaries 30
C3. Survey Samples 31
References 33
Big River Analytics Ltd. I 1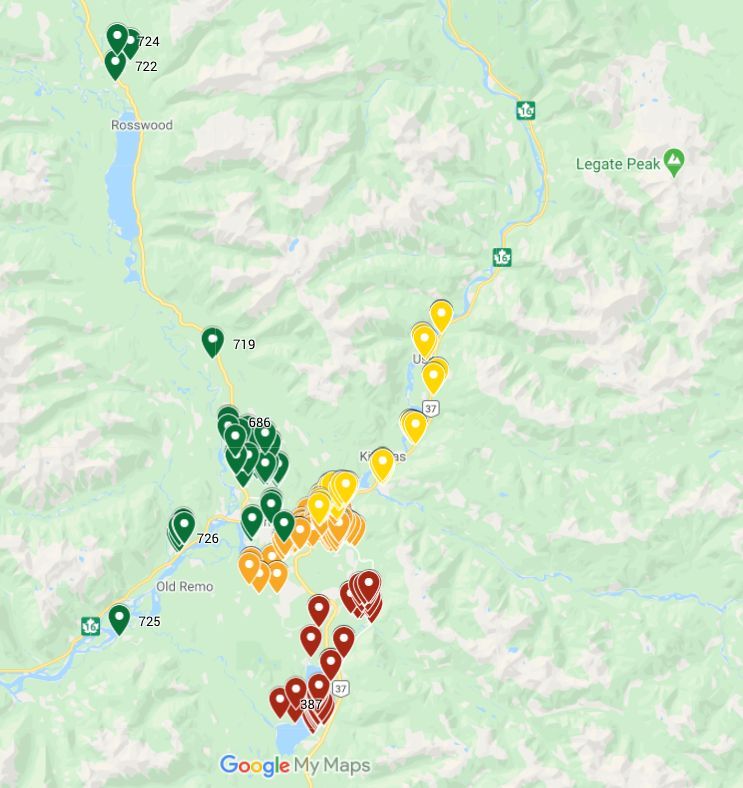
Terms and Acronyms
2016 Census: 2016 Census of the Population
City of Terrace: Refers to the geographic area encompassed by the 2016 Census Subdivision
boundaries for Terrace (City). It also refers to the Local Health Authority boundary 5171, Terrace
City Centre, which is used by BC Stats for population estimates and projections
CMHC: Canadian Mortgage and House Corporation
Hard shadow: people in the shadow population who have worked 30 or more days in Terrace or
RDKS
LNG: Liquefied natural gas
KMP: Kitimat Modernization Project
MPI: Major Projects Inventory
P.E.O.P.L.E: BC Stats’ population projection model
Place of usual residence: the dwelling in which the person usually lives
Regional District of Kitimat-Stikine Electoral Areas C (Part 1) and E: Refers to the geographic
area encompassed by the 2016 Census Subdivision boundaries for Kitimat-Stikine Area C (Part 1)
and Kitimat-Stikine Area E
RIELP: Ridley Island Export Logistics Platform
RDKS: Regional District of Kitimat-Stikine
Shadow population: People who are living or staying in Terrace and the RDKS, Electoral Areas C
and E, but have a usual residence elsewhere
Soft shadow: people in the shadow population who have not worked 30 or more days in Terrace
or RDKS
Total Region: the population summation of the City of Terrace and the RDKS Areas C and E
Usual residents: people who have usual residence in Terrace or in the RDKS, Electoral Areas C
and E, as of May 1, 2020 (e.g., it is where they usually live, where their mail goes to, where they
stay most nights)
Big River Analytics Ltd. I 2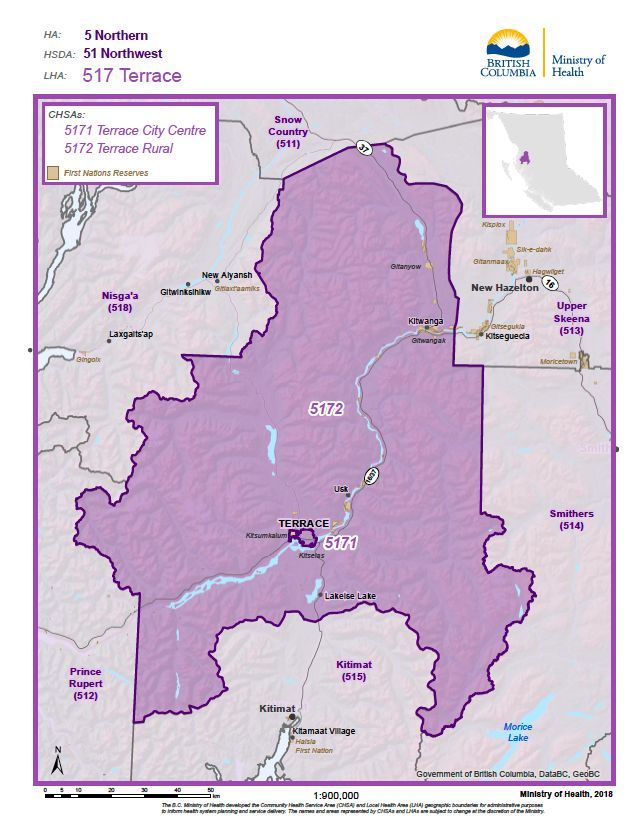
Executive Summary
This report presents the results of a population survey conducted in July 2020 by the City of Terrace
and the Regional District of Kitimat-Stikine (RDKS). The objective of the survey is twofold: first, to
produce population estimates for the two regions, thereby updating the City of Terrace’s 2015
Population Survey and Projection report; and second, to inform a set of population projections based
on three economic development scenarios.
A stratified sample of 730 households was produced, with 373 private dwellings in the City of
Terrace, and 357 private dwellings in the RDKS Electoral Areas C and E. A total of 469 responses
were received, for an aggregate response rate of 64%. The margin of error for the total population
estimate is +/- 8%, 46 times out of 50. The total population estimate for the City of Terrace as of May
1, 2020 is 12,700. This total comprises 12,229 usual residents and a shadow population of 471. The
total population estimate for the RDKS Electoral Areas C and E is 7,416. This total comprises 7,001
usual residents and a shadow population of 415. The combined population estimate for both areas is
20,116.
The 2020 baseline population estimates serve as a starting point for the three population
projections. Three potential economic development scenarios are defined for the projections:
1. Low - the current level of regional economic activity is maintained, construction continues
and is completed for LNG Canada and the Coastal GasLink Pipeline, the water system
development for the Skeena Industrial Development Park continues and supports the
construction of two industrial facilities, the expansion of the Mills Memorial Hospital begins,
and planned Highway 16 construction continues.
2. Medium - all development that occurred in the low scenario is assumed to proceed, in
addition to the continued development of the Skeena Industrial Development Park (two
additional facilities constructed and additional infrastructure), Ridley Island Export Logistics
Platform (RIELP), and the Fairview Container Terminal.
3. High - all development that occurred in the low and medium scenarios is assumed to
proceed, in addition to expanded development of the Skeena Industrial Development Park
(two facilities under construction), Rio Tinto Alcan Kemano Tunnel 2, LNG Canada
Interconnection, and the Kitimat LNG and Pacific Trails Pipeline.
All three population projections scenarios show population growth from 2020 to 2024, concurrent
with the peak construction period of the LNG Canada and Coastal GasLink projects, as well as the
Mills Memorial Hospital construction. Subsequently, all three scenarios project a drop in population
between 2024 and 2026, before projecting that the population will either stabilize (Scenario 1 and
Scenario 2) or grow steadily (Scenario 3) through to 2030.
Big River Analytics Ltd. I 3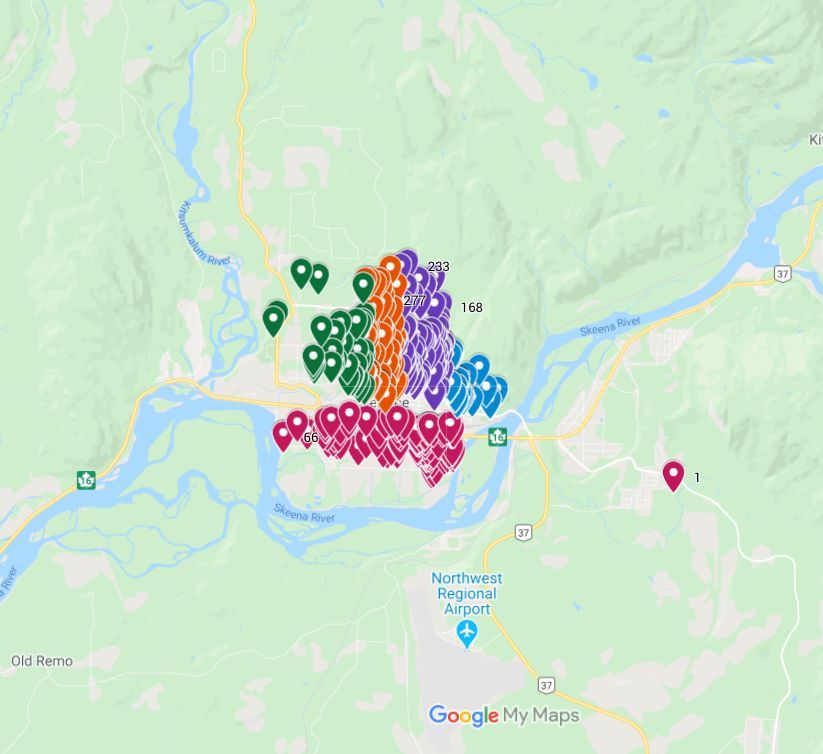
1.0 Background
The latest official population estimate for usual residents in the City of Terrace and the Regional
District of Kitimat-Stikine (RDKS) comes from the 2016 Census of the Population (2016 Census)
conducted by Statistics Canada. The 2016 Census estimates the total number of usual residents in
the City of Terrace at 11,643, up 1.4% from the 2011 estimate at 11,486 (Statistics Canada, 2017a),
and the total number of usual residents in the RDKS Electoral Areas C and E at 6,827, up 2.1% from
6,684 in 2011 (Statistics Canada, 2017b; Statistics Canada, 2017c). BC Stats produces intercensal
annual population estimates for the municipality of Terrace, but none specific to the RDKS, Electoral
Areas C and E. BC Stats’ most recent population estimate for the City of Terrace shows an increase
of 2.9% between 2015 and 2019 (from 12,195 to 12,549) (BC Stats, 2019). BC Stats similarly
produces population projections (P.E.O.P.L.E), but the publicly available data sets do not offer
projections specific to the City of Terrace or to the constituent regions of the RDKS. Instead,
P.E.O.P.L.E produces projections for the 5171 Terrace Local Health Authority boundary and the
entirety of the RDKS.
Since 2016, key indicators in the City of Terrace suggest that substantial economic and
demographic growth has taken place. According to the Canadian Mortgage and House Corporation
(CMHC), the vacancy rate in Terrace was 2.2% in 2019, down 2.2 percentage points from the 4.4%
vacancy rate reported in 2016 (Statistics Canada, n.d.). Simultaneously, the cost of a one-bedroom
rental unit in Terrace increased from an average of $707 to $802 between 2016 and 2019 (Statistics
Canada, 2017d). The average price of a single-family home in Terrace jumped from $308,531 in
2017 to $346,500 in 2018 and increased again to $398,553 in 2019 (Terrace Standard, 2020).
Additionally, the area’s economic development has increased since 2012, albeit not always linearly,
starting with the construction of the Northern Transmission line, followed by the proposal and
approval of the Liquified Natural Gas (LNG) Canada plant and Coastal GasLink Pipeline. Spillover
effects of developments in Kitimat, such as the Kitimat Modernization project, have also played a
role in the economic development of Terrace and the RDKS.
By incentivizing migration, economic development is expected to impact demographic growth for
both the usual residents and the shadow population. Prior to and since 2015, residents have seen
increased economic activity in Terrace, including upward pressures on City services, infrastructure,
and housing markets. In 2015, the City of Terrace produced a Population Survey and Projection
report in response to official population counts that did not reflect residents’ day-to-day experiences;
this report estimated a larger population than those provided by the 2011 Census or by BC Stats
(2014). In 2020, up-to-date and accurate population estimates are required to understand the
evolving demand for services in the City of Terrace, and to include the RDKS, Electoral Areas C and
E, in these assessments. Consequently, the City of Terrace and the RDKS are seeking to update
their Housing Needs Assessments (2014), Official Community Plans (2018), and previously
produced Population Survey and Projection report (2015).
Big River Analytics Ltd. I 4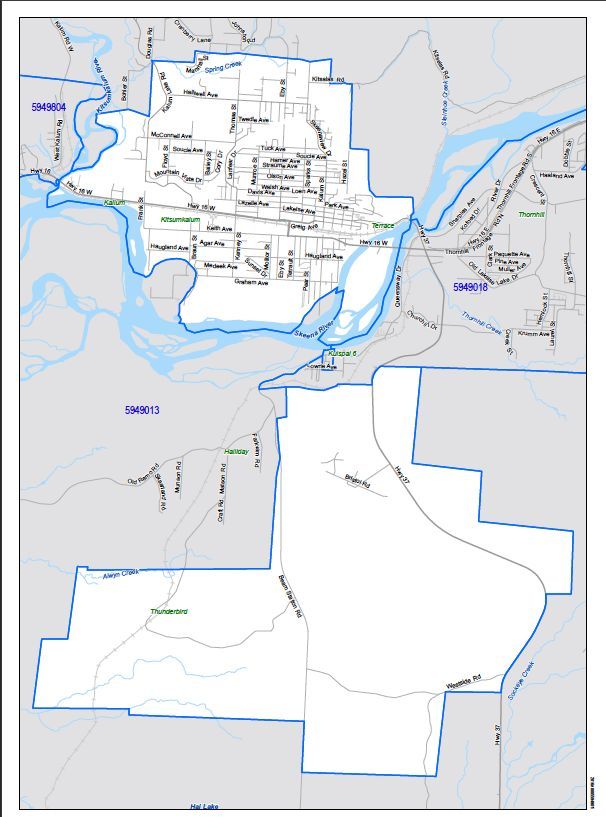
2.0 Results
Section 2.0 presents the 2020 Population Survey results, including population estimates and
population projections based on three economic development scenarios. Detailed methodological
appendices are additionally available (see Appendices A and B).
2.1 Population Estimates
A stratified random sample of 730 households was produced to estimate the total population in
Terrace and in the RDKS, Electoral Areas C and E, including usual residents and the shadow
population (see Terms and Acronyms for definitions). A total of 469 responses were received, for an
aggregate response rate of 64%. The margin of error for the total population estimate is +/- 8%, 46
times out of 50. The total population estimate for the City of Terrace as of May 1, 2020 is 12,700
people (Table 2.1.1). This total comprises 12,229 usual residents and a shadow population of 471.
The total population estimate for the RDKS Electoral Areas C and E as of May 1, 2020 is 7,416
(Table 2.1.2). This total comprises 7,001 usual residents and a shadow population of 415.
Table 2.1.1: Total Population Estimate, City of Terrace, 2020
Estimate Usual Residents Soft Shadow Hard Shadow Total
Mean 12,229 353 118 12,700
Lower Confidence Limit 11,356 120 0 11,476
Upper Confidence Limit 13,102 586 516 14,204
Source: Big River Analytics Calculations
Notes: Lower confidence limit and upper confidence limit are based on a 95% confidence interval. Total estimates are
adjusted to reflect the midpoint of the estimated 75 to 125 undocumented suites (100 undocumented suites). The density
of apartments is utilized to estimate the number of people living in undocumented suites (1.81), for a total of 181
individuals living in undocumented suites.
Table 2.1.2: Total Population Estimate, RDKS Areas C & E, 2020
Estimate Usual Residents Soft Shadow Hard Shadow Total
Mean 7,001 302 113 7,416
Lower Confidence Limit 6,470 118 0 6,588
Upper Confidence Limit 7,531 486 401 8,418
Source: Big River Analytics Calculations
Notes: Lower confidence limit and upper confidence limit are based on a 95% confidence interval. Total estimates are
adjusted to reflect the estimated 40 undocumented suites in the RDKS Areas C and E. The density of attached dwellings is
utilized to estimate the number of people living in undocumented suites (2.48), for a total of 99 individuals living in
undocumented suites.
Population estimates presented by the 2016 Census are representative of usual residents only. A
comparison of usual residents shows that Terrace’s current population is estimated to be a full 5.0%
higher than the most recent estimate produced by the 2016 Census, while the population in the
Big River Analytics Ltd. I 5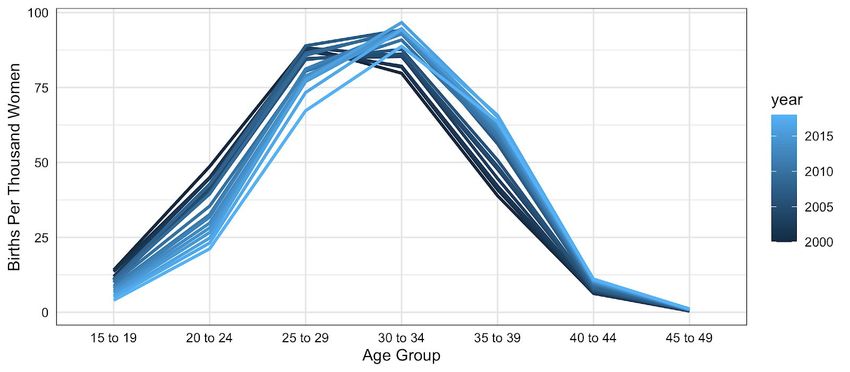
RDKS, Electoral Areas C and E, is estimated to be 2.5% higher. If shadow residents are included,
Terrace’s total population is 9.0% higher than the 2016 Census estimate, while the total population
of the RDKS, Electoral Areas C and E, is 8.6% higher than estimated in the 2016 Census. In 2020,
the shadow population accounted for 3.7% of the total population in the City of Terrace (down from
4.3% in 2015), and 5.5% of the total population of the RDKS, Electoral Areas C and E.
For the City of Terrace, survey results are also comparable to the most recent (2019) official
estimate from BC Stats and the 2015 Population Survey and Projection report. When considering
only usual residents, the population estimate based on current survey results are 2.6% lower than
the 2019 BC Stats estimate. However, when the shadow population is included, the population
estimate based on current survey results is 1.2% higher than BC Stats’ estimate. Finally, Terrace’s
total population in 2020 is 1.6% higher than the estimate in 2015. These modest growth trends serve
to highlight that economic development does not always translate into permanent residents, instead
attracting significant numbers of shadow populations or workers based in camps, coming in waves
and subsequently leaving when their projects are complete.
2.2 Population Projections: 2020-2030
Population projections are produced for the City of Terrace and the RDKS, Electoral Areas C and E,
by drawing from two distinct components: natural change (the result of births and deaths) and
migration. The natural change in the current population can be projected by omitting migration, and
net-zero migration is set as a baseline for the 2020 population projections (Figure 2.2.1). Inmigration
and outmigration are assumed to be a function of economic activity; in other words, they are driven
by increases or decreases in local and regional economic growth. We consequently allow migration
to vary as a function of the three identified potential development scenarios (low, medium, and high
development), thereby impacting population projections out to 2030. Detailed assumptions guiding
these projections are provided in Appendix B1.
Big River Analytics Ltd. I 6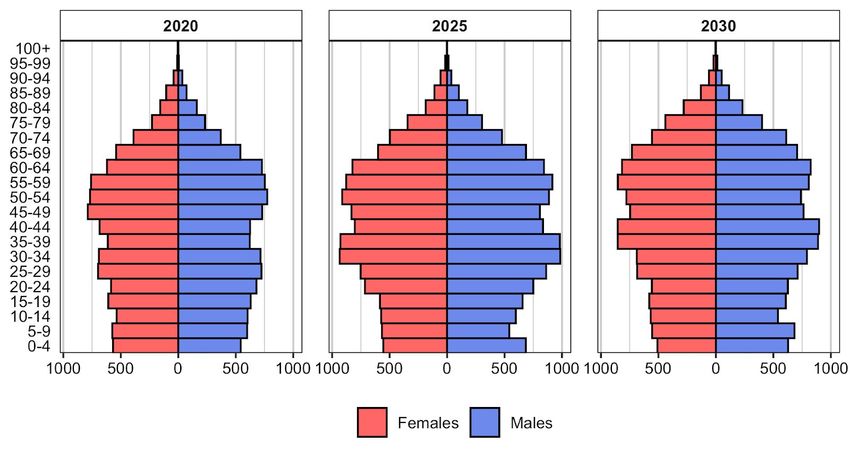
Figure 2.2.1: Zero Migration (Baseline) Population Projection, Total Region, 2010 to 2030
Source: Big River Analytics Calculations; BC Stats population estimates and projections; Statistics Canada. Table
17-10-0142-01 Population estimates, July 1, by census subdivision, 2016 boundaries.
Notes: The total baseline population projection excludes migration and only accounts for natural population changes
(births, deaths). The BC Stats estimates and projections are for Community Health Service Area 5171, Terrace City
Centre, and 5172, Terrace Rural, which encompasses a larger geographic region than the boundaries for the population
survey and the Statistics Canada population estimates. Consequently, estimates using the LHA boundary 5172 are not
directly comparable to Statistics Canada population estimates or the population projections.
Scenarios
Three potential economic development scenarios are defined for the projections:
1. Low Economic Development
2. Medium Economic Development
3. High Economic Development
We consider each in more detail, looking at projections for the total region (the aggregate of Terrace
and the RDKS, Electoral Areas C and E)1 to 2030. Detailed regional projections for Terrace and the
RDKS, Electoral Areas C and E are provided in Appendix B2 :
Scenario 1 - Low Economic Development
Scenario 1 (see Figure 2.2.2) assumes that the following local and regional economic development
will take place:
● Skeena Industrial Development Park (SIDP) development continues with two industrial
facilities being constructed and completed in coordination with the on-site water system by
2022. Permanent employment continues at the two facilities from 2023 onward.
● Highway 16 construction continues into 2021.
1
Note: Additional tables and figures presenting data for Terrace and the RDKS individually are available in
Appendix B2.
Big River Analytics Ltd. I 7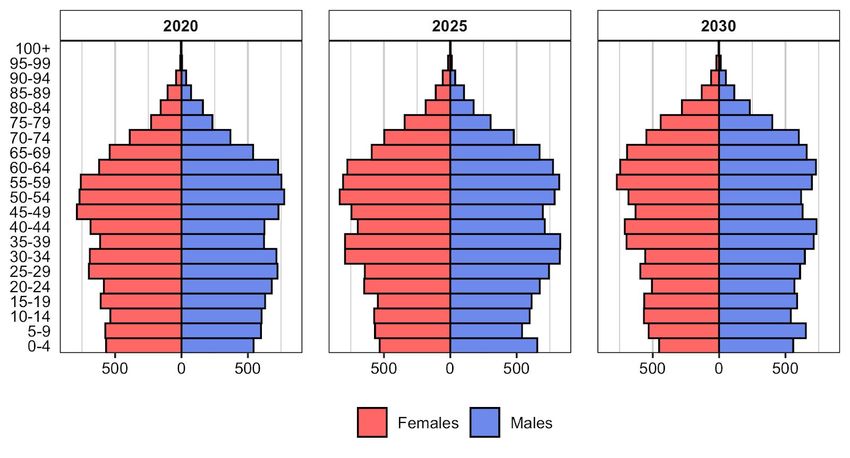
● Mills Memorial Hospital construction begins in 2021 and is forecasted to be completed by
2025, requiring up to 350 workers during peak construction.
● Construction of the LNG Canada facility and the Coastal GasLink Pipeline continues,
reaching its peak in 2024 and is forecast to be completed by 2026. Peak construction occurs
from 2021 until 2024.
In this scenario, the aggregate population for both the City of Terrace and the RDKS, Electoral
Areas E and C, grows steadily from 2020 to 2023 (20,116 to 21,951), before reaching its peak of
22,038 in 2024 (Table 2.2.1). In 2024, the shadow population is also estimated to peak at a total of
984. The estimated peak population is concurrent with peak construction from 2021 through 2024 on
the LNG Canada and Coastal GasLink projects, the Mills Memorial hospital construction, and the
SIDP industrial facility development. The total population is projected to grow by 2.1% from 2020 to
2030. Figure 2.2.3 shows that under the low development scenario the age and gender structure of
the population remains stable over the projection horizon, with a slight decrease in the number of
infants, and modest ageing of the population.
Figure 2.2.2: Low Development Scenario Population Projections, Total Region, 2010 to 2030
Source: Big River Analytics Calculations; BC Stats population estimates and projections; Statistics Canada. Table
17-10-0142-01 Population estimates, July 1, by census subdivision, 2016 boundaries.
Notes: The population projection includes estimates for the usual residents and the shadow population. The BC Stats
estimates and projections are for Community Health Service Area 5171, Terrace City Centre, and 5172, Terrace Rural,
which encompasses a larger geographic region than the boundaries for the population survey and the Statistics Canada
population estimates. Consequently, estimates using the LHA boundary 5172 are not directly comparable to Statistics
Canada population estimates or the population projections.
Big River Analytics Ltd. I 8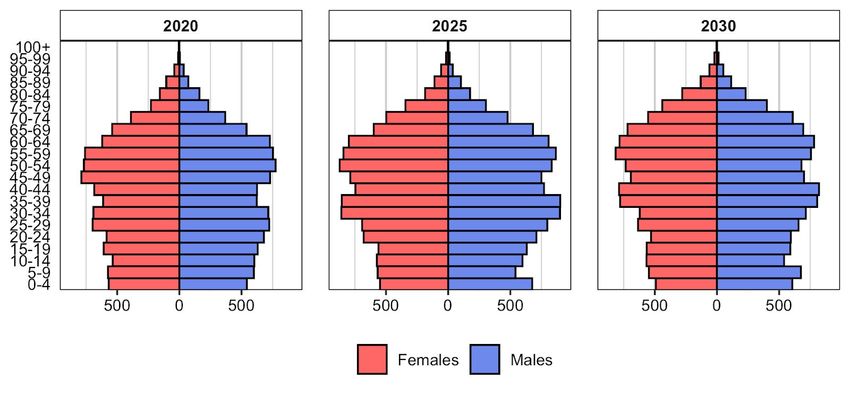
Table 2.2.1: Low Development Scenario Projections, Total Region, 2020 to 2030
Year Usual Residents Shadow Population Total Population Shadow Population (% of Total)
2020 19,230 886 20,116 4.4%
2021 20,176 910 21,087 4.3%
2022 20,536 947 21,483 4.4%
2023 20,980 971 21,951 4.4%
2024 21,054 984 22,038 4.5%
2025 20,935 874 21,808 4.0%
2026 19,744 847 20,591 4.1%
2027 19,744 846 20,591 4.1%
2028 19,738 846 20,584 4.1%
2029 19,724 846 20,570 4.1%
2030 19,701 846 20,547 4.1%
Source: Big River Analytics Calculations
Figure 2.2.3: Population Pyramids, Low Development Scenario, Total Region, 2020, 2025,
2030
Source: Big River Analytics Calculations
Scenario 2 - Medium Economic Development
Scenario 2 (Figure 2.2.4) assumes that all development that occurred in the low scenario proceeds,
in addition to the following local and regional economic development:
● Skeena Industrial Development Park development continues with ongoing infrastructure
additions (roads, power) and two additional facilities being developed in 2024 and 2026 (150
permanent jobs per facility).
Big River Analytics Ltd. I 9● RIELP begins construction in Q1 2022 in Prince Rupert and continues until 2022-2023. The
construction workforce is estimated at 250, followed by 150 permanent workers after
construction.
● Fairview Container Terminal Expansion concludes in 2022, creating approximately 300
additional full-time equivalent jobs at the terminal, located in Prince Rupert.
In this scenario, the aggregate population for both the City of Terrace and the RDKS, Electoral
Areas E and C, grows 8.3% between 2020 and 2030 (20,116 to 21,790), reaching a peak of 22,769
in 2024 (Table 2.2.2). The shadow population peaks at a total of 1,009 in 2024, driven by the LNG
Canada project as well as the additional development forecasted to occur in Scenario 2. The
decrease in population seen after 2025 in Figure 2.2.4 reflects the completion of the construction
components for all but the Skeena Industrial Development Park development. The shadow
population stabilizes after 2026 as permanent work begins for all economic development projects.
Figure 2.2.5 shows that under the medium development scenario, the population’s age structure
shifts over the projection horizon, with an overall increase in the working-age population during
2025, reflecting the period of peak development. This shift is most pronounced for the age cohorts of
30-34 to 55-59. An increase in infants between 2020 and 2025 represents natural population growth
in the region.
Figure 2.2.4: Medium Development Scenario Population Projections, Total Region, 2010 to
2030
Source: Big River Analytics Calculations; BC Stats population estimates and projections; Statistics Canada. Table
17-10-0142-01 Population estimates, July 1, by census subdivision, 2016 boundaries.
Notes: The population projection includes estimates for the usual residents and the shadow population. The BC Stats
estimates and projections are for Community Health Service Area 5171, Terrace City Centre, and 5172, Terrace Rural,
which encompasses a larger geographic region than the boundaries for the population survey and the Statistics Canada
population estimates. Consequently, estimates using the LHA boundary 5172 are not directly comparable to Statistics
Canada population estimates or the population projections.
Big River Analytics Ltd. I 10Table 2.2.2: Medium Development Scenario Population Projections, Total Region, 2020 to
2030
Year Usual Residents Shadow Population Total Population Shadow Population (% of Total)
2020 19,230 886 20,116 4.4%
2021 20,537 910 21,447 4.2%
2022 20,916 956 21,872 4.4%
2023 21,460 995 22,455 4.4%
2024 21,760 1,009 22,769 4.4%
2025 21,868 899 22,767 3.9%
2026 20,907 872 21,779 4.0%
2027 20,923 871 21,795 4.0%
2028 20,932 871 21,803 4.0%
2029 20,930 871 21,802 4.0%
2030 20,919 871 21,790 4.0%
Source: Big River Analytics Calculations
Figure 2.2.5: Population Pyramids, Medium Development Scenario, Total Region, 2020, 2025,
2030
Source: Big River Analytics Calculations
Scenario 3 - High Economic Development
Scenario 3 assumes that all development that occurred in the low and medium scenarios proceeds,
in addition to the following local and regional economic development:
● Skeena Industrial Development Park continues with an additional two facilities being added
in 2028 and 2030 (150 permanent jobs per facility).
Big River Analytics Ltd. I 11● Rio Tinto Alcan, Kemano Tunnel 2 sees a re-start of tunnel excavation works in the third
quarter of 2020, finishing by 2021.
● LNG Canada Interconnection continues and concludes in 2023.
● Kitimat LNG and Pacific Trails Pipeline construction starts in 2022 and concludes in 2027,
creating an estimated 4,500 jobs at its peak between 2023 and 2025, and 150 permanent
jobs after completion.
In this scenario, the aggregate population for both the City of Terrace and the RDKS, Electoral
Areas E and C, grows 13.9% from 2020 to 2030 (20,116 to 22,907). The population increases
rapidly to a peak in 2025 before dropping the following year and resuming a slow increase
throughout the remainder of the time period (Table 2.2.3). The shadow population mirrors this
trajectory, but with an earlier peak of 1,371 in 2024. The temporary decline in population after 2025
represents the end of peak construction for the LNG Canada project as well as the Kitimat LNG
project. Figure 2.2.7 shows that under the high development scenario, the population’s age structure
shifts over the projection horizon, with a strong increase in the working-age population from 2020 to
2030, most particularly for ages 25-29 to 60-64. We observe a marked increase in the number of
infants between 2020 and 2025, suggesting that natural growth, in addition to increased migration, is
driving population growth.
Figure 2.2.6: High Development Scenario Population Projections, Total Region, 2010 to 2030
Source: Big River Analytics Calculations; BC Stats population estimates and projections; Statistics Canada. Table
17-10-0142-01 Population estimates, July 1, by census subdivision, 2016 boundaries.
Notes: The population projection includes estimates for the usual residents and the shadow population. The BC Stats
estimates and projections are for Community Health Service Area 5171, Terrace City Centre, and 5172, Terrace Rural,
which encompasses a larger geographic region than the population survey and the Statistics Canada population
estimates. Consequently, estimates using the LHA boundary 5172 are not directly comparable to Statistics Canada
population estimates or the population projections.
Big River Analytics Ltd. I 12Table 2.2.3: High Development Scenario Population Projections, Total Region, 2020 to 2030
Year Usual Residents Shadow Population Total Population Shadow Population (% of Total)
2020 19,230 886 20,116 4.4%
2021 20,537 910 21,447 4.2%
2022 21,022 1,027 22,049 4.7%
2023 21,627 1,105 22,733 4.9%
2024 22,308 1,371 23,679 5.8%
2025 22,497 1,312 23,809 5.5%
2026 21,012 932 21,944 4.2%
2027 21,221 881 22,102 4.0%
2028 21,490 874 22,364 3.9%
2029 21,765 874 22,639 3.9%
2030 22,033 874 22,907 3.8%
Source: Big River Analytics Calculations
Figure 2.2.7: Population Pyramids, High Development Scenario, Total Region, 2020, 2025,
2030
Source: Big River Analytics Calculations
Discussion
The three population projections scenarios presented in Section 2.2 all show population growth from
2020 to 2024, concurrent with the peak construction period of the LNG Canada and Coastal GasLink
projects, as well as the Mills Memorial Hospital construction. In particular, we note that the shadow
population in all three scenarios peaks in 2024. Similarly, the proportion of shadow population to
total population in all three scenarios is highest between 2023 and 2024, before stabilizing
(Scenarios 1 and 2) or falling (Scenario 3) starting in 2025. This suggests that the population growth
Big River Analytics Ltd. I 13exhibited in Scenarios 3 from 2025 to 2030 is largely driven by usual residents. This hypothesis is
also reflected in the increase in the number of infants and children aged 5 to 9 by 2030 (see Figure
2.2.7).
BC Stats’ P.E.O.P.L.E estimates (2019) collate data at the level of Terrace Local Health Area 517
(see Appendix C). This area is larger than that encompassed by the City of Terrace and the RDKS,
Electoral Areas C and E, as defined by the 2020 Population Survey; therefore, the BC Stats base
population is larger than the combined population estimate of 20,116. Additionally, P.E.O.P.L.E 2019
did not include the Q4 2018 Major Projects Inventory (MPI), thereby making any direct comparisons
with our results difficult. That said, we can observe in Table 2.2.4 that the P.E.O.P.L.E projection
shows a steady upward trend throughout the period, growing 8% from 2020 to 2030. This growth
trend is most similar to that of the medium development scenario.
Table 2.2.4: Terrace Local Health Area 517, P.E.O.P.L.E Population Projections, 2020 to 2030
Year Total Population
2020 21,583
2021 21,782
2022 21,978
2023 22,171
2024 22,364
2025 22,546
2026 22,717
2027 22,878
2028 23,033
2029 23,175
Source: BC Stats, 2019
Notes: All figures are as of July 1.
Big River Analytics Ltd. I 14Appendix A - Methodological Appendix: Population
Estimates
A1. Producing the Sample
A stratified sample of 730 households was produced, with 373 private dwellings in the City of
Terrace (see Table A1.3), and 357 private dwellings in the RDKS Electoral Areas C and E (see
Table A1.4). The private dwelling counts listed in Table A1.1 were used to calculate the survey
sample size. Our measures of precision/accuracy used were for a 0.05 margin of error, 95%
confidence interval.
Table A1.1: Population and Private Dwelling Counts, City of Terrace and RDKS Areas C & E,
2016 Census
Private Dwellings Occupied Average Household
Census Subdivision Population by Usual Residents Density
Terrace, CY 11,643 4,625 2.5
Kitimat-Stikine C (Part 1) & E 6,827 2,850 2.4
Total Region 18,470 7,475 2.5
Source: Statistics Canada, 2016 Census of Population, Catalogue no. 98-316-X2016001
Notes: Total region refers to the summation of the City of Terrace and Kitimat-Stikine C (Part 1) and E.
To increase the accuracy of the results, we divided the sample by dwelling types. Different dwelling
types are likely to have different counts of residents/dwelling due to each dwelling’s size and
functionality (i.e., apartments usually have fewer residents per dwelling compared to a detached
home). We use the 2016 Census dwelling type percentages found in Table A1.2 to achieve the most
accurate distribution of sampled survey participants amongst the following dwelling types:
● Detached Dwelling
● Attached Dwelling
● Apartment
● Mobile Home
For the RDKS Electoral Areas C and E, we combine the Attached Dwelling and Apartment type
because the counts for each group are small.
Big River Analytics Ltd. I 15Table A1.2: Counts and Percentages of Dwellings by Type, Terrace and RDKS Areas C & E,
2016 Census
Count of Dwelling Percentage of Dwelling
Dwelling Kitimat-Stikine Total Kitimat-Stikine Total
Type Terrace, CY C (Part 1) & E Region Terrace, CY C (Part 1) & E Region
Detached 2,845 2,200 5,045 62% 77% 67%
Attached 630 145 775 14% 5% 10%
Apartment 945 75 1,020 20% 3% 14%
Mobile Home 205 430 635 4% 15% 8%
Total 4,625 2,850 7,475 100% 100% 100%
Source: Statistics Canada, 2016 Census of Population, Catalogue no. 98-400-X2016017
Note: Due to rounding the Total Region Percentage of Dwellings by type does not appear to add up to 100%. Total Region
refers to the summation of the City of Terrace and Kitimat-Stikine C (Part 1) and E.
The distribution of dwelling types successfully surveyed, for both the City of Terrace and the RDKS
(see Table A1.3 and A1.4), closely follows the distribution of dwelling types reported by the 2016
Census. This mirrored distribution supports our goal of collecting a sample representative of the
current population in terms of dwelling characteristics.
Table A1.3: Survey Sample Statistics by Dwelling Type, City of Terrace, 2020
Sample Sample 2016 Census
Dwelling Type Sample Size Responses Distribution Distribution Response Rate
Detached 212 150 58% 62% 71%
Attached 51 38 15% 14% 75%
Apartment 93 58 23% 20% 62%
Mobile Home 17 11 4% 4% 65%
Total 373 257 100% 100% 69%
Source: Big River Analytics Calculations
Table A1.4: Survey Statistics by Dwelling Type, RDKS Areas C & E, 2020
Sample Sample 2016 Census
Dwelling Type Sample Size Responses Distribution Distribution Response Rate
Detached 257 158 75% 77% 61%
Attached &
28 21 10% 8% 75%
Apartment
Mobile Home 54 33 16% 15% 61%
Total 357 212 100% 100% 59%
Source: Big River Analytics Calculations
Finally, when collating the City of Terrace administrative data we observe an additional 136
dwellings in 2020 compared to what was estimated in the 2015 Survey of Population and Projection
report (see Table A1.5).
Big River Analytics Ltd. I 16Table A1.5: Residential Dwelling Counts and Percentages by Type, Terrace, Administrative
Data, 2015 & 2020
Dwelling Type 2020 Count 2015 Count 2020 Percentages 2015 Percentages
Detached 3,694 3,118 73% 64%
Attached 612 1,028 12% 21%
Apartment 539 562 11% 11%
Mobile Home 195 196 4% 4%
Total 5,040 4,904 100% 100%
Source: Administrative Data from the City of Terrace
A2. Enumeration
A total of 469 survey responses were received, for an aggregate response rate of 64%. The margin
of error for the total population estimate is +/- 8%, 46 times out of 50. Table A2.1 and A2.2 present
the survey response results for the City of Terrace and for the RDKS, Electoral Areas C and E,
respectively.
Table A2.1: Survey Response Statistics by Dwelling Type, City of Terrace, 2020
Average Household
Dwelling Type Dwelling Count Resident Count Density Shadow Population
Detached 150 398 2.7 13
Attached 38 85 2.2 7
Apartment 58 105 1.8 4
Mobile Home 11 21 1.9 0
Total 257 609 2.4 24
Source: Big River Analytics Calculations
Table A2.2: Survey Response Statistics by Dwelling Type, RDKS Areas C & E, 2020
Average Household
Dwelling Type Dwelling Count Resident Count Density Shadow Population
Detached 158 464 2.9 24
Attached & Apartment 21 52 2.5 4
Mobile Home 33 75 2.3 5
Total 212 591 2.8 33
Source: Big River Analytics Calculations
A3. Questionnaire
The survey questionnaire consisted of the following questions:
1. As of May 1, 2020, how many people (all ages) are living or staying, even temporarily, at this
address?
2. Is this address the usual place of residence for all residents? (e.g., where they usually live,
where their mail goes to, where they stay most nights?).
Big River Analytics Ltd. I 173. For how many of the residents you mentioned, is this NOT their usual place of residence?
4. During the past year, of those for whom this is not their usual place of residence, how many
worked at least 30 days in the greater City of Terrace or surrounding area2?
5. How many people living at this address, if any, are currently conducting work that supports or
is in association with the LNG Canada project? (LNG Canada export facility/plant)
6. For the individual currently conducting work that supports or is in association with the LNG
Canada project, is this their usual place of residence?
7. For those individuals currently conducting work that supports or is in association with the
LNG Canada project, for how many is this NOT their usual place of residence?
A4. Additional Survey Results
LNG employee population estimates are derived from responses to survey Questions 5 through 7
listed in Section A3. An estimated 586 individuals who conduct work that supports LNG Canada
were usual residents in Terrace as of May 1, 2020 (Table A4.1). An additional 397 LNG Canada
employees had their usual residence in the RDKS, Electoral Areas C and E, as of May 1, 2020
(Table A4.2). In the RDKS, Electoral Areas C and E, an estimated 122 LNG employees were found
to be part of the hard shadow population, for a total LNG employee population estimate of 519 for
the RDKS, Electoral Areas C and E, and 1,105 for the region as a whole. The majority of employees
associated with the LNG Canada project reside in work camps that are not captured by these
assessments. They do not impact demographic growth trends, but may still serve to stimulate
economic activity or the perception of economic activity on-the-ground.
Table A4.1: LNG Employee Population Estimate, Terrace, 2020
Estimate Usual Resident Hard Shadow Total
Mean 586 0 586
Lower Confidence Limit 315 0 315
Upper Confidence Limit 857 0 857
Source: Big River Analytics Calculations
Table A4.2: LNG Employee Population Estimate, RDKS Areas C & E, 2020
Estimate Usual Resident Hard Shadow Total
Mean 397 122 519
Lower Confidence Limit 232 0 232
Upper Confidence Limit 563 287 850
Source: Big River Analytics Calculations
2
Note: Greater City of Terrace and surrounding area includes the City of Terrace and the RDKS, Electoral
Areas C and E.
Big River Analytics Ltd. I 18Appendix B - Methodological Appendix: Economic
Scenarios & Population Projections
B1. Detailed Assumptions
1. All local jobs result in additions to the usual resident population (as opposed to the shadow
population) because local jobs are treated as permanent jobs. The City of Terrace and
RDKS, Electoral Areas C and E, are relatively remote communities and people moving for a
local job are assumed to stay, so that the City of Terrace or RDKS, Areas C and E, become
their place of usual residence.
2. Regional jobs result in additions to the usual resident and shadow populations. Specifically,
40% of regional jobs that end up in the City of Terrace and RDKS, Electoral Areas C and E,
are assigned to the shadow population, while 60% are assumed to become usual residents.
3. Local manufacturing jobs produce local indirect jobs at a rate of 1.6 indirect jobs per local
manufacturing job in a tradeable goods industry. This multiplier is informed by the Moretti
(2010) study.
4. Local jobs taken up by usual residents support 2.00 people. This is estimated using data
from the 2016 National Household Survey. Specifically, it is the ratio of the total population in
Terrace and RDKS, Electoral Areas C and E, to the number of household maintainers.
5. We assume that the RDKS, Electoral Areas C and E, receives 30% of all local and regional
jobs and associated immigrants. This is informed by internal City of Terrace documentation.
6. The City of Terrace receives a 7% spillover of all the jobs created in Kitimat related to the
modelled projects. This estimate is informed by conversations with respective unions that
provided skilled labour during the Kitimat Modernization Project (KMP), and in conversation
with the Haisla Shuttle, a company that provided daily transportation from Terrace to Kitimat
during the KMP. The operational spillover effect after construction is 20%. These
percentages are also applied to the RDKS, Electoral Areas C and E.
7. The City of Terrace and the RDKS, Electoral Areas C and E, receives a 2.5% spillover of
jobs created in Prince Rupert. This estimate is informed by the literature indicating that
spillover effects decline exponentially as a function of distance. This makes sense because
Kitimat can be considered a reasonable daily commute for people staying in the City of
Terrace or the RDKS, Electoral Areas C and E, while Prince Rupert may not be considered a
reasonable daily commute from either of these regions. This assumption is further supported
by the work of Monte, et al. (2015). The operational spillover effect after construction is 5%.
8. Assume 170 jobs in the traded goods sector for any manufacturing facility built in the City of
Terrace and the RDKS, Electoral Areas C and E. This number is informed by the estimated
job creation from the single planned manufacturing facility (QETDZ phase 1 job estimates).
Big River Analytics Ltd. I 199. The total number of person-years3 detailed in the respective project descriptions is equal to
the cumulative number of person-years that will take place over the construction horizon of
any project.
10. The distribution of person-years associated with a proposed project is defined by the
identified peak employment level, the number of person-years, and the construction time
estimate detailed in the respective project descriptions.
11. Shadow populations are only in Terrace and the RDKS, Electoral Areas C and E, during the
project construction horizon and they do not reproduce or die during their time in Terrace.
12. Usual residents become integrated into the City of Terrace’s population and the population
residing in the RDKS, Electoral Areas C and E, and they are included in the usual population
dynamics of the city (reproduction and mortality).
13. In the calculation of natural growth and decline, we assume that births come before deaths.
14. The age and gender profile of immigrants to the City of Terrace and the RDKS, Electoral
Areas C and E, for regional jobs will have the same age and gender profile of migrants to the
WoodBuffalo region in Alberta between 2015 and 2019.
B.2 Additional Figures
Figure B2.1 shows the births per thousand women for British Columbia between 2000 and 2018.
There is a decrease in births per thousand women for the age groups 15 to 20 and a slight increase
in births for those over the age of 30. This indicates an overall shift in fertility trends as women
continue to have children later in life. The total fertility rate, which is an estimate of the average
number of live births a female can be expected to have in her life-time, decreased from 1.43 in 2012
to 1.28 in 2018. This decreasing fertility trend and outward shift in the age women are deciding to
have children is reflected in the stable population counts of the zero migration scenario for the total
region (see Figure 2.2.1).
3
Person-year is a unit of measurement for the amount of work done by an individual throughout the entire
year, it is not a measure of jobs, but the amount of time spent doing a specific job. For example, three years
spent doing one job is three-person years of employment.
Big River Analytics Ltd. I 20Figure B2.1: Age Specific Fertility for British Columbia, 2000 to 2018
Source: Statistics Canada Crude Birth Rate, Age-Specific Fertility Rates, and Total Fertility Rate (2019)
Table B2.1: Percentage of Population for Projection Breakdown by Region, 2020
Estimate Usual Residents Total Shadow Total Population
Terrace 64% 53% 63%
RDKS Area C & E 36% 47% 37%
Source: Big River Analytics Calculations
Notes: Percentage of the population is derived from the survey results and population estimations. The Big River Analytics
calculated distribution of the population between Terrace and the RDKS Areas C & E is supported by the almost identical
distribution calculated from 2016 Census population data.
Table B2.2: Low Development Scenario Population Projections, City of Terrace, 2020 to 2030
Year Usual Residents Shadow Population Total Population
2020 12,229 471 12,700
2021 12,831 484 13,315
2022 13,060 503 13,563
2023 13,342 516 13,858
2024 13,389 523 13,912
2025 13,313 464 13,777
2026 12,556 450 13,006
2027 12,556 450 13,006
2028 12,552 450 13,002
2029 12,543 450 12,993
2030 12,529 450 12,978
Source: Big River Analytics Calculations
Big River Analytics Ltd. I 21Figure B2.2: Low Development Scenario Population Projections, City of Terrace, 2010 to 2030
Source: Big River Analytics Calculations; BC Stats population estimates and projections; Statistics Canada. Table
17-10-0142-01 Population estimates, July 1, by census subdivision, 2016 boundaries.
Notes: The total population includes estimates for the usual residents and the shadow population. The BC Stats estimates
and projections are for Community Health Service Area 5171, Terrace City Centre, which is reflective of the geographical
boundaries used for Statistics Canada estimates and the 2020 Population Projection survey estimates.
Table B2.3: Low Development Scenario Population Projections, RDKS Areas C & E, 2020 to
2030
Year Usual Residents Shadow Population Total Population
2020 7,001 415 7,416
2021 7,345 427 7,772
2022 7,476 444 7,920
2023 7,638 455 8,093
2024 7,665 461 8,126
2025 7,621 410 8,031
2026 7,188 397 7,585
2027 7,188 397 7,585
2028 7,186 397 7,582
2029 7,181 397 7,577
2030 7,172 397 7,569
Source: Big River Analytics Calculations
Big River Analytics Ltd. I 22Figure B2.3: Low Development Scenario Population Projections, RDKS Areas C & E, 2010 to
2030
Source: Big River Analytics Calculations; BC Stats population estimates and projections; Statistics Canada. Table
17-10-0142-01 Population estimates, July 1, by census subdivision, 2016 boundaries.
Notes: The total population includes estimates for the usual residents and the shadow population. The BC Stats estimates
and projections are for Community Health Service Area 5172, Terrace Rural, which encompasses a larger geographic
region than the population survey and the Statistics Canada population estimates. Consequently, estimates using the LHA
boundary 5172 are not directly comparable to Statistics Canada population estimates or the population projections.
Table B2.4: Medium Development Scenario Population Projections, City of Terrace, 2020 to
2030
Year Usual Residents Shadow Population Total Population
2020 12,229 471 12,700
2021 13,060 484 13,544
2022 13,302 508 13,809
2023 13,647 529 14,176
2024 13,838 536 14,374
2025 13,907 478 14,384
2026 13,296 463 13,759
2027 13,306 463 13,769
2028 13,311 463 13,774
2029 13,310 463 13,773
2030 13,303 463 13,766
Source: Big River Analytics Calculations
Big River Analytics Ltd. I 23Figure B2.4: Medium Development Scenario Population Projections, City of Terrace, 2010 to
2030
Source: Big River Analytics Calculations; BC Stats population estimates and projections; Statistics Canada. Table
17-10-0142-01 Population estimates, July 1, by census subdivision, 2016 boundaries.
Notes: The total population includes estimates for the usual residents and the shadow population. The BC Stats estimates
and projections are for Community Health Service Area 5171, Terrace City Centre, which is reflective of the geographical
boundaries used for Statistics Canada estimates and the 2020 Population Projection survey estimates.
Table B2.5: Medium Development Scenario Population Projections, RDKS Areas C & E, 2020
to 2030
Year Usual Residents Shadow Population Total Population
2020 7,001 415 7,416
2021 7,477 427 7,903
2022 7,615 448 8,063
2023 7,813 466 8,279
2024 7,922 473 8,395
2025 7,961 421 8,383
2026 7,611 409 8,020
2027 7,617 408 8,026
2028 7,620 408 8,029
2029 7,620 408 8,028
2030 7,616 408 8,024
Source: Big River Analytics Calculations
Big River Analytics Ltd. I 24Figure B2.5: Medium Development Scenario Population Projections, RDKS Areas C & E, 2010
to 2030
Source: Big River Analytics Calculations; BC Stats population estimates and projections; Statistics Canada. Table
17-10-0142-01 Population estimates, July 1, by census subdivision, 2016 boundaries.
Notes: The total population includes estimates for the usual residents and the shadow population. The BC Stats estimates
and projections are for Community Health Service Area 5172, Terrace Rural, which encompasses a larger geographic
region than the population survey and the Statistics Canada population estimates. Consequently, estimates using the LHA
boundary 5172 are not directly comparable to Statistics Canada population estimates or the population projections.
Table B2.6: High Development Scenario Population Projections, City of Terrace, 2020 to 2030
Year Usual Residents Shadow Population Total Population
2020 12,229 471 12,700
2021 13,060 484 13,544
2022 13,369 545 13,914
2023 13,754 587 14,341
2024 14,187 729 14,915
2025 14,307 697 15,004
2026 13,362 495 13,858
2027 13,495 468 13,963
2028 13,666 464 14,131
2029 13,841 464 14,306
2030 14,012 464 14,476
Source: Big River Analytics Calculations
Big River Analytics Ltd. I 25Figure B2.6: High Development Scenario Population Projections, City of Terrace, 2010 to
2030
Source: Big River Analytics Calculations; BC Stats population estimates and projections; Statistics Canada. Table
17-10-0142-01 Population estimates, July 1, by census subdivision, 2016 boundaries.
Notes: The total population includes estimates for the usual residents and the shadow population. The BC Stats estimates
and projections are for Community Health Service Area 5171, Terrace City Centre, which is reflective of the geographical
boundaries used for Statistics Canada estimates and the 2020 Population Projection survey estimates.
Table B2.7: High Development Scenario Population Projections, RDKS Areas C & E, 2020 to
2030
Year Usual Residents Shadow Population Total Population
2020 7,001 415 7,416
2021 7,477 427 7,903
2022 7,653 481 8,134
2023 7,874 518 8,392
2024 8,121 643 8,764
2025 8,190 615 8,805
2026 7,650 437 8,087
2027 7,726 413 8,139
2028 7,824 410 8,233
2029 7,924 410 8,333
2030 8,021 410 8,431
Source: Big River Analytics Calculations
Big River Analytics Ltd. I 26Figure B2.7: High Development Scenario Population Projections, RDKS Areas C & E, 2011 to
2030
Source: Big River Analytics Calculations; BC Stats population estimates and projections; Statistics Canada. Table
17-10-0142-01 Population estimates, July 1, by census subdivision, 2016 boundaries.
Notes: The total population includes estimates for the usual residents and the shadow population. The BC Stats estimates
and projections are for Community Health Service Area 5172, Terrace Rural, which encompasses a larger geographic
region than the population survey and the Statistics Canada population estimates. Consequently, estimates using the LHA
boundary 5172 are not directly comparable to Statistics Canada population estimates or the population projections.
Big River Analytics Ltd. I 27Appendix C - Geographic Areas
C1. 2016 Census Boundaries
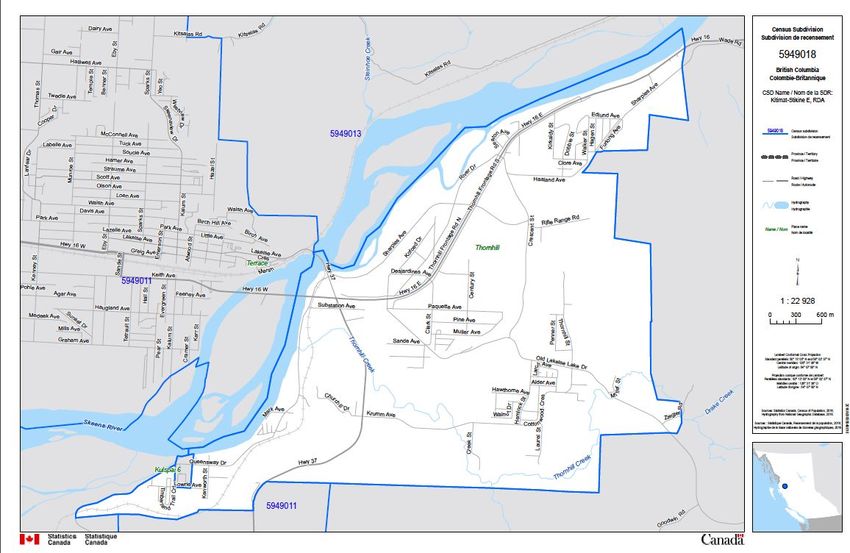
Figure C1.1: Terrace, CY, Census Subdivision
Source: Statistics Canada, 2016a.
Big River Analytics Ltd. I 28Figure C1.2: Kitimat-Stikine C (Part 1), Regional District Electoral Area (Census Subdivision)
Source: Statistics Canada, 2016b.
Figure C1.3: Kitimat-Stikine E, Regional District Electoral Area (Census Subdivision)
Source: Statistics Canada, 2016c.
Big River Analytics Ltd. I 29C2. Local Health Authority Boundaries
Figure C2.1: 517 Terrace
Source: BC Ministry of Health, 2018.
Big River Analytics Ltd. I 30C3. Survey Samples
Figure C3.1: City of Terrace Survey Samples, 2020
Source: Big River Analytics, 2020 Survey of Population
Big River Analytics Ltd. I 31Figure C3.2: RDKS (Electoral Areas C and E) Survey Samples, 2020
Source: Big River Analytics, 2020 Survey of Population
Big River Analytics Ltd. I 32References
BC Stats. (2019). BC Population Estimates by Sub-Provincial Areas, 2011 to 2019 ( dataset).
Released November 26, 2019. https://catalogue.data.gov.bc.ca/dataset/bc-population-estimates
(accessed August 19, 2020).
Monte, F., Redding, S., RossiHansberg, E. (2015) Commuting, Migration, and Local Employment
Elasticities. https://www.princeton.edu/~erossi/CMLEE.pdf (accessed August 18, 2015).
Moretti, E., (2010). Local Multipliers. American Economic Review: Papers & Proceedings 100 (May
2010): 1–7. http://eml.berkeley.edu//~moretti/multipliers.pdf (accessed August 18, 2015).
Statistics Canada. (n.d.). Table 34-10-0129-01 Canada Mortgage and Housing Corporation, vacancy
rates, apartment structures of six units and over, privately initiated in urban centres of 10,000 to
49,999. DOI: https://doi.org/10.25318/3410012901-eng (accessed August 19, 2020).
Statistics Canada. (2017a). Terrace, CY [Census subdivision], British Columbia and Kitimat-Stikine,
RD [Census division], British Columbia (table). Census Profile. 2016 Census. Statistics Canada
Catalogue no. 98-316-X2016001. Ottawa. Released November 29, 2017.
https://www12.statcan.gc.ca/census-recensement/2016/dp-pd/prof/index.cfm?Lang=E
(accessed August 19, 2020).
Statistics Canada. (2017b). Kitimat-Stikine C (Part 1), RDA [Census subdivision], British Columbia
and Kitimat-Stikine, RD [Census division], British Columbia (table). Census Profile. 2016
Census. Statistics Canada Catalogue no. 98-316-X2016001. Ottawa. Released November 29,
2017. https://www12.statcan.gc.ca/census-recensement/2016/dp-pd/prof/index.cfm?Lang=E
(accessed August 19, 2020).
Statistics Canada. (2017c). Kitimat-Stikine E, RDA [Census subdivision], British Columbia and
Kitimat-Stikine, RD [Census division], British Columbia (table). Census Profile. 2016 Census.
Statistics Canada Catalogue no. 98-316-X2016001. Ottawa. Released November 29, 2017.
https://www12.statcan.gc.ca/census-recensement/2016/dp-pd/prof/index.cfm?Lang=E
(accessed August 19, 2020).
Statistics Canada. (2017d). Canada Mortgage and Housing Corporation, average rents for areas
with a population of 10,000 and over.
https://www150.statcan.gc.ca/t1/tbl1/en/tv.action?pid=3410013301
Statistics Canada (2019). Crude birth rate, age-specific fertility rates and total fertility rate (live
births). https://www150.statcan.gc.ca/t1/tbl1/en/tv.action?pid=1310041801
Big River Analytics Ltd. I 33Statistics Canada (2020). Population estimates, July 1, by census subdivision, 2016 boundaries.
https://www150.statcan.gc.ca/t1/tbl1/en/cv!recreate.action?pid=1710014201&selectedNodeIds=
1D4398,1D4466,1D4504&checkedLevels=&refPeriods=20150101,20190101&dimensionLayout
s=layout3,layout2&vectorDisplay=false
Terrace Standard. (2020). Terrace house prices on steep climb in 2019. Terrace Standard.
https://www.terracestandard.com/news/terrace-house-prices-on-steep-climb-in-2019/
Big River Analytics Ltd. I 34You can also read