IOM COVID-19 IMPACT ON KEY LOCATIONS OF INTERNAL MOBILITY - MONTHLY ANALYSIS 18 AUGUST 2021
←
→
Page content transcription
If your browser does not render page correctly, please read the page content below
IOM COVID-19
IMPACT ON
KEY LOCATIONS OF
INTERNAL MOBILITY

MONTHLY ANALYSIS
18 AUGUST 2021

                    0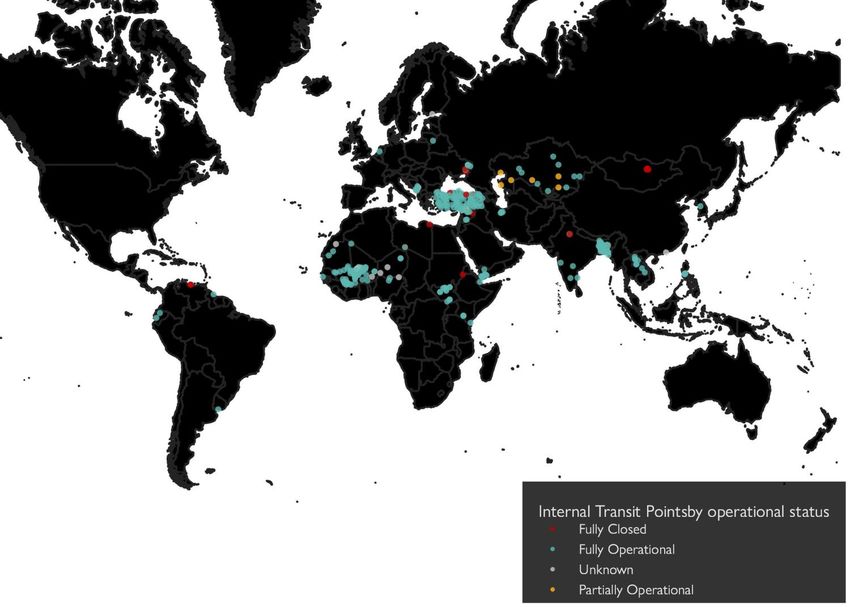
PUBLISHER

The opinions expressed in the report are those of the authors and do not necessarily reflect the
views of the International Organization for Migration (IOM). The designations employed and the
presentation of material throughout the report do not imply the expression of any opinion
whatsoever on the part of IOM concerning the legal status of any country, territory, city or
area, or of its authorities, or concerning its frontiers or boundaries.

IOM is committed to the principle that humane and orderly migration benefits migrants and
society. As an intergovernmental organization, IOM acts with its partners in the international
community to assist in meeting the operational challenges of migration, advance
understanding of migration issues, encourage social and economic development through
migration and uphold the human dignity and well-being of migrants.

Please send any feedback, comments and suggestions related to the Covid-19 Mobility
Tracking dashboards and outputs to the DTM Covid-19 Team at dtmcovid19@iom.int

© 2021 International Organization for Migration (IOM)

All rights reserved. No part of this publication may be reproduced, stored in a retrieval
system, or transmitted in any form or by any means, electronic, mechanical, photocopying,
recording, or otherwise without the prior written permission of the International
Organization for Migration (IOM).
COVER PHOTO:

© Natalie Oren/IOM Nigeria July 2021

IOM Afghanistan’s mobile health teams in Kandahar province offer health services to vulnerable populations who
lack access to basic health services – such as internally displaced persons affected by conflict, returnees and
underserved host communities. In Kandahar province, two teams reach upwards of 250 people daily with essential
basic primary care services in areas where there are no existing health facilities.
In Dand IDP settlement, one of IOM’s teams runs a mobile health clinic which provides medicine, primary
healthcare services including maternal and child healthcare, mental health and psychosocial support and health
education. IOM’s Migration Health unit has served over 700,000 Afghans since the beginning of 2020 with basic
health services.

                                                        IOM COVID-19: Impact on Key Locations of Internal Mobility Monthly Analysis | 2021

                                                                                                                                             1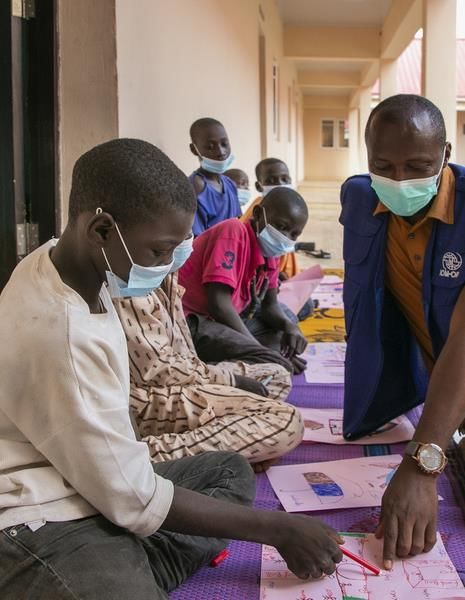
TABLE OF CONTENTS

 METHODOLOGY & DEFINITIONS                                                            3
 EXECUTIVE SUMMARY                                                                    5

   1. NATIONAL-LEVEL MOBILITY RESTRICTIONS                                           6
   2. KEY LOCATIONS OF INTERNAL MOBILITY SCOPE AND COVERAGE                          7
   3. OVERVIEW OF INTERNAL TRANSIT POINTS                                            8
   4. OVERVIEW OF AREAS AND SITES OF INTEREST                                       11
   5. CASE STUDY: NEPAL                                                             14
ANNEX                                                                               16

                                  IOM COVID-19: Impact on Key Locations of Internal Mobility Monthly Analysis | 2021

                                                                                                                       2
Methodology & Definitions
IOM COVID-19 Impact on Key Locations of Internal Mobility Monthly Analysis is meant to serve IOM Member States, IOM, UN and
voluntary partner agencies, the civil society, including media, as well as the general population in analysing the impact of COVID-19
pandemic on different key locations impacting internal mobility. It is particularly relevant when identifying and addressing specific
needs faced by migrants and mobile populations, disproportionately affected by the global mobility restrictions.
The report is based on information provided by IOM field staff, using resources available at the IOM country office level and is
accurate to the best of IOM’s knowledge at the time of compilation. All information is being constantly validated, including the geo-
location and attributes, and through regular assessments and triangulation of information. The updates depend on the time frame
within which the information becomes available and is processed by IOM. For this reason, the analysis is always dated and
timestamped in order to reflect the reality at a given time. However, as the situation continuously evolves and changes, despite
IOM’s best efforts, the analysis may not always accurately reflect the multiple and simultaneous restrictive measures being
imposed at a specific location.
As the situation of the COVID-19 pandemic continues to evolve, the resulting restrictive measures issued to mitigate the spread,
has become increasingly complex and varied. The IOM global mobility database has been updated in a way which reflects the varied
stages of measures issued at different times by countries, territories, or areas (C/T/As). As such, the evolution of global restrictive
measures, has resulted in varied update timelines and can explain the difference in monthly updates.
This report provides an overview and analysis on the data from a global and regional perspective Key Locations of Internal Mobility
and complements the bi-weekly report on Points of Entry (PoE), which focuses on the impact on cross-border movements and can
be found here. For more detailed country-specific information and dataset used for the analysis please visit:
https://migration.iom.int/. For further information on the methodology, definitions and explanation please refer to the
Methodology Framework.
Regional maps are available here.
Data is collected on the following location types:
Other Key Locations of Internal Mobility:
• Internal Transit Points (internal transit point inside a given country, territory or area)
• Areas of interest (region, town, city or sub-administrative unit in a given country, territory or area with internal COVID-19
related restrictive measures, including areas with an outbreak of COVID-19 or areas under lockdown/quarantine)
• Sites with a population of interest (including stranded, repatriated and returning migrants, IDPs, nationals, asylum seekers
and regular travelers, who have been affected by COVID-19 mobility restrictions at specific locations, for example hotels,
temporary reception centers, camps, transit centers and detention centers). For more information on these classifications,
please refer to the IOM Glossary on Migration.
While not included in this report, to give a comprehensive view of the COVID-19-related impact on mobility, please also refer to the
weekly report on Points of Entry (PoEs) mentioned above, which assesses the impact on cross-border movements at locations such
as:
• Airports (currently or recently functioning airport with a designated International Air Transport Association (IATA) code)
• Blue Border Crossing Points (international border crossing point on sea, river or lake)
• Land Border Crossing Points (international border crossing point on land, including rail)
The following operational status is captured for each assessed Internal Transit Point 1 :
• Fully operational:
• Open for entry and exit: all travelers can use the PoE or internal transit point.
• Partially operational:
• Open for commercial traffic only: only transport of goods is permitted, travelers are not allowed to cross;
• Closed for entry: travelers cannot use this location to enter the country, territory or area;
• Closed for exit: travelers cannot use this location to leave the country, territory or area;
• Open for returning nationals and residents only: the location is open to returning nationals and residents only,
including military and humanitarian personnel and other special groups for whom entry and exit is permitted according
to national procedures in place.
• Fully closed:
• Closed for both entry and exit: no one is permitted to use the PoE or internal transit point.
• Unknown
1. Operational status is captured in the same way for all Points of Entry. For more information please refer to the bi-weekly PoE report.
IOM COVID-19: Impact on Key Locations of Internal Mobility Monthly Analysis | 2021
3Methodology & Definitions
The report systematically captures the following types of mobility restrictions in place at assessed Internal Transit Points :
• Movement restricted to this location
• Movement restricted from this location
• Rules pertaining to identification and/or travel documents needed to enter or disembark at this location have changed
• Medical measures including mandatory quarantine or additional medical checks have been imposed at this location
• Requirement for medical certificate confirming a negative COVID-19 test result
• Other
• None
Additionally, more information is collected on areas of interest, specifically concerning whether:
• Public events were cancelled or postponed
• Schools were closed
• Restricted operating hours for public establishments (café, restaurant, etc.) were adopted
• Alternative working arrangements (working remotely, etc.) were implemented
• Movement outside home was restricted
• Lockdown/quarantine measures were enforced by police or military
Country/territory/area level restrictions are aggregated as following:
• Significant mobility restrictions (E.g. curfew, lockdown, state of emergency, medical requirements for international arrivals and
other mobility restrictions)
• No restrictions
• Specific national measures such as: national emergency declared and mandatory quarantine of arrivals from abroad
Affected Populations:
COVID-19 mobility restrictions affect different population categories. For example, for the purpose of this report, stranded migrants
are individuals unable to return as a result of mobility restrictions related to COVID-19. This could include economic migrants,
students, temporary visa or work permit holders. It could also include other populations such as tourists who may be stranded
owning to COVID-19-related travel restrictions. These populations may be seeking repatriation or assistance while remaining
abroad.
Other affected populations include regular travelers, nationals, returnees, irregular migrants, internally displaced persons (IDPs),
migrant workers and refugees. The various populations are affected in diverse ways across the different types of assessed locations,
including but not limited requirements for additional documentation, temporary relocation, quarantine or medical screening, up to
an inability to continue their intended travel.
Public Health Emergency Preparedness and Response Capacities (COVID-19) at Internal Transit Points:
To understand public health emergency preparedness and response capacities with regard to the COVID-19 pandemic, additional
questions are asked about specific public health interventions that have been put in place in the specified locations including both
internal transit points as well as PoEs. These include risk communication and community engagement, infection prevention and
control, and measures to detect, manage and refer ill travelers suspected of having COVID-19, existence of standard operating
procedures, health screening, presence and functionality of a referral system for suspected COVID-19 cases, and the availability of
an isolation space for suspected cases before referral to designated health facility.
List of acronyms used throughout the report
• C/T/As: countries, territories or areas
• DTM: Displacement Tracking Matrix
• IDPs: Internally Displaced Persons
• ITP: Internal Transit Point
• PoE: Point of Entry
• p.p.: Percentage Point 2
• SOPs: Standard Operating Procedures
Data is geographically aggregated by IOM Regional Offices. The list of countries under each IOM Regional Office can be found
here: https://www.iom.int/regional-offices
2. Not to be confused with per cent, percentage point (p.p.) refers to an increase or decrease of a percentage rather than an increase or decrease in the raw number.
IOM COVID-19: Impact on Key Locations of Internal Mobility Monthly Analysis | 2021
4Executive summary
The current COVID-19 pandemic has affected global mobility both in terms of international mobility restrictions and restrictive
measures on internal movement. To better understand how COVID-19 affects global mobility, IOM has developed a global mobility
database to gather, map and track data on these restrictive measures impacting movement. This report provides a global
perspective of the COVID-19-related measures and restrictions imposed by countries, territories and areas impacting internal
movements, as well as the resulting effects on stranded migrants and other population categories. The information in this report
relies on a compilation of inputs from multiple sources, including from IOM staff in the field, DTM reports on flow monitoring and
mobility tracking.
Data has been collected between 13 March 2020 and 12 August 2021. Data for 6 per cent of the assessed locations has been
updated since the beginning of July, while data for 1 per cent of the assessed locations has been updated in June, with 1 per cent of
the assessed locations that have been updated in May, while 1 per cent was last updated in April and 11 per cent in March. The data
for the remaining assessed internal locations was last updated before March 2021 (specifically, 2% in February, 1% in January, 4% in
December, 3% in November, 4% in October, 3% in September, 6% in August, 6% in July, 16% in June, 11% in May, 15% in April and
9% in March). For more information see Table 3 in the Annex.
Through this exercise, IOM collected information from 187 C/T/As across all IOM regions. Among these, 34 per cent (63 C/T/As)
declared a national emergency due to the COVID-19 pandemic and 77 per cent introduced some sort of mobility restriction. Some
restrictive measures that have been adopted are quarantine for all international arrivals (67%) and the suspension of the issuance of
new visas (26%). On the other hand, some facilitations for stranded populations have also been adopted, such as the automatic
extension of expired visas and working permits (27%) and the removal of fines for visa overstays and expired residency and working
permits (32%).
Key Locations of Internal Mobility (Internal Transit Points, Areas of Interest, and Sites with Populations of Interest):
• IOM assessed 1,596 key locations located in 141 C/T/As, including 395 internal transit points, 529 areas of interest and 672 sites
with population of interest.
• Assessed internal transit points and areas of interest were mostly situated in Asia and the Pacific, while the highest number of
assessed sites with population of interest were from the East and Horn of Africa and the European Economic Area.
• 89 per cent of the assessed internal transit points were fully operational, with 6 and 3 per cent which were respectively either
fully closed or partially operational. Moreover, 49 per cent of the assessed internal transit points had introduced medical
measures within the location.
• The most common restrictive measures in place in the assessed areas of interest included the cancellation of public events (52%
of the assessed areas), school closure (49%), alternative working arrangements (47%) and restricted operating hours for public
establishments (46%). Moreover, non-essential movements outside home were restricted in 15 per cent of the assessed areas
while lockdown or quarantine measures were enforced by police or military in 21 per cent of the cases.
• Stranded foreign nationals were reported in 64 per cent of the assessed sites with populations of interest, while in 19 and 14 per
cent of cases respectively nationals and foreign nationals on their way to their country of origin were reported to be present in
the assessed sites with population of interest.
IOM COVID-19: Impact on Key Locations of Internal Mobility Monthly Analysis | 2021
51. National-level mobility restrictions
34%
Declared national emergency
77%
imposed significant mobility
restrictions4
27%
automatically extended visas
and working permits
187 67%
imposed mandatory
quarantine for international
Assessed C/T/As arrivals
31% 26%
suspended the issuance of
removed fines for visa
overstays, expired residency new visas
and work permits
Number of C/T/As which imposed significant mobility restrictions by
IOM region
Asia and the Pacific 30
European Economic Area 26
Central and North America and the Caribbean 20
Southern Africa 14
South-Eastern Europe, Eastern Europe and Central Asia 14
Central and West Africa 13
South America 10
Middle East and North Africa 10
East and Horn of Africa 7
4. These mobility restrictions include, among others, curfew, lockdown, checkpoints and patrols.
IOM COVID-19: Impact on Key Locations of Internal Mobility Monthly Analysis | 2021
62. Key Locations of Internal Mobility: Scope and
Coverage
395 1,201 142
Assessed Internal Transit Points Assessed Areas and Sites Assessed C/T/As
The current COVID-19 pandemic has also affected global mobility in the form of various internal travel disruptions and restrictions. To
better understand how COVID-19 affects internal mobility, globally, IOM has included internal transit points as well as assessed areas
and sites in the global mobility database. IOM maps and gathers data on the locations, status and restrictions at internal transit points
as well as other sub-administrative such as areas of outbreak of COVID-19 or areas under lockdown/quarantine, and sites where
populations of interest, such as stranded foreign nationals and IDPs, are particularly affected.
This report provides an overview and analysis on the data from a global and regional perspective, using data updated as of 12
August 2021.
IOM has assessed a total of 1,589 locations (including internal transit points, areas of interest and sites with population of interest)
in 142 countries, territories and areas so far. The highest share of these assessed locations, which remained consistent, was sites with
populations of interest (42%), followed by areas of interest and important internal transit points between cities and regions, with 33
and 25 per cent respectively. More details can be found in Table 1 in the Annex.
Table 1: Number (#) and percentage (%) of assessed locations by type and IOM region
Sites with
Internal transit No. of
Total Areas of interest population of
Region points C/T/As
interest
# % # % # % # % #
Asia and the Pacific 323 100% 121 37% 105 33% 97 30% 28
Central and North America
157 100% 2 1% 103 66% 52 33% 18
and the Caribbean
West and Central Africa 183 100% 102 56% 30 16% 51 28% 10
East and Horn of Africa 168 100% 21 13% 20 12% 127 76% 9
European Economic Area 214 100% 3 1% 99 46% 112 52% 25
Middle East and North Africa 153 100% 26 17% 64 42% 63 41% 17
South America 66 100% 6 9% 19 29% 41 62% 9
South-Eastern Europe,
Eastern Europe and Central 299 100% 114 38% 77 26% 108 36% 15
Asia
Southern Africa 33 100% 0 0% 12 36% 21 64% 11
Total 1596 100% 395 25% 529 33% 672 42% 142
IOM COVID-19: Impact on Key Locations of Internal Mobility Monthly Analysis | 2021
73. Overview of Internal Transit Points
395 89%
of the assessed internal transit
49%
of the assessed locations
Internal Transit Points
assessed in 34 C/T/As points are fully operational imposed medical restrictions
(no change compared to the (no change compared to the
previous report) previous report)
Of the 395 internal transit points monitored in 34 countries, territories or areas, a large majority were reported as fully
operational (89%, i.e. no change compared to the previous report). The remaining internal transit points are either fully closed
(6%, i.e. no change compared to last month) or partially operational (3%, i.e. no change compared to one month ago), with 3
per cent of the assessed internal transit points whose operational status is unknown. Moreover, approximately half of the
assessed locations (193 out of 395, 49% of the total: no change compared to the previous report) have imposed medical
restrictions, such as quarantine or medical screening.
IOM-assessed internal transit points were mostly situated in Asia and the Pacific (31%), South-Eastern Europe, Eastern Europe
and Central Asia (29%) and West and Central Africa (26%). Specifically, almost two thirds of the assessed internal transit points
were from only four countries: Turkey (81 assessed internal transit points, 21% of the total), Mali (74, 19%), Bangladesh (50,
13%) and the Philippines (44, 11%). The operational status of the assessed internal transit points appears very similar across the
abovementioned regions with a majority of locations that are fully operational. For more information, please refer to Table 4 in
the Annex.
In 237 out of the 395 assessed internal transit points (60% of the total, i.e. no change compared to the previous report), the
foreseen duration of the restrictions was unknown (i.e. information was unavailable). In 22 and 14 per cent of the cases the
restrictions will be in place for 14 days to one month or less than 14 days, respectively. Only in 14 internal transit points (4% of
the total), the restrictive measures will be valid for more than one month.
These restrictions had an impact on all categories of population (for more details, see Table 5 in the Annex), especially on
nationals (affected in 61% of the assessed locations) and regular travelers (60%). Irregular migrants (in 24% of the assessed
internal transit points), returnees (19%) and IDPs (16%) have also been affected by the abovementioned restrictions. Finally, a
less significant impact has also been reported on migrant workers (in 11% of the assessed locations) and refugees (6%).
IOM COVID-19: Impact on Key Locations of Internal Mobility Monthly Analysis | 2021
83. Overview of Internal Transit Points
Operational status of the assessed internal Percentage of internal transit points with
transit points affected population
Fully closed Partially operational
Nationals 61%
Fully operational Unknown
Regular travellers 60%
3% 6% Irregular migrants 24%
3%
Returnees 19%
IDPs 16%
Migrant workers 11%
Refugees 6%
89%
Percentage of Internal Transit Points
Global map of assessed internal transit points and their operational status
Disclaimer: This map is for illustration purpose only. The boundaries and the names shown and
the designations used on this map do not imply official endorsement or acceptance by IOM.
IOM COVID-19: Impact on Key Locations of Internal Mobility Monthly Analysis | 2021
93. Overview of Internal Transit Points
Public Health Measures
The global mobility database collects information on public health measures in assessed internal transit points through IOM’s
missions participating in this exercise. The data are collected in five categories, covering various aspects of public health capacity at
the PoEs. The categories are: 1) Standard Operating Procedures; 2) Risk communication and community engagement; 3) Infection
prevention and control; 4) Surveillance; and 5) Referral system. Among the 395 internal transit points assessed by country missions,
response rates for these public health questions range from 31 to 65 per cent. Please see Table 6 in the Annex for more details on
specific questions asked and the response rate for each question.
For the detection, management and referral of ill travellers, standard operating procedures were reported to be in place at 49 out
of 255 (19%) of identified internal transit points.
On risk communication and community engagement, 147 out of 245 (60%) assessed internal transit points reported that
information on COVID-19 was provided to travellers at the site through leaflets, posters or announcements. In 135 out of 234 (58%)
internal transit points, handwashing stations were available as an infection prevention and control measure.
Health screening using non-contact thermometers was reported in 115 out of 122 (94%) assessed internal transit points. Moreover,
18 out of 130 (14%) assessed internal transit points reported that there was infrastructure in place to support crowd control and
ensure safety of screeners, whereas 21 out of 242 (9%) assessed internal transit points reported that the availability of an isolation
space for suspected COVID-19 cases, prior to their appropriate referral.
A functional referral system was reported to be in place at 35 out of 241 (15%) assessed internal transit points.
Examining these public health measures and interventions across various levels (e.g. local, national, regional) can facilitate the
detection, assessment, and notification or reporting of events that can collectively contribute to prompt and effective responses to
public health emergencies such as COVID-19.
Assessed internal transit points with the relevant public health measure*
SOPs in place at the site for management and referral
49 out of 255; 19%
of ill travellers
Information about COVID-19 being provided at site 147 out of 245; 60%
Handwashing station at the site 135 out of 234; 58%
Health screening with temperature check using non-
115 out of 122; 94%
contact thermometer
Infrastructure at the site to support crowd control and
18 out of 130; 14%
ensure safety of screeners
Isolation space exist for evaluation of any suspect case
21 out of 242; 9%
away from crowds
Referral system in place at the site 35 out of 241; 15%
*Covered points with response to each public health question.
Disclaimer: The reported findings on Public Health measures should be considered with important caveats. The descriptive
summary provided in this report is aimed at providing a rapid capture of assessed ITPs in terms of these public health measures
and prompt more detailed rigorous evaluation. Data collection is conducted by country offices with varying resources and
capacity, as such assessment coverage, data collection methodologies and modalities vary. Data validation, such as verification
from those designated International Health Regulation (IHR) focal points and/or competent authorities at each ITP is not
presently possible. These factors impose limitations to the ability to conduct analysis across POE settings within or between
countries, territories and areas and comparisons externally at regional and global levels. Furthermore, the limitations of the
exercise may impact the consistency of the captured public health measures, and the inter-rater reliability across different
enumerators, influencing the quality of the data.
IOM COVID-19: Impact on Key Locations of Internal Mobility Monthly Analysis | 2021
104. Overview of Areas and Sites of Interest
4.1. Areas of Interest
529 20% 52%
areas assessed of the assessed areas are located in of the assessed areas have
in 82 C/T/As the IOM region of Asia and the Pacific restrictions on public events
In total, 529 areas of interest were assessed in 82 countries, territories and areas. These areas were chosen from sub-national
units of interest, such as areas of outbreak of COVID-19 or areas under lockdown/quarantine. Assessed areas consist of cities,
towns and regions. Cancellation of public events, school closures, restricted operating hours for public establishments and
alternative working arrangements can be listed as restrictive measures imposed in these areas.
The IOM region of Asia and Pacific continued to have the highest share of assessed areas (105 out of 529 assessed areas or
20%), followed by the IOM region of Central and North America and the Caribbean (103 out of 529 assessed areas or 19%). The
IOM region of European Economic Area followed with 19 per cent, IOM Region of South-Eastern Europe, Eastern Europe and
Central Asia had 15 per cent and the IOM region of Middle East and North Africa had 12 per cent of the assessed areas (99, 77,
and 64 areas respectively).
The type of restrictive measures being imposed on the assessed areas varied. In 52 per cent of assessed areas (274
out of 529 assessed areas) public events were cancelled or postponed. Schools were closed also in 49 per
cent of the assessed areas (257 areas). Restricted operating hours for public establishments (café, restaurant, etc.)
and alternative working arrangements (working remotely, etc.) were in place in 46 and 47 per cent of the assessed areas (243
and 250 areas respectively). Movement outside home was restricted in 15 per cent of the assessed areas while
lockdown or quarantine measures were enforced by police or military in 21 per cent of them (78 and 113 assessed
areas). The largest proportion of areas (33%) reported their expected duration of restrictions as 14 days to one month, followed
by less than 14 days (19%), one to three months (11%), specific date (3%) and more than 3 months (1%). However, in 33 per cent
of assessed areas, the expected duration of restrictions was unknown.
Number and type of restrictions in areas of interest by IOM region
Public events cancelled or postponed
Schools closed
Restricted operating hours for public establishments (café, restaurant, etc.)
Alternative working arrangements (work remotely, etc.)
Restricted movement
Southern Africa
South-Eastern Europe, Eastern Europe and Central Asia
South America
Middle East and North Africa
European Economic Area
East and Horn of Africa
Central and West Africa
Central and North America and the Caribbean
Asia and the Pacific
0% 10% 20% 30% 40% 50% 60% 70% 80% 90% 100%
Number and percentage of areas of interest
IOM COVID-19: Impact on Key Locations of Internal Mobility Monthly Analysis | 2021
114. Overview of Areas and Sites of Interest
4.2. Sites with Populations of Interest
672 19% 64%
sites assessed of the assessed sites are located in the of the assessed sites have reported
in 119 C/T/As IOM region of East and Horn of Africa cases of stranded foreign nationals
In total, 672 (three additional sites assessed during this period) sites were assessed in 119
countries, territories and areas. These sites were selected as they concern populations of interest such as stranded
foreign nationals and IDPs. Hotels, temporary reception centers, camps, transit centers and detention centers can be given as
examples of such assessed sites.
Affected population groups consisted of stranded, repatriated and returning
migrants, IDPs, asylum seekers and regular travelers. In 64 per cent of the assessed sites with populations of interest, foreign
nationals were reportedly stranded (430 out of 672 assessed sites) and in 14 per cent of cases foreign nationals reported returning
to their country of origin (96 sites) were impacted, while in 19 per cent of sites, nationals were affected by restrictive measures
(130 sites). In 2 per cent of the sites, there were other affected population groups including migrants and refugees that were in
reception centers before COVID-19 (16 sites). In only one site, IDPs were affected by restrictive measures.
Among the regions, the IOM region of East and Horn of Africa, European Economic Area and South-Eastern Europe, Eastern Europe
and Central Asia had the highest proportion of sites (19%, 17%, and 16% respectively). IOM region of European Economic Area had
the highest proportion of sites with stranded foreign nationals in the country (25% or 105 out of 430 stranded foreign nationals),
followed by the IOM region of South-Eastern Europe, Eastern Europe and Central Asia with 23 per cent. The IOM region of Asia and
Pacific has the highest proportion of sites with reported cases of nationals returning to their country of origin (37%) followed by
IOM Region of Central and North America and the Caribbean with 22 per cent, while IOM region of East and Horn of Africa
reported the highest per cent of sites with reported cases of affected nationals (55%). Analysis within regions can be also
conducted in order to investigate the distribution of sites with populations of interest in certain regions. In 95 and 93 per cent of
the sites in the IOM region of European Economic Area and IOM region of South-Eastern Europe, Eastern
Europe and Central Asia, respectively, there were reported cases of stranded foreign nationals. In 38 per cent of the sites in IOM
region of Asia and Pacific and the region of Central and North America and the Caribbean, separately, there were reported cases of
foreign nationals returning to their country of origin, who were impacted while nationals were the most impacted the most in IOM
Region of East and Horn of Africa (in 57% of the assessed sites).
Number of sites with population of interest disaggregated by population categories and IOM region
Stranded foreign nationals in the country
Foreign nationals returning to their country of origin (repatriation, deportation, etc.)
IDPs
Nationals
Unknown
European Economic Area 105 6 1
South-Eastern Europe, Eastern Europe… 100 242
Middle East and North Africa 51 6 33
East and Horn of Africa 49 4 72 2
Asia and the Pacific 41 37 11 7
Central and North America and the… 26 20 6
South America 22 14 5
Central and West Africa 22 1 28
Number of sites of interest
Southern Africa 14 61
IOM COVID-19: Impact on Key Locations of Internal Mobility Monthly Analysis | 2021
124. Overview of Areas and Sites of Interest
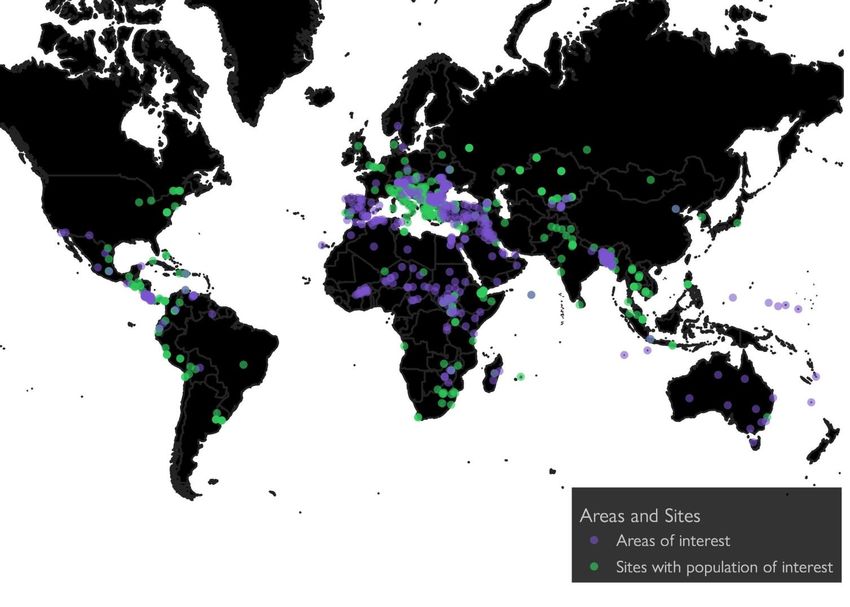
Global map of assessed Areas and Sites of Interest
Disclaimer: This map is for illustration purpose only. The boundaries and the names shown, and the
designations used on this map do not imply official endorsement or acceptance by IOM.
IOM COVID-19: Impact on Key Locations of Internal Mobility Monthly Analysis | 2021
13Annex: Tables
Table 2: Number of C/T/As which imposed significant mobility restrictions by IOM region
No. of
Region Yes No Unknown n/a C/T/As per
region
Asia and the Pacific 30 7 0 3 40
Central and North America and the Caribbean 20 2 0 3 25
Central and West Africa 13 7 0 2 22
East and Horn of Africa 7 1 0 1 9
European Economic Area 26 4 0 0 30
Middle East and North Africa 10 7 0 0 17
South America 10 0 0 0 10
South-Eastern Europe, Eastern Europe and Central Asia 14 5 0 0 19
Southern Africa 14 1 0 0 15
Total 144 34 0 9 187
Table 2.1: Measures taken by C/T/As in response to COVID-19
Measure taken in response to COVID-19 Yes No Unknown n/a Total
Automatic extension of visas and work permits 50 50 45 42 187
National emergency declared 63 114 0 10 187
Quarantine for international arrivals 125 52 0 10 187
Removal of fines for visa overstays or expired residency or work
59 37 49 42 187
permit
Significant mobility restrictions 144 34 0 9 187
Suspension of issuance of new visas 48 106 0 33 187
Table 3: Number of location updates by month
Location Type March 2020 March 2020 (%) April 2020 April 2020 (%) May 2020 May 2020 (%)
Area 89 17% 54 10% 44 8%
Area2 0 0% 181 27% 54 8%
Internal Transit Point 47 12% 11 3% 79 20%
Total 136 9% 246 15% 177 11%
Location Type June 2020 June 2020 (%) July 2020 July 2020 (%) August 2020 August 2020 (%)
Area 74 14% 63 12% 58 11%
Area2 65 10% 30 4% 32 5%
Internal Transit Point 112 28% 6 2% 13 3%
Total 251 16% 99 6% 103 6%
September September 2020 October 2020 October 2020 November November 2020
Location Type 2020 (%) (%) 2020 (%)
Area 20 4% 6 1% 0 0%
Area2 18 3% 24 4% 36 5%
Internal Transit Point 10 3% 32 8% 17 4%
Total 48 3% 62 4% 53 3%
IOM COVID-19: Impact on Key Locations of Internal Mobility Monthly Analysis | 2021
14Annex: Tables
Table 2: Number of C/T/As which imposed significant mobility restrictions by IOM region
December December January 2021 February February 2021
Location Type January 2021
2020 2020 (%) (%) 2021 (%)
Area 3 1% 3 1% 0 0%
Area2 29 4% 1Annex: Tables
Table 2: Number
Table 6:ofPublic
C/T/As which
health imposed
measures at significant mobility
395 assessed restrictions
internal by IOM region
transit points
Don't Response
Public health measures Yes No No response Total responses
know rate%
Standard operating procedures
SOPs in place at the site for management and referral of ill
49 87 119 140 255 65%
travelers
Risk communication
Information about COVID-19 being provided at site 147 64 34 150 245 62%
Infection prevention and control
Handwashing station at the site 135 68 31 161 234 59%
Surveillance
Health screening with temperature check using non-contact
115 0 7 273 122 31%
thermometer
Infrastructure at the site to support crowd control and ensure
18 7 105 265 130 33%
safety of screeners
Isolation space exists for evaluation of any suspect case away
21 88 133 153 242 61%
from crowds
Referral system
Referral system in place at the site 35 75 131 154 241 61%
Table 7: Number of areas of interest in each IOM Region
No. of
Region Areas of interest Percentage of Total
C/T/As
Asia and the Pacific 105 20% 10
Central and North America and the Caribbean 103 19% 9
West and Central Africa 30 6% 4
East and Horn of Africa 20 4% 5
European Economic Area 99 19% 17
Middle East and North Africa 64 12% 15
South America 19 4% 7
South-Eastern Europe, Eastern Europe and
77 15% 10
Central Asia
Southern Africa 12 2% 5
Total 529 100% 82
IOM COVID-19: Impact on Key Locations of Internal Mobility Monthly Analysis | 2021
16Annex: Tables
Table 7.1: Number and type of restrictions in areas of interest
Public Restricted operating Alternative working Lockdown/
events Schools hours for public arrangements Restricted quarantine
Region Total
cancelled or closed establishments (café, (work remotely, movement enforced by police
postponed restaurant, etc.) etc.) or military
Asia and the
20 18 19 22 3 7 105
Pacific
Central and
North America
93 93 93 93 5 6 103
and the
Caribbean
Central and
18 18 5 0 11 18 30
West Africa
East and Horn
16 8 8 19 2 1 20
of Africa
European
10 7 10 9 5 3 99
Economic Area
Middle East and
31 33 29 29 35 35 64
North Africa
South America 18 18 16 16 15 4 19
South-Eastern
Europe, Eastern
63 58 62 61 1 31 77
Europe and
Central Asia
Southern Africa 5 4 1 1 1 8 12
Total 274 257 243 250 78 113 529
Table 7.2: Duration of restrictive measures in areas of interest
Duration No. of Areas of interest Percentage
1 - 3 months 60 11%
14 days to One month 174 33%
Less than 14 days 100 19%
More than 3 months 6 1%
Specific Date 16 3%
Unknown 173 33%
Total 529 100%
Table 8: Affected population categories in the sites of interest
Affected population categories No. of Sites of interest Percentage
Foreign national returning (on the
way) to origin 96 14%
(Returnee/Repatriation/Deportation…)
Foreign national stranded in country
430 64%
(Stranded)
IDPs 2 0%
Nationals 130 19%
Unknown 14 2%
Total 672 100%
IOM COVID-19: Impact on Key Locations of Internal Mobility Monthly Analysis | 2021
17Annex: Tables
Table 8.1: Number
Table (#)
7.2:of
Duration
sites disaggregated
of restrictivebymeasures
population
in categories
areas of interest
and by IOM region
Foreign nationals
Stranded
returning to their
foreign
country of origin IDPs Nationals Unknown Total
nationals in
Region (repatriation,
the country
deportation, etc.)
# % # % # % # % # % # Region’s %
Asia and the Pacific 41 42% 37 38% 1 1% 11 11% 7 7% 97 100%
Central and North
America and the 26 50% 20 38% 0 0% 6 12% 0 0% 52 100%
Caribbean
Central and West
22 43% 1 2% 0 0% 28 55% 0 0% 51 100%
Africa
East and Horn of
49 39% 4 3% 0 0% 72 57% 2 2% 127 100%
Africa
European Economic
105 94% 6 5% 0 0% 1 1% 0 0% 112 100%
Area
Middle East and
51 81% 6 10% 0 0% 3 5% 3 5% 63 100%
North Africa
South America 22 54% 14 34% 0 0% 5 12% 0 0% 41 100%
South-Eastern
Europe, Eastern
100 93% 2 2% 0 0% 4 4% 2 2% 108 100%
Europe and Central
Asia
Southern Africa 14 67% 6 29% 1 5% 0 0% 0 0% 21 100%
Total 430 64% 96 14% 2 0% 130 19% 14 2% 672 100%
IOM COVID-19: Impact on Key Locations of Internal Mobility Monthly Analysis | 2021
18You can also read