SCALLOP STOCK ASSESSMENT IN QUEBEC COASTAL WATERS IN 2019 - DFO-MPO
←
→
Page content transcription
If your browser does not render page correctly, please read the page content below
Canadian Science Advisory Secretariat
Quebec Region Science Advisory Report 2020/054
SCALLOP STOCK ASSESSMENT IN QUEBEC COASTAL
WATERS IN 2019
Source: DFO 2011
Figure 1. Scallop fishing areas in Quebec.
Context:
Two scallop species are fished commercially in the Gulf of St. Lawrence, namely the Sea Scallop
(Placopecten magellanicus) and the Iceland Scallop (Chlamys islandica). A Digby dredge is used to
harvest scallops near shore, and catches are landed mostly as meat (muscle). Given the difficulty to
visually distinguish the meat of the two species, commercial fishing statistics are presented regardless
of the species. However, scallops caught in one area are usually of the same species.
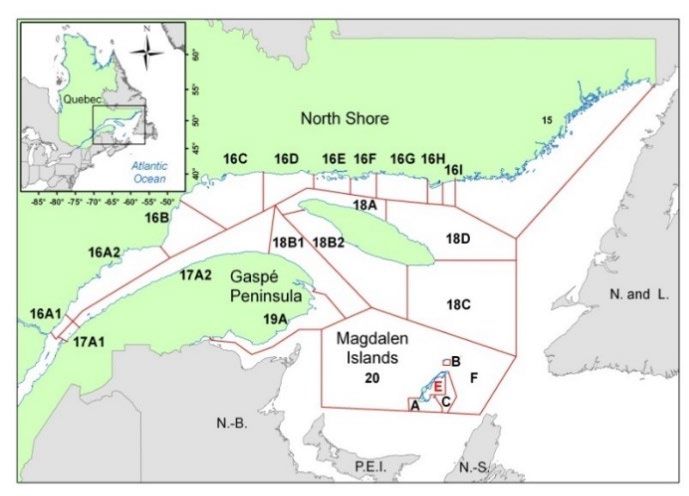
Quebec waters are divided into 24 fishing areas (Figure 1) where access is limited to a small number of
fishermen. Fishing effort is also regulated by a fishing season, and catches are restricted by quotas or a
limited number of fishing days.
The resource is assessed every three years, with some exceptions, to determine whether recent
changes in the status of the resource may justify adjusting the conservation approach and management
plan. The main indicators used in this assessment include landings, fishing effort, catch per unit effort,
size structure, weight of muscle landed and density index from scientific surveys.
This Science Advisory Report is from the February 26, 2020 Stock assessment of scallop in Quebec
inshore waters. Additional publications from this meeting will be posted on the Fisheries and Oceans
Canada (DFO) Science Advisory Schedule as they become available.
January 2021
Stock assessment of Scallop in Quebec
    Quebec Region                                                       coastal waters in 2019

SUMMARY
•     From 2016 to 2019, Quebec’s average annual scallop landings totaled 73.8 t of meat, a
      16 % increase from 2013–2015. Fishing effort dropped by 5 % from 2013–2015. Sixty-six %
      of the landings were from the Magdalen Islands, 33 % from the North Shore and 1 % from
      the Gaspe Peninsula.

North Shore
•     Landings, which consisted primarily of Iceland Scallops, increased by 65 % during 2016–
      2019 compared to 2013–2015, while fishing effort increased by 24 % as a result of the
      resumption of fishing in Area 16A1.
•     From 2016 to 2019, there was no fishing effort in areas 16A2, 16D, 16G, 16H, 16I and 18D
      and very little in areas 15, 16B, 16C and 18A. Little information is available to assess the
      scallop status in these areas. There are no recommendations for these areas.
•     In Areas 16E and 16F, landings have been historically low since 2013 in contrast with the
      high levels observed prior to 2007.
•     Agence Mamu Innu Kaikusseth (AMIK) carried out two exploratory surveys in 2016 and
      2018 in Areas 16E and 16F. Few locations with substantial densities of commercial-size
      scallop (≥ 70 mm) were found outside of known beds.
•     A rebuilding plan is being developed for Areas 16E, 16F and 18A.
      Area 16E:
•     Since 2013, landings have been less than 16 t compared to levels that were generally above
      50 t prior to 2007. Since 2008, fishing has been concentrated mainly on bed D south of
      Grande Île where recruitment was very good in previous years. Since 2005, the average
      weight of meat landed has remained below the historical average.
•     The latest research surveys show that the density of non-commercial-size scallop (< 70 mm)
      has been in sharp decline since 2016 and was well below the reference mean in 2019. The
      density of commercial-size scallops remains very low, below the reference mean. However,
      two cohorts of small scallop (< 30 mm) were observed within the islands in the 2019 survey.
•     Maintaining fishing effort at the average level of the last four years and keeping the limit on
      bed D at 50% of the effort conducted across the entire area could help maintain current
      densities. Additional conservation measures will be required to help increase densities. In
      addition, minimizing fishing within the islands would favour the survival of the two cohorts of
      small scallop observed in 2019.
      Area 16F:
•     Since 2009, landings have been less than 5 t compared to levels higher than 25 t prior to
      2007. Since 2011, fishing has been concentrated primarily on bed C. The average weight of
      meat landed in the last few years has been close to the historical average.
•     The previous two research surveys showed that the density of commercial- and non-
      commercial-size scallops was below the series average in 2018 and close to the series
      average in 2019. Maintaining the level of fishing effort at the average level of the last four
      years could help maintain current densities.

                                                    2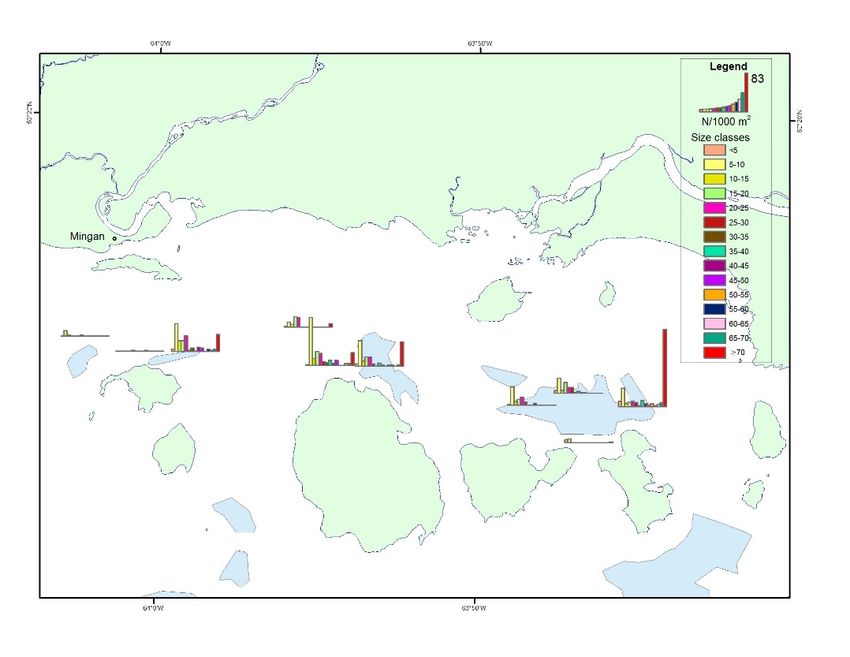
Stock assessment of Scallop in Quebec
    Quebec Region                                                        coastal waters in 2019

      Area 16A1:
•     The fishery in this area resumed in 2017, concentrating on the Île Rouge bed. The total
      allowable catch (TAC) of 10.9 t was exceeded slightly in 2018 and 2019. The weight of meat
      landed is close to the historical average. From 1998 to 2002, this bed was unable to sustain
      an annual exploitation level of about 10 t. Because the bed is located at the western edge of
      the known distribution of scallops and is geographically isolated, it is likely to be more
      vulnerable to overharvesting and to receive smaller and less frequent inputs of larvae than
      beds in other areas.

Gaspé peninsula
•     Landings consisted primarily of Sea Scallops. Landings reached more than 60 t prior to
      2001, and then gradually declined to totals of less than 2 t per year from 2016 to 2019.
      Since 2014, the fishery in this region has been concentrated mainly in Area 19A.
•     Scallop landings and fishing effort declined by 63 % during 2016–2019 compared to 2013–
      2015.
•     From 2016 to 2019, there was no fishing effort in Areas 17A1, 17A2, 18B2, 18C and 18D,
      and very little effort in Area 18B1. Since little information is available to assess the status of
      the resource in these areas, there is no recommendation for these areas.
•     In Area 19A, landings and fishing effort were very low between 2016 and 2019. Over the last
      six years, fishing effort has been concentrated on two beds, leaving a number of beds
      unharvested. In 2017, the CPUE fell to the lowest value in the historical series, but it has
      been on the rise since then. The average CPUE for the past four years is slightly below the
      historical average. The weight of meat landed has declined slightly and is below the
      historical average. There is a high probability that the current fishing effort on these two
      beds will be sustainable until the next assessment.

Magdalen Islands
•     In Area 20A, Sea Scallop landings and CPUEs increased sharply in 2007 and have
      remained relatively stable since then. Fishing effort is distributed evenly across all beds.
•     The 2019 research survey indicates that densities of commercial-size scallop (≥ 100 mm)
      remain high and close to the maximum historical values. Densities of pre-recruit scallops
      measuring 70–84 mm and < 70 mm are slightly above the median of the historical series.
      However, the density of 85–99 mm pre-recruits is below the median of the historical series.
      The density of scallops available to the fishery is expected to be lower in 2020 than it was in
      2019.
•     Decision rules for calculating the fishing effort have been in place since 2010. This effort is
      calculated using CPUEs derived from logbooks and density indices obtained from the
      research survey. The fishing effort needs to be reviewed annually after the indicators are
      updated. For 2020, the maximum fishing effort authorized for Area 20A is 305.5 days at sea.

INTRODUCTION
Biological context
Two scallop species are indigenous to Quebec, namely the Sea Scallop (Placopecten
magellanicus) and the Iceland Scallop (Chlamys islandica). These two species mainly inhabit

                                                     3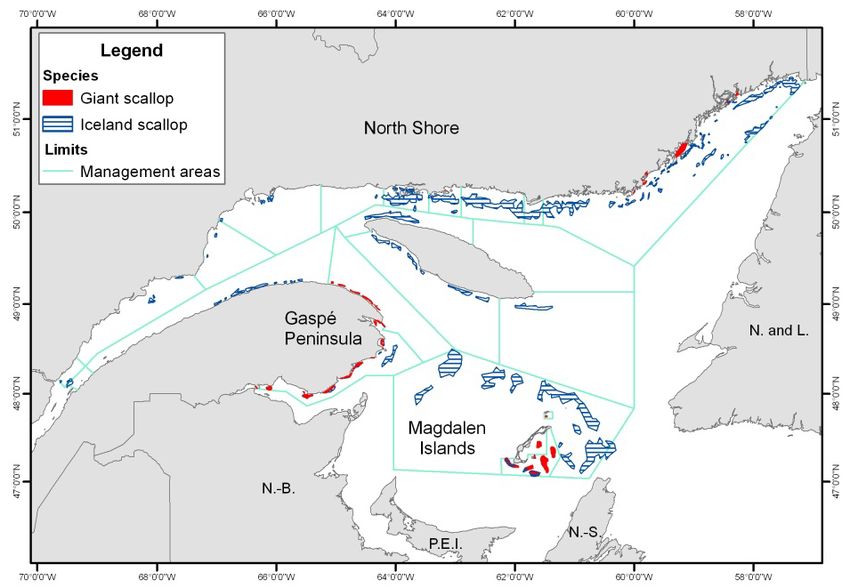
Stock assessment of Scallop in Quebec
 Quebec Region                                                        coastal waters in 2019

gravel, shell or rock substrates, generally at depths of between 20 and 60 metres. Scallops are
sedentary and live in aggregations called beds. The main Iceland Scallop beds exploited are
located along the North Shore, Anticosti Island and along the north shore of the Gaspé
Peninsula (Figure 2), whereas the exploited Sea Scallop beds are located mostly in the
southern Gulf, including the Magdalen Islands, Chaleur Bay, and occasionally, along the Lower
North Shore and the northeast shore of the Gaspe Peninsula.

Figure 2. Known range of the Sea Scallop and Iceland Scallop in Quebec coastal waters.

The Sea Scallop grows more quickly than the Iceland Scallop. Scallop growth rate varies
between areas and is influenced by habitat quality and environmental conditions. In the Gulf of
St. Lawrence, Iceland Scallops reach commercial size at about eight years (70 mm) and Sea
Scallops at about six (100 mm).
For scallops, sexes are separate and eggs are fertilized externally. A scallop’s egg production is
proportional to its size cubed, and successful fertilization depends on the proximity of other
scallops. The spawning period is short and doesn’t occur at the same time throughout the Gulf.
Along the North Shore and around Anticosti Island, spawning occurs between mid-July and late
August, depending on the area. Sea Scallops spawn in August in Chaleur Bay and begin in late
August in the Magdalen Islands.
Larval development takes about five weeks from fertilization to settlement on the seabed.
During this time, the larvae are dispersed throughout the water column. Juvenile scallops
generally attach themselves to the seabed near adults. Scallop beds are usually found in areas
where currents enhance larvae retention, but a good substrate is needed to ensure the
successful attachment of juveniles. During the settlement period, juveniles are very sensitive to
disturbance of the sediment by fishing gear. To ensure the survival of juveniles settled on the
seafloor, it is recommended not to dredge scallop beds from August to November.
The meat yield by weight of a scallop of a given size varies over the reproductive cycle. Muscle
weight peaks in spring just before gonad development, drops to its lowest point during the
spawning period and starts rising again in the fall.

                                                  4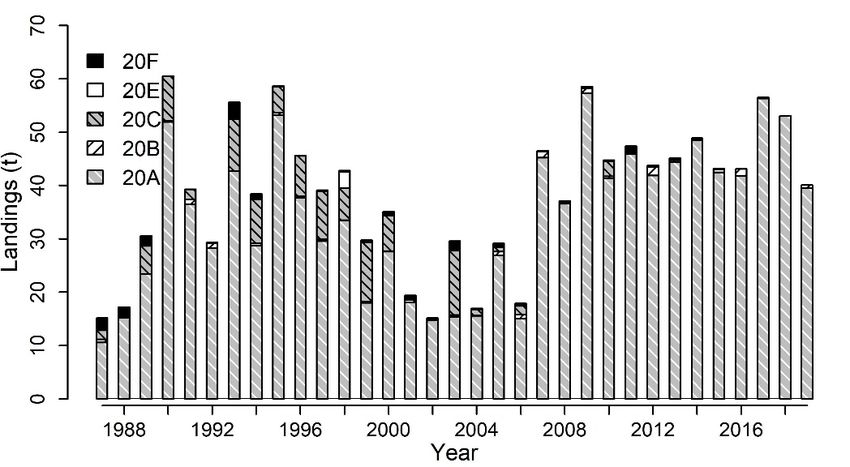
Stock assessment of Scallop in Quebec
 Quebec Region                                                         coastal waters in 2019

Description of the fishery
The commercial scallop fishery in Quebec began in the late 1960s. Scallops are primarily
harvested near shore using a Digby dredge. The commercial fishery targets both scallop
species. Catches are generally landed as meat (muscle) and the statistics provided in this report
are expressed as meat weight. The difficulty in visually distinguishing between the meat of the
two species complicates the analysis of fishing statistics. However, the two species are not
distributed uniformly throughout the Gulf of St. Lawrence, and catches in an area usually consist
of just one species.
Quebec waters are divided into 24 fishing areas, which are grouped into three sectors, the North
Shore (areas 15, 16A1, 16A2, 16B, 16C, 16D, 16E, 16F, 16G, 16H, 16I, 18A, 18D), the Gaspé
Peninsula (areas 17A1, 17A2, 18B1, 18B2, 18C, 19A) and the Magdalen Islands (areas 20A,
20B, 20C, 20E and 20F) [Figure 1]. Few fishermen operate in most of these areas and there
has been little if any fishing effort there. In 2019, 78 regular licences and one exploratory licence
were issued. Management plans were developed for each area, based on the following factors:
vessel length, dredge size (
Stock assessment of Scallop in Quebec
    Quebec Region                                                                       coastal waters in 2019
Table 1. 2019 scallop fishery management measures.
              Number of       Quota         Season          Daily       Dockside      Hail   Hail in     At-sea       VMS1        Size Limit
               Licences    (t meat or     (day/month)     schedule      Monitoring    out              Observers                  and Meat
Area
                             days at                                                                   (% of trips)                Count2
                               sea)
     15        33 + 23          -         Sign4 - 03/12        -             -         -        -           -           -             -
                                                                                      100
    16A1          1          10.9 t       15/04 - 01/12        -             -               100%          5%         100%            -
                                                                                       %
    16A2          1           3.8 t       15/04 - 01/12        -             -         -     100%           -         100%            -
    16B           1           6.8 t       15/04 - 01/12        -             -         -     100%           -           -             -
                                                                                      100
    16C           2          12.8 t       15/04 - 03/11        -           100%              100%          5%           -             -
                                                                                       %
    16D5          -           6.1 t       15/04 - 03/11        -             -         -     100%           -           -             -
                                                           5 a.m. –                   100
    16E           9         94 days   6
                                          Sign - 31/12
                                              4
                                                                          Sporadic           100%           -         100%            -
                                                            8 p.m.                     %
                                                           5 a.m. –                   100
    16F           9         30 days7      Sign4 - 31/12                   Sporadic           100%           -         100%            -
                                                            8 p.m.                     %
    16G8          3          13.7 t       22/04 - 17/11        -             -         -     100%           -           -             -
    16H   9
                  8           8.3 t       Sign - 03/12
                                              4
                                                               -           100%        -     100%           -           -             -
    16I10         -             -         Sign4 - 03/12        -             -         -        -           -           -             -
    17A1          1          10.9 t       01/04 - 30/11        -             -         -     100%          5%         100%    100 mm; 30
    17A2          1           4.0 t       01/04 - 30/11        -             -         -     100%           -         100%    100 mm; 30
                                                          6 a.m. – 9                  100
    18A           9        258 days       Sign - 31/12
                                              4
                                                                          Sporadic           100%           -         100%            -
                                                             p.m.                      %
    18B1          3             -         01/05 - 30/09        -             -         -     100%           -         100%    100 mm; 30

    18B2          3          16.0 t       01/04 - 30/11        -             -         -     100%           -         100%    100 mm; 30

    18C           3          11.0 t       01/04 - 30/11        -             -         -     100%           -         100%            -

    18D11         1          10.0 t       22/04 - 17/11        -             -         -     100%           -           -             -

    19A          312            -         01/05 - 30/09   Day13, time        -         -     100%           -         100%    100 mm; 30
    20A          22   15
                           322 days       01/04 - 31/07   Day , time
                                                             14
                                                                             -         -     100%           -         100%    100 mm; 30
    20B          22             -         01/04 - 31/07   Day , time
                                                             14
                                                                             -         -     100%           -         100%    100 mm; 30
    20C          22             -         01/04 - 31/07   Day , time
                                                             14
                                                                             -         -     100%           -         100%    100 mm; 30
    20E                                                                 Refuge Area
    20F          22             -         01/04 - 31/10   Day14, time        -         -     100%           -         100%    100 mm; 30
1
  = Vessel monitoring system (VMS).
2
  = Minimal legal size and meat count (maximum number of muscles in 500 g) for Sea Scallop.
3
  = Exploratory licence for Iceland Scallop.
4
  = Beginning of the fishery from the signing of the Conservation Harvesting Plan (CHP).
5
  = Open to all scallop licence holders residing between Sept-Îles and Pointe Parent.
6
  = A total of 94 fishing days are allowed, with a maximum of 50 % of the days in bed D. Maximum of 10 hours per day.
7
  = A total of 30 fishing days are allowed. Maximum of 10 hours per day.
8
  = Open to fishermen in group A (Areas 16E, 16F and 18A)
9
  = Open to 2 group A scallop licence holders from the Middle-North Shore and to 4 from zone 15 under conditions.
10
   = Open to all Area-15 scallop licence holders
11
   = Open to all scallop licence holders residing from Tadoussac to Pointe-Parent
12
   = 1 dredge licence and 2 tourist diving licences.
13
   = Between Cap-Gaspé and the Port-Daniel lighthouse: Monday to Friday from 5 a.m. to 6 p.m. and Saturday from 5 a.m. to noon.
     Between the Port-Daniel lighthouse and Miguasha: Monday to Friday from 5 a.m. to 6 p.m.
14
   = Monday to Friday from 5 a.m. to 9 p.m.
15
   = 1 holder has the double fishing days since the 2019 season.

                                                                   6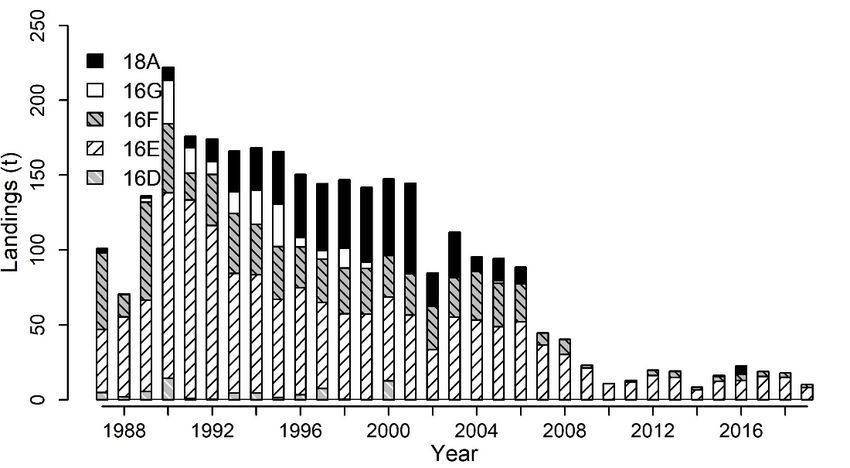
Stock assessment of Scallop in Quebec
 Quebec Region                                                                      coastal waters in 2019

Figure 4. Fishing effort in Quebec expressed in standardized fishing hours per metre of dredge width.

ASSESSMENT
The assessment of the status of scallop populations is based mainly on an analysis of
commercial indices derived from logbooks and sampling at sea or at dockside (Tables 2 and 3).
It is also based on indices derived from research surveys conducted out every two years on
scallop beds in the Mingan area (areas 16E and 16F) and the Magdalen Islands (Area 20A).

Table 2. Catch per unit effort (kg of meat per hour of fishing and metre of dredge width) estimated from
logbooks.
                                                                  Fishing Area
      Year             15        16A1      16B      16C    16E*      16F*        18A*   18B1   19A    20A    20B

     2003             1.64        4.59    1.16        -    2.38      2.06        1.50   1.44   0.68   0.87   0.82
     2004             2.09        3.36    0.74        -    1.89      2.35        1.44   2.31   0.72   0.87   0.62
     2005             2.08        2.69      -         -    1.74      2.10        1.55   5.81   0.83   0.84   0.60
     2006             2.34        1.14      -         -    1.57      1.65        1.27   2.03   0.85   0.60   0.51
     2007             1.74          -       -         -    1.38      1.55        1.13   2.60   0.92   1.64   0.81
     2008               -           -       -         -    1.82      1.61        1.06   2.38   1.12   1.37   0.53
     2009             1.97        2.91      -         -    1.92      1.37        0.48   2.71   0.95   1.83   0.74
     2010             1.73          -       -         -    1.83        -           -    2.91   0.81   1.24   0.58
     2011             1.41          -       -         -    2.14      1.30          -    4.20   0.73   1.35   0.62
     2012             1.25          -       -         -    1.66      1.38        2.12   0.99   0.64   1.32   0.92
     2013               -           -       -         -    1.72      1.40        0.84     -    0.80   1.30   0.45
     2014               -           -       -         -    1.34      1.59          -      -    0.65   1.44   0.60
     2015             1.53          -       -         -    1.43      1.36        1.07   7.58   0.69   1.31   0.83
     2016             0.88          -     4.02        -    1.76      1.81        1.69   2.51   0.74   1.28   0.82
     2017             0.92       13.14      -         -    1.90      1.95          -      -    0.64   1.63   0.54
     2018               -        12.62    4.11      1.47   2.02      2.27          -      -    0.92   1.59   0.32
     2019             1.27       11.09    3.63        -    2.61      2.25          -      -    1.14   1.32   0.61
   1992-2015          1.71        6.05    1.87      5.92   1.74      1.74        1.27   2.38   0.91   1.08   0.72
    Average
* : kg of meat per fishing tow and metre of dredge width

                                                             7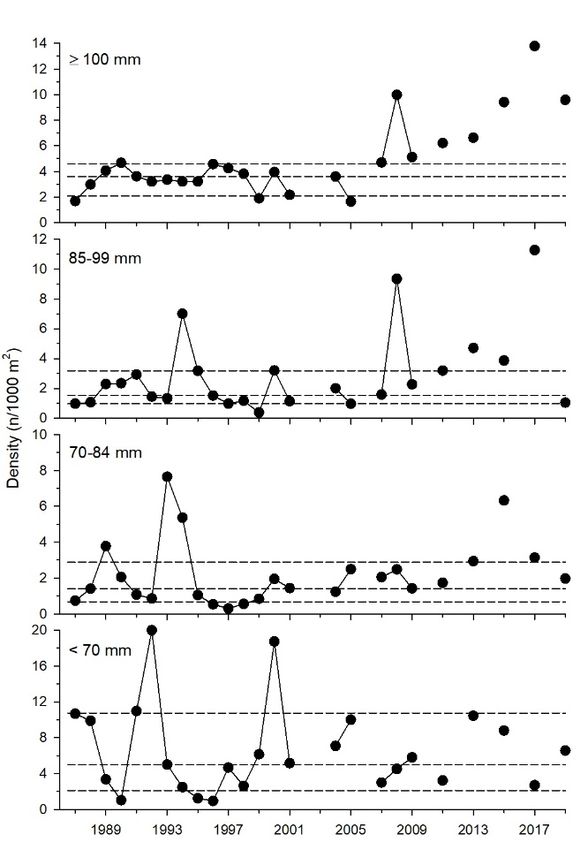
Stock assessment of Scallop in Quebec
 Quebec Region                                                         coastal waters in 2019
Table 3. Average weight of landed meat (g).
                                                 Fishing Area
    Year           15          16A1       16E        16F        18A    18B1     19A       20A

   2003           13.0         11.3       13.5       14.2        9.9    -       21.0      19.7
   2004            -            7.9       13.0       12.0        8.0   29.3     19.9      21.7
   2005           16.8          7.6       10.4       10.9       10.0   32.4     16.1      21.0
   2006           12.9          7.5       11.5       11.2        7.7   30.8     16.4      18.5
   2007            -             -        12.2       11.6         -    35.7     21.1      19.2
   2008            -             -        11.3       11.3         -    36.1     19.5      27.8
   2009            -            6.0       10.8        -           -    31.0     18.1      16.1
   2010            -             -        10.7        -           -    42.4     20.9      23.6
   2011            -             -        11.2       11.2         -    34.8     21.7      24.0
   2012            -             -        11.9       12.1         -     -       20.9      27.3
   2013            -             -        12.2       11.1         -     -       18.9      26.7
   2014            -             -        11.5        -           -     -       18.6      24.8
   2015            -             -        12.9       11.8        8.1   34.5     20.9      24.8
   2016            -             -        11.7       10.9        7.2    -       18.3      24.8
   2017            -            9.3       11.9       10.3         -     -       16.3      20.5
   2018            -            7.0       11.7        -           -     -       17.6      21.2
   2019           15.9          7.0       12.3        -           -     -       16.3      22.6
 1992-2015        14.4          7.5       13.0       11.4        9.8   34.1     18.7      20.6
  Average

North Shore
Iceland Scallops are harvested along the entire North Shore of the Gulf of St. Lawrence, while
Sea Scallops are taken only along the Lower North Shore. The North Shore is divided into 13
separate fishing areas located between the mouth of the Saguenay River and Blanc Sablon and
along the north shore of Anticosti Island. From the late 1980s to the mid-2000s, scallop landings
on the North Shore consistently accounted for more than 65 % of catches in Quebec. In recent
years, this figure has dropped sharply owing to the depletion of certain beds and to socio-
economic circumstances that have been unfavourable for the scallop fishery in this region.
Consequently, the fishing effort on the North Shore has declined markedly and remains low
compared to what it was in the early 2000s. Average North Shore landings were approximately
24.5 t of meat between 2016 and 2019. Compared to 2013-2015, average annual landings from
2016 to 2019 increased by 65 %, for a 24 % increase in fishing effort. These increases are due
to a recovery in activity in the Île Rouge sector in 2017. The landings came from the Île Rouge
(Area 16A1), the Mingan Archipelago area (areas 16E and 16F) and the North Shore of
Anticosti Island (Area 18A). A rebuilding plan is being developed for 16E, 16F and 18A areas
due to the strong historical exploitation of these areas and the depletion of certain beds.
   Upper North Shore (Areas 16A1, 16A2, 16B and 16C)
These areas are harvested by five fishermen, and fishing effort is regulated by the number of
licences issued and quotas. The vast majority of landings on the Upper North Shore come from
Area 16A1 where, after a complete cessation of fishing activities in 2010, harvesting on the Île
Rouge bed resumed in 2017 (Figure 5). Landings in this area totalled 3.3 t, 11.9 t and 11.5 t of
meat in 2017, 2018 and 2019, respectively. The total allowable catch (TAC) of 10.9 t was
exceeded slightly in 2018 and 2019. Landings in the last two years have been relatively high at
levels slightly below those observed in 1998–2002 (except in 1999, when the weight of meat
landed totalled nearly 50 t) shortly before landings decreased sharply. Between 2016 and 2019,

                                                 8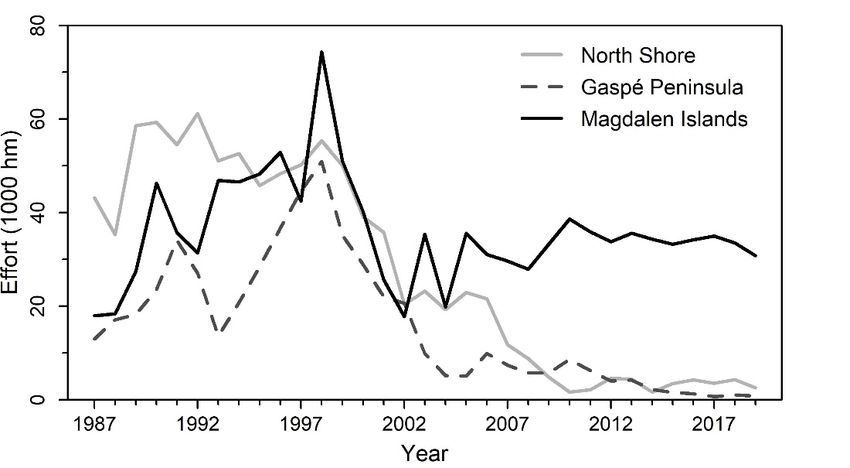
Stock assessment of Scallop in Quebec
 Quebec Region                                                         coastal waters in 2019

four additional days of fishing were conducted outside Area 16A1, i.e. one day each in Areas
16B and 16C in 2018, and two days in Area 16B in 2019.

Figure 5. Scallop landings (t of meat) from Areas 16A1, 16A2, 16B and 16C.

   Middle North Shore (Areas 16D, 16E, 16F, 16G and 18A)
Nine fishing licences provide access to areas 16E, 16F and 18A; three licences are for Area
16G, and all Middle North Shore scallop fishermen have access to Area 16D. Each Area is
regulated by a quota, and there are daily and seasonal restrictions on fishing effort. Middle
North Shore landings for 2016, 2017, 2018 and 2019 were only 22.7, 18.9, 17.9 and 10.3 t of
meat respectively. Landing levels from these areas remain very low compared to the numbers
of the 1987-2006 period (Figure 6).

Figure 6. Scallop landings (t of meat) from areas 16D, 16E, 16F, 16G and 18A.

From the Manitou River to the Île aux Perroquets lighthouse (Area 16D), there hasn’t been any
fishing effort since 2005 except in 2015 when there was one day of fishing. Since 1996,
landings have been low because fishing effort has been sporadic in this area.

                                                   9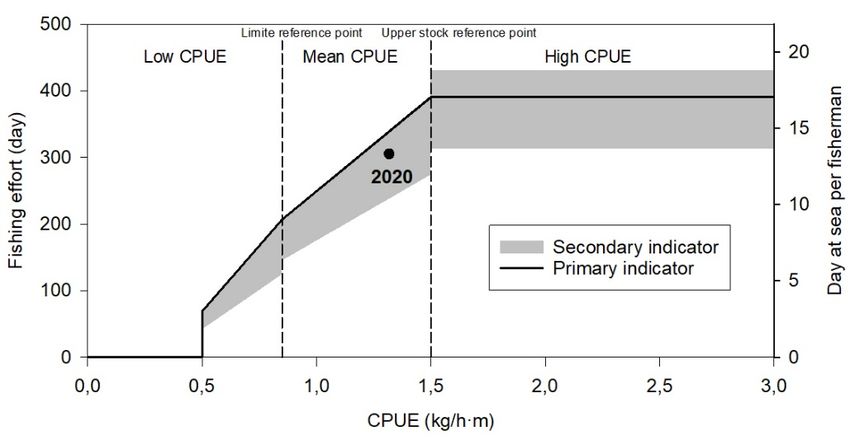
Stock assessment of Scallop in Quebec
 Quebec Region                                                         coastal waters in 2019

In Area 16E, landings were generally greater than 50 t prior to 1997, and then decreased to
levels below 16 t since 2013. Landings for 2016, 2017, 2018 and 2019 were 12.9, 15.7, 15.1
and 8.2 t of meat respectively (Figure 6). These landings have seen an average increase of
16 % compared to the 2013-2015 period. Fishing effort dropped steadily from over 200 days at
sea before 2008 to an average of 56 days for the 2016-2019 period out of an authorized total of
94 days in 2019. The fishing effort observed in this area increased slightly by 2 % relative to the
level observed between 2013 and 2015 and accounted for 60 % of the provisional maximum
authorized effort. Since 2008, fishing effort has been primarily concentrated on a single bed:
bed D south of Grande Île, where strong cohorts recruited to the fishery beginning in 2007. This
strong recruitment had been previously identified since 2003 during research surveys. There
were very few harvesting operations in the other beds in the last four years. CPUEs from
logbooks have been increasing since 2015 and those of the last four years are above the 1992-
2015 average (Table 2). The average weight of meat landed from 2016 to 2019 is slightly lower
than the 2013-2015 period and remains below the historical average (Table 3).

Figure 7. Density index of non-commercial (20 to 69 mm)(Left panel) and commercial (≥70 mm) (Right
panel) scallops based on research surveys in the Mingan area, Area 16E (± standard error). The dotted
lines represent the averages for the 1990-2014 series.

The 2019 research survey in the area 16E indicated that the density of commercial-size scallops
remained very low and below the reference average (Figure 7). The density of non-commercial-
size scallops increased during the 2016 survey, but has decreased significantly since then and
is well below the reference average (Figure 7). However, the last research survey revealed two
cohorts of small scallops (< 30 mm) within the islands (Figure 8). It is important to note that the
5–10 mm cohort was not taken into account when calculating the density of non-commercial-
size scallop (20–69 mm) because it is generally less well sampled by the dredge. In addition,
very few small scallops (< 70 mm) were caught in the outer part of the islands. Both of these
elements explain why the research survey indicates a low density of non-commercial-size
scallop (Figure 7), despite the two strong cohorts of small scallop (< 30 mm) within the islands
(Figure 8).
The Agence Mamu Innu Kaikusseht (AMIK) conducted two exploratory surveys in Areas 16E
and 16F in 2016 and 2018. From a commercial standpoint, few locations with substantial
densities of commercial-size scallop (≥ 70 mm) were found outside of known beds.
In Area 16F, landings have been less than 5 t per year since 2009 compared to levels higher
than 25 t prior to 2007. In 2016–2019, landings and fishing effort in Area 16F decreased by 2 %
and 8 %, respectively, compared to 2013–2015; on average, landings totalled 3.0 t (Figure 6)

                                                  10
Stock assessment of Scallop in Quebec
Quebec Region coastal waters in 2019
and fishing effort stood at 15 fishing days per season out of an authorized total of 30 days.
Since 2011, fishing has been concentrated primarily on bed C. CPUEs derived from logbooks
increased and were above the average of the historical series (Table 2). In recent years (2016
and 2017; no data were available for 2018 and 2019), the average weight of meat landed
declined slightly and was near the historical average (Table 3). The last two research surveys
showed that densities of commercial- and non-commercial-size scallops were below the
average of their respective series in 2018 and close to the average in 2019 (Figure 9).
Figure 8. Scallop densities by size class within the Mingan Islands during the 2019 research survey
conducted in Minganie, Area 16E.
Figure 9. Density index of non-commercial (20 to 69 mm) (Left panel) and commercial (>70 mm) (Right
panel) scallops based on research surveys in the Mingan area, Area 16F (± standard error). The dotted
lines represent the averages for the 2004-2014 series.
11Stock assessment of Scallop in Quebec
Quebec Region coastal waters in 2019
In Area 16G, between Johan Beetz Bay and Natashquan, landings, fishing effort and catches
per unit effort varied until 2005 (Figure 6), and there have been no landings since then.
Despite a possibility of 258 days at sea annually, Area 18A was exploited only in 2016 and 5.6 t
of meat were landed (Figure 6) in 27 fishing days. Both landings and fishing effort had
decreased significantly in 2002. This decrease in landings and CPUE continued until 2009. For
2016, CPUE is above the average of the historical series (Table 2).
Lower North Shore (Areas 16H, 16I and 15)
In 2019, eight scallop fishing licences were issued for Area 16H, and 33 regular and one
exploratory licence were issued for Iceland Scallop harvesting in areas 15 and 16I. Prior to
1992, most of the Lower North Shore landings were Sea Scallop, but from 1992 to 1998,
Iceland Scallop landings from areas 16H and 16I increased. Since 1998, Lower North Shore
landings of both scallop species have dropped, totalling only 0.46 t of meat in 2019 (Figure 10).
Area 15 landings have been low since 2007 and there hasn’t been any fishing effort in 2018.
There hasn’t been any fishing in areas 16H and 16I since 2004 and 2005, respectively.
Figure 10. Scallop landings (t of meat) from Lower North Shore areas 15, 16H and 16I.
Gaspé Peninsula (Areas 17A1, 17A2, 18B1, 18B2, 18C and 19A)
The Gaspé Peninsula is divided into three fishing sectors: the St. Lawrence Estuary and the
north shore of the Gaspé Peninsula (17A1, 17A2 and 18B1), southern Anticosti Island (18B2
and 18C) and Chaleur Bay (19A). The number of licences is limited in each area. In 2019, only
one licence was issued for areas 17A1 and 17A2, three in areas 18B1, 18B2 and 18C and one
in Area 19A. Each area had its own fishing season, and quotas were set in areas 17A1, 17A2,
18B2 and 18C.
Landings in the Gaspé Peninsula gradually started to increase in 1993, peaking at about 80 t of
meat in 1999. Landings in the Gaspé Peninsula area dropped significantly in 2003 and have
remained low since then (Figure 11). In 2019, landings in the Gaspé Peninsula totalled 1.0 t of
meat and the lowest value of the historical series was reached in 2017 when 0.6 t of meat were
landed. Both average annual landings and fishing effort from 2016 to 2019 declined by 63 %
from 2013–2015. There was little or no fishing effort in areas 17A1, 17A2, 18B1, 18B2 and 18C
during the 2016-2019 period.
12Stock assessment of Scallop in Quebec
Quebec Region coastal waters in 2019
In the wake of reduced fishing effort in Area 19A in 2003, landings fell significantly and
subsequently stabilized somewhat at a 5 t per year average and continued to decrease
thereafter (Figure 11). In 2019, landing and fishing effort values were still low at 1.0 t and 27
fishing days. In the last six years, scallops were primarily harvested from two beds, leaving
several beds unexploited. Catch per unit effort had been decreasing from 2008 to 2017,
reaching its lowest value, but has been increasing since then. The CPUE in 2019 was above the
historical series average (Table 2). The average weight of Sea Scallop meat landed from 2016
to 2019 was slightly lower than the series average (Table 3).
Figure 11. Gaspé Peninsula scallop landings (t of meat).
Magdalen Islands (Area 20)
There are several scallop beds in the Magdalen Islands. They are located at Pointe-du-Ouest,
Dix-Milles, Chaîne-de-la-Passe, Sud-Ouest, Île Brion and Banc de l’Est (Figure 12). Sub-area
20E is closed because it is a Sea Scallop refuge area.
Since 2007, fishing effort in Area 20A has been regulated by a total authorized number of days
at sea, and areas 20B, 20C and 20F are regulated by a fishing season. Authorized effort in
Area 20A was 322 days from 2013 to 2019. This maximum has been nearly reached every year.
Annual fishing effort has been stable since 2005 and is slightly above the 1992-2015 series
average. Landings increased significantly from 18 to 46 t of meat in 2007 and have been stable
since then (Figure 13). The fishing effort of the past four years has been well distributed over
the three main beds in Area 20A (Pointe-du-Ouest, Dix-Milles and Chaîne-de-la-Passe),
whereas annual fishing effort was low in areas 20B, 20C and 20F.
13Stock assessment of Scallop in Quebec
Quebec Region coastal waters in 2019
Figure 12. Sub-areas and main scallop fishing grounds in the Magdalen Islands.
Figure 13. Scallop landings (t of meat) in the Magdalen Islands.
14Stock assessment of Scallop in Quebec
Quebec Region coastal waters in 2019
Catches per unit effort estimated from logbooks has been relatively stable since 2007 and
remain significantly higher than CPUEs in the early 2000s and slightly below the upper stock
reference point (Figure 14).
Figure 14. Catches per unit of (CPUEs) estimated from logbooks in Area 20A.
The 2019 research survey indicated that the density of commercial-size (100 mm and over)
scallop remains high and close to historical maximum values (Figure 15). The density of 70-
84 mm and < 70 mm pre-recruit scallop are slightly higher than the median of the historical
series. However, the density of 85-99 mm pre-recruit is lower than the median of the historical
series.
Decision rules have been used to calculate annual fishing effort in Area 20A since 2010. A
primary indicator is calculated using CPUEs from the last two fishing seasons. If the CPUE of
the last year’s CPUE is higher than the previous year’s CPUE, the average of the two values is
used. Otherwise, only the CPUE of the final year is used. The decision rule detailed in Figure 16
is used to determine the fishing effort for the following year as suggested by the primary
indicator. Second, the most recent research survey abundance results are used to adjust the
fishing effort upwards or downwards within the grey area in Figure 16. For the 2020 season, the
maximum fishing effort is calculated at 305.5 days at sea in Area 20A. These decision rules and
calculation methods are described in more detail in Trottier et al. (2017).
15Stock assessment of Scallop in Quebec
Quebec Region coastal waters in 2019
Figure 15. Density of Sea Scallops sampled in the Magdalen Islands during research surveys according
to four size categories. The dotted lines indicate the 15th, 50th (median) and 85th percentiles of the 1987-
2008 series.
Figure 16. Calculation of fishing effort (days at sea) based on primary (CPUE) and secondary indicators
(research survey indices) for Area 20A.
16Stock assessment of Scallop in Quebec
Quebec Region coastal waters in 2019
Sources of Uncertainty
The sustainable exploitation rates of the various beds remain unknown. Without knowledge of
the sustainable exploitation rate, it is difficult to suggest quotas or specific exploitation
strategies.
In several management areas, fishing effort is zero or very low, which compromises the
reliability of the indicators.
CONCLUSIONS AND ADVICE
North Shore
Areas 16A1, 16A2, 16B, 16C, 16D, 16G and 18D
From 1998 to 2002, the Île Rouge bed was unable to sustain an annual exploitation level of
about 10 t, except in 1999, when the weight of meat landed totalled nearly 50 t. Because the
bed is located at the western edge of the known distribution of scallops and is geographically
isolated, it is likely to be more vulnerable to overharvesting than the other beds and to receive
smaller and less frequent inputs of larvae than the beds in other areas.
Between 2016 and 2019, there was no fishing effort in Areas 16A2, 16D, 16G and 18D, and
very little effort in Areas 16B and 16C. Since little information is available to assess the status of
the resource in these areas, there are no recommendations for these areas.
Areas 16E, 16F and 18A
The fishing effort management system, developed in 2006 for Areas 16E, 16F and 18A, is
aimed at regulating the number of fishing days to maintain a constant exploitation rate in
situations where the maximum fishing effort is reached. Constant effort can mean a constant
exploitation rate, with annual landings fluctuating depending on the stock status. Since this
system was introduced, the maximum level of effort has never been reached in any of the three
areas.
Since 2008 in Area 16E, the fishery has been concentrated primarily on bed D, south of Grande
Île, where recruitment was very good in previous years. Maintaining the fishing effort at the
average level of the last four years and keeping the limit on bed D at 50% of the effort across
the entire area could help maintain current densities. Additional conservation measures will be
required to help increase densities. In addition, minimizing fishing within the islands would
favour the survival of the two strong cohorts of small scallops observed in 2019.
In Area 16F, the last two research surveys indicated that the density of commercial- and non-
commercial-size scallops was below the series average in 2018 and close to the series average
in 2019. Maintaining the fishing effort at the average level of the last four years could help
maintain current densities.
In the current assessment period, Area 18A was harvested only in 2016. Since little information
is available to assess the status of the resource in this area, there is no recommendation.
Areas 16H, 16I and 15
For a number of years, landings on the Lower North Shore have remained low (Area 15) or nil
(Area 16H and 16I). Since information on these areas is incomplete and insufficient, there are
no recommendations.
17Stock assessment of Scallop in Quebec
Quebec Region coastal waters in 2019
Gaspé Peninsula
From 2016 to 2019, there was no fishing effort in Areas 17A1, 17A2, 18B2 and 18C, and very
little effort in Area 18B1. Since little information is available to assess the status of the resource
in these areas, there are no recommendations for these areas.
In Area 19A, landings and fishing effort in 2017 represented the lowest values of the historical
series. Since then, they have increased slightly but remain low. The CPUE also dropped to a
record low value in 2017 but has been rising since then. The CPUE value in 2019 was above
the average of the historical series. In the last two years, scallops were primarily harvested from
two beds, leaving many beds unharvested. There is a high probability that the current fishing
effort on these two beds will be sustainable until the next assessment.
Magdalen Islands
In the short- and medium-term, recruitment levels are expected to be similar to what was
observed during the previous assessment period (2013–2015). It is therefore likely that CPUEs
will be similar to the values seen in recent years. However, the status of this population is still
precarious given its strong dependence on recruitment. Maintaining and developing measures
that facilitate the escape of pre-commercial-size scallop will be beneficial for the sustainability of
this resource.
Decision rules to calculate fishing effort have been in place since 2010. For 2020, the maximum
authorized fishing effort recommended for Area 20A is 305.5 days at sea.
OTHER CONSIDERATIONS
Conservation measures
The recommended scallop conservation measures are designed to ensure that each bed retains
the ability to regenerate itself in order to ensure its sustainability. Any approach designed to
boost reproductive potential, whether it involves leaving more adults on the seabed or creating
refuge areas, will help conserve the resource. Also, because scallop egg production increases
exponentially with shell height, allowing the population to age will result in a net gain in
productivity. This strategy will increase the yield per recruit.
Scallops spawn between mid-July and the end of August, depending of the area, and juveniles
settle on the seabed approximately five weeks later. Dredging the beds with fishing gear at this
time of year reduces reproductive potential and stirs up the sediment, which can interfere with
successful settlement of juveniles. Halting harvesting operations during the spawning and
settlement periods (August to November) would limit the adverse effects of dredging on the
substrate and favour the survival of juvenile scallops. A strategy for protecting the seabed where
juveniles are very abundant should therefore be promoted. Subsequently, these areas could be
closed to fishing until the cohorts have reached commercial size in order to maximize the yield
per recruit and minimize incidental scallop mortality.
18Stock assessment of Scallop in Quebec
Quebec Region coastal waters in 2019
LIST OF MEETING PARTICIPANTS
Name Affiliation
Arseneault, Line (tel) Fisher – North Shore
Belley, Rénald DFO – Science
Boudreau, Mathieu DFO – Science
Bourdages, Hugo DFO – Science
Brassard, Claude DFO – Science
Brulotte, Sylvie DFO – Science
Bruneau, Benoît DFO – Science
Couillard, Catherine DFO – Science
Cyr, Charley DFO – Science
Desgagnés, Mathieu DFO – Science
Desjardins, Christine DFO – Science
Dubé, Sonia DFO – Science
Duplisea, Daniel DFO – Science
Gauthier, Johanne DFO – Science
Gauthier, Pierre DFO – Science
Goudreau, Patrice DFO – Science
Hébert, Denise (tél) DFO – Fisheries Management
Huard, Pierre-André Fisher – North Shore
Lacasse, Olivia DFO – Science
Maltais, Domynick DFO – Science
Nozères, Claude DFO – Science
Ouellette-Plante, Jordan DFO – Science
Poitevin, Pierre DFO – Science
Roy, Marie-Josée (tel) DFO – Fisheries Management
Roy, Virginie DFO – Science
Sainte-Marie, Bernard DFO – Science
Sean, Anne-Sara DFO – Science
Sellier, Marion DFO – Science
Tamdrari, Hacène DFO – Science
Vigneault, Guy Les pêcheries Shipek
SOURCES OF INFORMATION
This Science Advisory Report is from the February 26, 2020 meeting on the Stock Assessment
of Scallop in Quebec Inshore Waters. Additional publications from this meeting will be posted on
the Fisheries and Oceans Canada Science Advisory Schedule as they become available.
DFO. 2016. 2015 Stock Assessment of Scallop in Quebec Inshore Waters. DFO Can. Sci.
Advis. Sec. Sci. Advis. Rep. 2016/027.
Trottier, S., Bourdages, H., Goudreau, P. and Brulotte, S. 2017. Évaluation des stocks de
pétoncle des eaux côtières du Québec en 2015 : données de la pêche commerciale, des
relevés de recherche et des pêches exploratoires. Secr. can. de consult. sci. du MPO. Doc.
de rech. 2017/037. xvi + 175 p.
19Stock assessment of Scallop in Quebec
Quebec Region coastal waters in 2019
THIS REPORT IS AVAILABLE FROM THE:
Centre for Science Advice (CSA)
Quebec Region
Fisheries and Oceans Canada
Maurice Lamontagne Institute
P.O. Box 1000, Mont-Joli
Quebec, Canada
G5H 3Z4
Telephone: 418-775-0825
Email: Bras@dfo-mpo.gc.ca
Internet address: www.dfo-mpo.gc.ca/csas-sccs/
ISSN 1919-5087
© Her Majesty the Queen in Right of Canada, 2021
Correct Citation for this Publication:
DFO. 2021. Scallop stock assessment in Quebec coastal waters in 2019. DFO Can. Sci. Advis.
Sec. Sci. Advis. Rep. 2020/054.
Aussi disponible en français :
MPO. 2021. Évaluation des stocks de pétoncles des eaux côtières du Québec en 2019. Secr.
can. de consult. sci. du MPO, Avis sci. 2020/054.
20You can also read