Flood and Ice Jam Risks in Downtown Bolton - What nature does, what we can do, and what's next - Amazon S3
←
→
Page content transcription
If your browser does not render page correctly, please read the page content below
Slide 1

          Flood and Ice Jam Risks in Downtown Bolton
          What nature does, what we can do, and what’s next

          Presented by: Rehana Rajabali & Craig Mitchell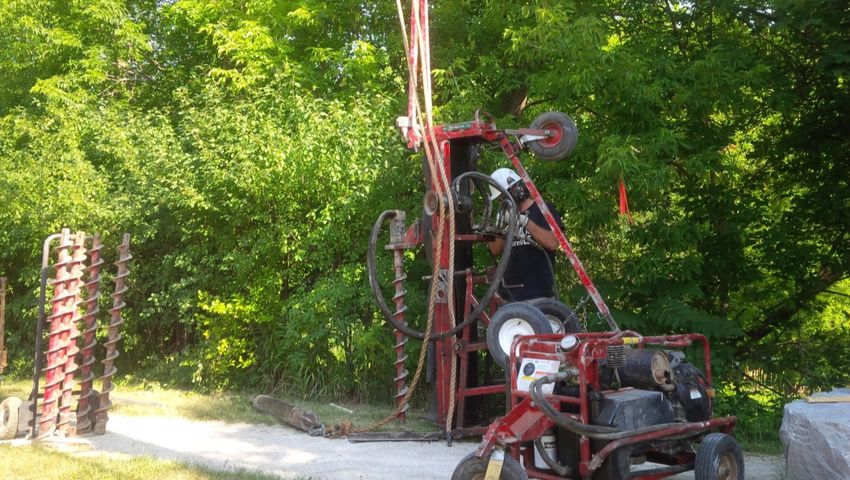
Slide 2

                   Presentation Outline
                   • Historical flood risks in Bolton
                   • Passive flood infrastructure in Bolton
                   • TRCA River Ice Monitoring and Flood Warning
                     Communications
                   • Ice Jams Explained
                   • Bolton Ice Jam of March 15
                   • TRCA Support to Municipal Response
                   • Next Steps and Resources

                                                 The information contained in this presentation is copyright © Toronto and Region Conservation Authority

                                                                                                     Toronto and Region Conservation Authority        2

We are here to share some information and resources with you regarding flood and ice-jam related risks in Bolton.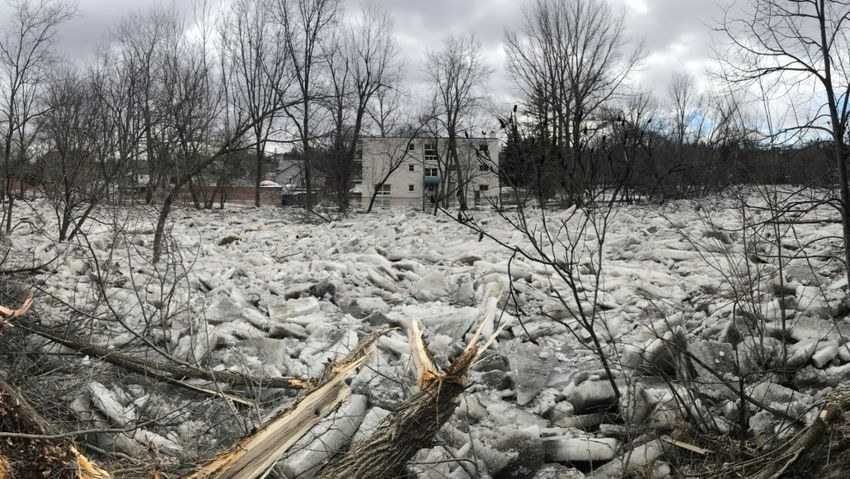
Slide 3

                                                                                                            3

                                                                                       Historical
                                                                                     Flood Risk in
                                                                                        Bolton

                                                                                        Toronto and Region Conservation Authority

Rivers are powerful, and it was with the intent to harness that power that the community of Bolton was first established, like many
communities across the country, around a river mill. Here you can see the old oxbow, and the reservoir behind McFall Dam – this
photo was taken in the 1940s. Hurricane Hazel didn’t happen until 1954, and that was a great tragedy, at which point we really
learned.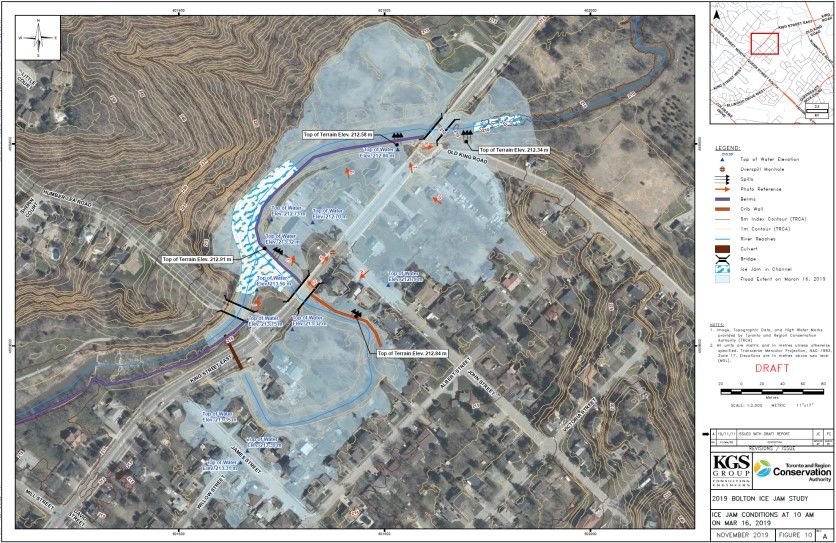
Slide 4

                                                                                 Flood Line 1979
                                                                                 Flood Line (2004)
                                                                                 Flood Line 2013
                                                                                 SPA Boundary (today)

                                                                               Toronto and Region Conservation Authority   4

Following the lessons learned from Hurricane Hazel, we have been mapping the floodplain. Despite the fact that there have been
several studies to update the floodplain mapping, for the most part, the floodplain has remained pretty consistent – and that is
because the dominant factor here is geography. The village of Bolton was built in the valley of the Humber River. As a community
that was settled well prior to the advent of land use management practices to reduce flood risk, the majority of downtown Bolton is
within the floodplain. The community is susceptible to flooding during heavy rainfall events, the spring freshet, and as most recently
experienced, from ice jams.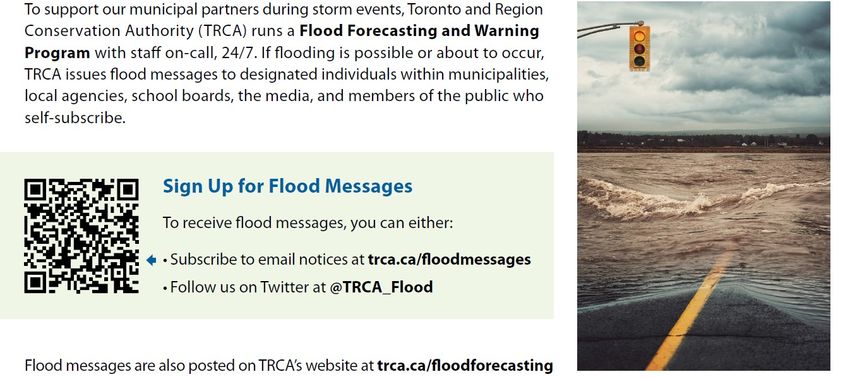
Slide 5

                    Flood Infrastructure in Bolton

                          Berm
                          Weir
                          Bridge
                          Low Flow Culvert
                          Crib Wall
                          Diversion Channel
                                                                               Toronto and Region Conservation Authority   5

Flooding has long been a concern in this area. In the early 1980’s, TRCA constructed a network of berms and a flood control channel
in downtown Bolton from Highway 50 to King Road. Berms were built along the south bank of the river to prevent flood water from
entering the Bolton core. A flood control channel was constructed downstream of Humber Lea Road to bypass the oxbow section of
river. A culvert was placed under King Road which releases a maximum flow of 10 m3/second into the oxbow section of the river.
When high flows are present, most of water flows through the flood control channel. This configuration maximizes the capacity of
the river and reduces the risk of flooding for the homes around the oxbow.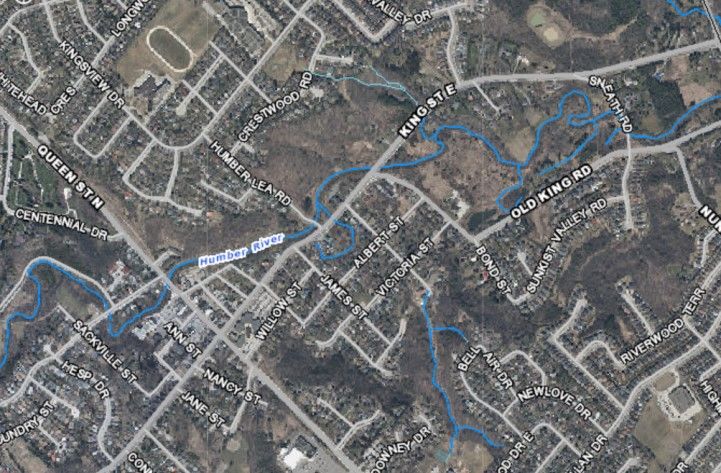
Slide 6

                                   TRCA is undertaking upgrades to the berm to meet current engineering
                                           standards. Construction expected to start 2020/2021.

                                                              Toronto and Region Conservation Authority   6

In 2016 TRCA began an investigation into the Bolton Berm to determine if the berm still provides 500-year flood protection. The
study determined that the berm doesn’t provide protection to the 500-year flood. The berm was designed in the early 1980’s and
since then there have been many improvements to hydrology data, hydraulic modeling and mapping technology. The 2016 study
used state of the art modeling tools and digital mapping to determine flood risk. The study recommended raising the berm in some
locations. Additionally, erosion repairs and drainage improvement were recommended. TRCA has completed some minor upgrades
and has hired a consultant to develop construction drawings for raising the berm.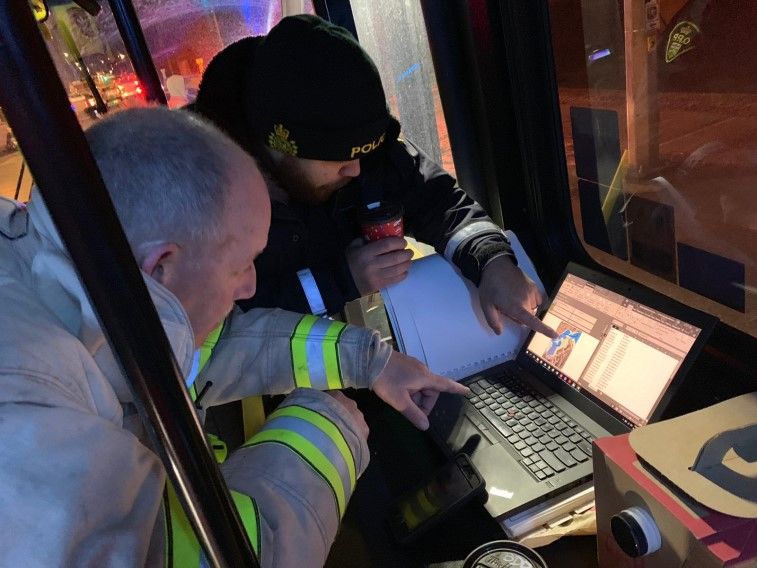
Slide 7

                                    Ice Jams
                                      or Ice
                                      Dams

                                                                             Toronto and Region Conservation Authority   7

The thing to remember is that the berm was never conceived to protect against ice-jam based flooding. For those not familiar with
the term, ice Jams are also called ice dams because they basically occur when the ice cover on a river breaks up and the ice pieces
start to pile up to a point that they actually block the flow of water.
    • Sometimes they are slow, but sometimes they can develop very rapidly.
    • Ice Jams are very unpredictable. Warmer weather and rainfall increase the chance of ice break-up, but an actual jam may or
        may not occur, it all depends on how the ice sheet crumbles and flows. They are dynamic. Allow to me emphasize again that
        there is little we can do to predict them, or to mitigate their effects once they form.
    • The sudden release of an ice jam can also result in downstream flooding as the impounded water is let loose. It is also
        possible for a released ice jam to re-accumulate in a different location further downstream.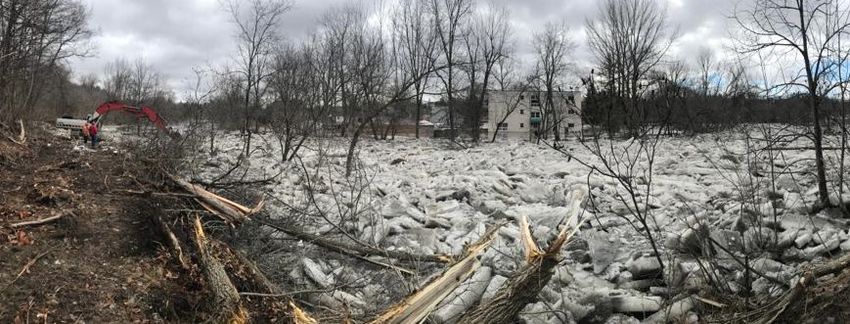
Slide 8

                   TRCA River Ice Monitoring Program

                                                                                Toronto and Region Conservation Authority   8

TRCA does undertake flood forecasting and warning communications, and we issue flood messages like the one on the left,
throughout the year. These messages pertain to our entire jurisdiction, so not every message would apply to Bolton, but the text of
the message typically contains details. Anyone can sign up to receive these flood messages – there is a panel with a QR code and a
link. In addition to this, during the winter months we also monitor for ice jams and provide River Ice Outlook forecasts to our
municipal partners. These river ice outlooks are based on field visits to some of our known critical location.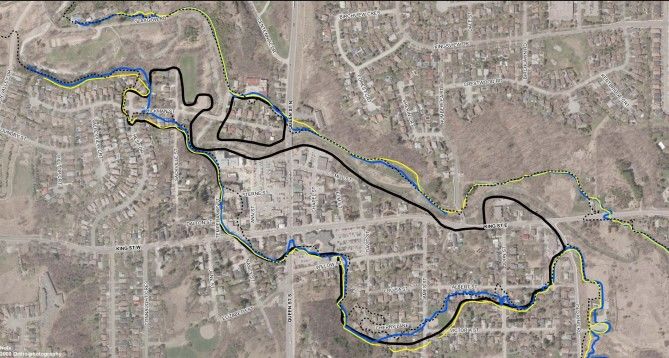
Slide 9
9
The Usual
Suspects
Toronto and Region Conservation Authority
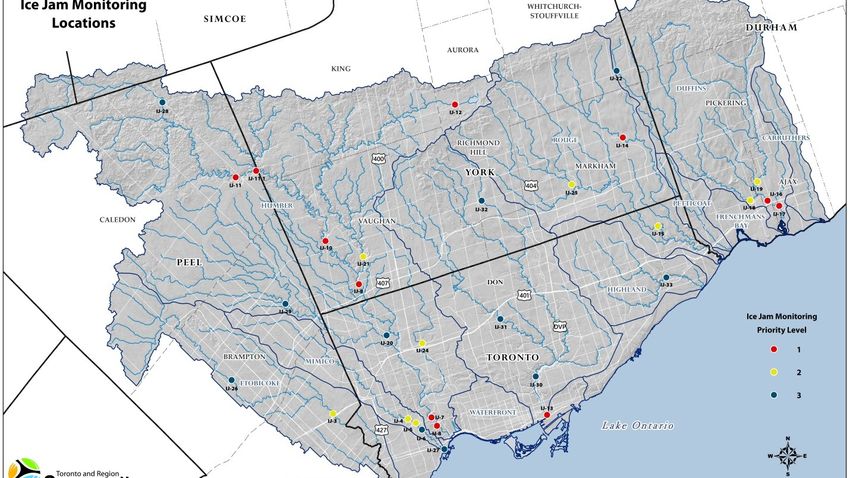
• With over 3500 km of watercourse in our jurisdiction, theoretically a jam could form anywhere if the conditions get unlucky
enough. The many bends and turns in the Humber River are certainly candidates, and there are some usual suspects.
• Certain bridges, like Old Mill in the Humber, and certain severe bends, are places where we have historically seen ice jams
form. There are 34 such historical locations within our jurisdiction, out of which 12 are high priority because jams have
recurred in those areas. Our monitoring program is based on field observation of these high priority sites.
• 2 of the high priority locations are in Bolton, and a third one was identified to us in early February. All of these sites were
monitored throughout the season but neither of them are where the jam that caused flooding on March 15 occurred.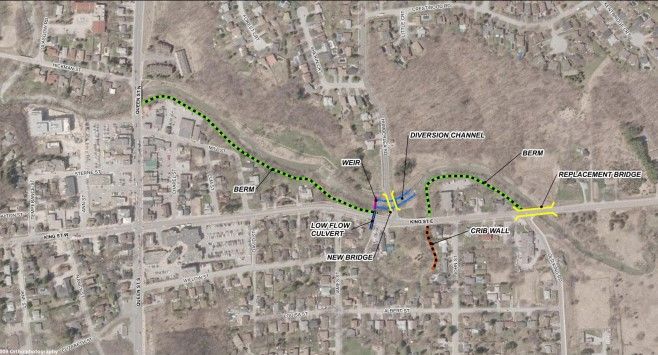
Slide 10

                      Historical Ice Jam Locations

                                                                                 Historical Ice Jam
                                                                                 Locations

                                                                                 Initial Ice Jam Observed on
                                                                                 Feb 5, added to monitoring
                                                                                 list - subsequently cleared

                                                                                 Ice Jam that caused
                                                                                 March 15 flooding

                                                                                 Toronto and Region Conservation Authority   10

The areas circled in yellow are places where historically ice jams have occurred in and around Bolton, based on previous records. The
areas along Hickman Street and Sneath Drive were part of the 12 high-priority monitoring locations and were observed throughout
the season.
Based on a resident e-mail on February 5th, 2019, TRCA became aware of a different ice jam location, directly upstream of King
Street East and Old King Road. – this is shown in brown. This location was included in all further ice monitoring visits, but as I will
show on the next slide, that jam instance later cleared

In red is the location of the ice jam that caused the flooding on March 15, as identified through drone footage taken on March 16.
Slide 11
Ice Jams in Bolton
Feb 7 – From drone
Feb 5 – From resident Feb 21 – River Watch March 15 (~10AM) – River Watch
Toronto and Region Conservation Authority 11
Let’s take a ground level look at that first ice jam. As of February 5th, 2019, TRCA became aware of ice jamming directly upstream of
King Street East and Old King Road, which is in a different location than our ‘usual suspects’. This location was included in all further
ice monitoring visits, including aerial surveillance using drones on February 7. That drone imagery shows the jam as building up
behind the bridge at King Street and dissipating as you move upstream. Photographs from the various monitoring visits illustrate
that this first jam reported on February 5 directly upstream of King Road had already begun to improve by February 21, and the field
visit to the location on the morning of March 15 revealed openly flowing water directly upstream of King Street East and Old King
Road. To re-iterate, all three photos in the bottom were taken from the same perspective.Slide 12
Second
melt
brought
upstream
ice
Toronto and Region Conservation Authority 12
A look at temperature and flow charts for the winter of 2019 helps illustrate what happened. These graphs are from the (post-event)
KGS study, and the top one shows temperature, and precipitation while the bottom one shows flow rates. A look at the temperature
graph shows a first period of ice formation during cold temperatures in January, then a warm/melt period in early February which is
what brought ice down on February 5. A second cold spell in late-February to early March led to a second period of ice formation,
and then the combined rainfall and higher temperatures of March 14-15 brought higher flows through the upper watershed, bringing
ice with it.Slide 13
Where does the ice come from?
March 15 higher flows
carry upstream ice
Toronto and Region Conservation Authority 13
This map shows the many branches, bends and turns in the river system upstream of Bolton Core. The higher flows on March 15,
resulting from warmer weather and rainfall in previous days, brought ice from upstream areas into Bolton Core, and the next slide
shows the river topography of where that ice jammed.Slide 14
Why did the ice accumulate?
River Flow Direction
Toronto and Region Conservation Authority 14
Upstream is on the right and downstream is on the left. (Queen St, Humber Lea, then King) Ice jammed on an area where the slope
transitioned from a steeper slope to a shallower slope, in the area behind 181 King Street.Slide 15
Characteristics of the March 2019 Bolton Ice Jam Flood
• There were two different ice-jam
events in the winter of 2019.
The flooding occurred from ice
that jammed on March 15.
• The occurrence of ice jams is
difficult to predict given the
various factors (weather, river
morphology, flow conditions)
that contribute to ice jam
formation.
• The state-of-the-art of river ice
science does not provide
means to predict when or where
an ice jam would form.
Toronto and Region Conservation Authority 15
There were two different ice-jam events in the winter of 2019. The February 5 ice accumulation upstream of King Street cleared.
A second period of ice formation in upstream reaches occurred from the third week of February onwards. Rain and warm
temperatures in March caused this ice sheet upstream of Bolton to break up. Higher flows, estimated around the 2-year event,
facilitated the movement of ice downstream. Ice jams began to form behind 181 King Street and downstream of the King Road
bridge due to the shallower channel slope in this area. Water began to back up the river toward the oxbow and overtopped in several
locations including the berm at 181 King Street East.
The occurrence of ice jams is difficult to predict given the various factors (weather, river morphology, flow conditions) that contribute
to ice jam formation. The state-of-the-art of river ice science does not provide means to predict when or where an ice jam would
form.Slide 16
Leveraging
mapping
Toronto and Region Conservation Authority 16
Even if we can’t predict or control the formation of ice jams, we can use tools like our mapping to help respond effectively. The
mapping that was done as part of the 2016 berm project was very helpful in assisting first responders. This picture explains a lot
about the relationship between TRCA and the Town during an emergency.
• TRCA provided on-site technical advice and expertise to the Town of Caledon emergency contractor and Caledon Fire and
Emergency Services on approaches to address the ice jam and flooding, taking into account the dynamic conditions and the
presence of the berm.
• TRCA Flood Infrastructure staff played a key role in ensuring an effective ice removal strategy.
• Situation reports shared with the Community Emergency Management Coordinator, and the TRCA Senior Leadership Team,
about the work being done at the site and remotely, as well as updates on upstream watershed conditions.
• Key messages regarding the dynamic and unpredictable nature of ice-jam flooding utilized in communications with the media
and public.
These maps were utilized by first responders from OPP and Caledon Fire and Emergency Services and were identified as a very
valuable tool. This information was provided by leveraging the data and process developed for the Flood Risk Assessment and
Ranking Project.Slide 17
Ice Jam removal – March 15, 2019
Toronto and Region Conservation Authority 17
Once an ice jam forms, mechanical excavation is really the only way to get rid of the ice. Moving the ice around in the river does not
prevent the jam from re-forming somewhere else.Slide 18
Ice-Jam Mitigation – only intervene when the intervention
will successfully resolve a risk, without creating another
risk elsewhere
Can’ t do X Can do!
1. Pre-emptively breaking ice cover – includes 1. Ice Jam Removal – Using heavy equipment to
blasting and cutting ice before break up. Not mechanically remove ice from the river as was
feasible because ice needs to go somewhere. done in March 2019. Can continue to ensure that
heavy equipment contracts for 24/7 operations
2. Construction of ice control structures – Ice remain in place.
control structures are similar to dams. Not
feasible given size and type of river – ice forms 2. Can formalize access paths for equipment.
in many different places.
3. Monitoring and forecasting improvements.
3. River modifications – modifications to the river to Enhanced flood warning components could
facilitate the movement of ice. Ice jams can still include drone surveys, remote cameras and
form behind crossings, etc. additional gauges.
4. Enlarge the berm. Toronto and Region Conservation Authority 18Slide 19
• TRCA, Town of Caledon, and
Region of Peel post-event debrief
(completed Spring 2019)
• TRCA, Town of Caledon, and
Region of Peel emergency
What’s planning projects and workshops
(ongoing)
been • KGS Consultants Inc. study of ice-
jam causes and mitigation (nearly
complete)
done • Enhancements to river ice
monitoring using drones
(underway)
• Touching base with residents to
provide information (resources
available for you)
Toronto and Region Conservation Authority 19
Though we are here today in advance of the next ice season, it is important to remember that flood risk is year-round. Ice jamming is
not the only flood mechanism in the area. Since March of this year there are a few things that we have been working on.
• TRCA, the Town, and Region of Peel all met in the spring for our post-event debrief, and we have continued to collaborate on
flood emergency management projects.
• The study by KGS Consultants is nearly complete, and the key messages are in the panels today.
• Craig and his staff have undergone training to be able to fly drones, and this is a technology that we will be using in coming
ice seasons to enhance monitoring, and we are here speaking to you today to share resources.Slide 20
Who to call during a flood?
If you are in danger of there is a threat to life and safety, call 911 immediately.
If you see any potential damage to your property, call your insurance representative as soon as possible.
For power outages or to report downed wires, call Hydro One at 1-800-434-1235.
• If water rises above your electrical outlets, baseboard heaters, or furnace, or is near the
electrical panel, call Hydro One to have your power disconnected.
To report localized flooding on municipal roads, blocked catch basins or municipal infrastructure, contact
the Town of Caledon: info@caledon.ca, Service Caledon: 905-584-2272 ext. 7750.
For after-hours emergencies such as downed trees on roads or flooding call the Region of Peel at
1-800-563-7881.
To report river flooding, leave a voicemail on the TRCA floodline at 416-661-6514. A flood duty officer will
return your call or email floodmessage@trca.ca.
Toronto and Region Conservation Authority 20
One of the key take-aways we noted at the debrief was that there may be confusion on the best number to call during a flood event.
911 is first on this list because that is the number that will trigger the coordinated emergency response. There are additional
numbers that can be used to report general conditions, like the TRCA floodline or the Town’s customer care line.
If you are seeing ice accumulation in an area then by all means send that information to the TRCA floodline, and just like last year we
can add that location to our monitoring areas – there are so many potential locations for ice jams to form and we can’t have eyes
everywhere, so it is helpful for you to be our eyes.Slide 21
What we can do What nature can
(Municipality, EMS, What you can do What’s next
TRCA) do
Monitor Call 911 Make a plan
We cannot predict
Coordinate Notify neighbours Know who to call nature but we can
prepare and plan.
Report & take Know your
React/Address There will be
pictures neighbours
storms, there will
Stay safe be ice jams.
Call insurance
Advise (evacuate as
provider
needed) We can work
Protect your together.
Educate Track alerts property (advance
planning)
Toronto and Region Conservation Authority 21
Each of us has a role to play, we can continue to monitor, co-ordinate, address, advise and share information.
• you can call 911 if there is a threat to life and safety
• you can share resources with your neighbours, you can report and take pictures,
• you can follow along with our flood messages
Because this is a floodplain and a known flood risk area, you can build on your experience and have a plan, because what none of us
can do is control nature. There will be storms, there will be ice jams, and rivers will continue to be the powerful force that it is.Slide 22
Site-Specific Response Plans & Maps
Toronto and Region Conservation Authority 22
On our end we will continue to formalize the data that we have and share it with the Town through projects like the site-specific
flood response plan for this area.Slide 23
Pathway to success
TRCA monitors area with new drones
Risk of flooding and/or ice jam is reported (call to 911)
City and EMS responds & TRCA is notified
Community is notified – alerts posted – door knocking
Equipment is mobilized and issue addressed
On-site monitoring and ongoing communications
Toronto and Region Conservation Authority 23
Together we can use new tools like drones to help monitor and all be prepared to act in case of flooding.Slide 24
Resources for you
A digital handbook with information specific to Bolton was created to help you
understand and prepare for flooding: trca.ca/flood-risk-bolton
Know your risks Be prepared Stay informed
If you’re not sure whether You can take steps to Check your local
your home is in a floodplain, prepare; we’ve created weather online, or on
use TRCA’s map viewer to custom preparedness tips radio or television
find out. You can also for homeowners, landlords before you leave the
download a copy of TRCA’s and renters/condo owners. house.
flood risk map of the area. We also have flood
specific resources from
industry professionals.
Toronto and Region Conservation Authority 24
To help you be prepared, there is a digital handbook that we have prepared for you, all on a website. Please bookmark this location.Slide 25
Continued Flood Monitoring
TRCA has a network of real-time river and rain gauges across the GTA to:
• Monitor the water levels in specific stream and behind dams
• Measure how much precipitation has fallen
beta.trcagauging.ca
Nearby Stream & rain gauges
Stream Gauge:
• HY006 - Bolton McFall Dam
Precipitation Gauge:
• HY002 - Albion Hills CA
Note that there is also a Water Survey of
Canada
gauge farther upstream at Palgrave.
Toronto and Region Conservation Authority 25
You can also look at watershed conditions using our real-time gauging website – you can see the water levels at the Bolton McFall
Dam and rainfall amounts for Albion Hills at www.trcagauging.ca.Slide 26
Flood Messages
For important Town updates, follow @YourCaledon
Toronto and Region Conservation Authority 26
The other thing you can do, because this community is in a floodplain is stay informed by signing up for flood messages and
following the Town and TRCA on Twitter.Slide 27
Flood Messages
High flows, unsafe banks, melting ice or other factors that could be
dangerous for recreational
• Flooding is not expected.
Early notice of the potential for flooding based on weather forecasts
Flooding is possible in specific watercourses or municipalities.
• Flood-prone areas should prepare.
Flooding is imminent or already occurring in specific watercourses or
municipalities.
A notice that critical high-water levels and waves.
Toronto and Region Conservation Authority 27
If you do sign up for flood messages, remember that there are different levels of messaging, with an increase in severity and
certainty.Slide 28
Thank you
www.trca.ca/flood
@TRCA_Flood
www.trca.caYou can also read


