TEMPORAL AND SPATIAL CHANGES OF DROUGHT IN BEIJING-TIANJIN-HEBEI REGION BASED ON REMOTE SENSING TECHNOLOGY
←
→
Page content transcription
If your browser does not render page correctly, please read the page content below
The International Archives of the Photogrammetry, Remote Sensing and Spatial Information Sciences, Volume XLII-3/W10, 2020
         International Conference on Geomatics in the Big Data Era (ICGBD), 15–17 November 2019, Guilin, Guangxi, China

   TEMPORAL AND SPATIAL CHANGES OF DROUGHT IN BEIJING-TIANJIN-HEBEI
            REGION BASED ON REMOTE SENSING TECHNOLOGY

                                             Lin Xingchen, Chen Jianjun*, Lou Peiqing

                  College of Geomatics and Geoinformation, Guilin University of Technology, Guilin 541004,
                  China-linxingchen2019@126.com (L.X.); chenjj@glut.edu.cn (C.J.); gislou@126.com (L.P.)

KEY WORDS: Beijing-Tianjin-Hebei region; remote sensing; drought monitoring; TVDI; temporal and spatial variation

ABSTRACT:

Drought is an extremely complex natural disaster phenomenon. Sustained drought will lead to the aggravation of water shortage,
food production reduction, land desertification and ecological crisis, which will have a great impact on social and economic
development, industrial and agricultural production and ecological environment. In recent years, human activities have intensified,
the global climate has been warming, and the frequency and intensity of extreme events such as drought have been continuously
strengthened, which has been widely concerned by scholars at home and abroad. The Beijing-Tianjin-Hebei region, as the political
and cultural center of China, is seriously affected by the drought, which has a certain impact on the social economy of the region.
Therefore, it is of great practical significance to carry out remote sensing drought monitoring and understand the temporal and spatial
characteristics of drought. Based on MOD13A2 and MOD11A2 in MODIS products, this paper constructed the NDVI-Ts feature
space to obtain the Temperature Vegetation Dryness Index (TVDI) in Beijing-Tianjin-Hebei region, and analyzed the spatial and
temporal variation characteristics of drought in Beijing-Tianjin-Hebei region from 2001 to 2014 with TVDI as the drought index. The
results showed that: (1) the NDVI-Ts feature space in the Beijing-Tianjin-Hebei region showed that when the value of NDVI rose
from 0 to 1, the maximum temperature of the surface gradually decreased, while the minimum temperature gradually rose. Both of
them had a linear relationship with NDVI, and their spatial shape was similar to a triangle, indicating that the study of drought in
Beijing-Tianjin-Hebei was effective by using this spatial feature; (2) the Beijing-Tianjin-Hebei region experienced drought every
year in the period of 2001-2014, and the drought was more serious in 2001, 2004, 2008, 2009, 2011 and 2012; (3) The drought in the
Beijing-Tianjin-Hebei region was widespread, and the severely arid regions were mainly concentrated in the southern and central
regions. In terms of drought intensity, the most frequent occurrences in the period of 2001-2014 were Xingtai, Hengshui,
Shijiazhuang, and Handan, and the annual drought in 14 years; the least number of occurrences was Chengde, a total of 4 times; the
number of occurrences was second only to Chengde, Tangshan, Zhangjiakou, Qinhuangdao, a total of 7 times. Our results indicated
that the Beijing-Tianjin-Hebei region was prone to drought and the drought degree was severe.

* Corresponding author

                                               This contribution has been peer-reviewed.
                  https://doi.org/10.5194/isprs-archives-XLII-3-W10-747-2020 | © Authors 2020. CC BY 4.0 License.                 747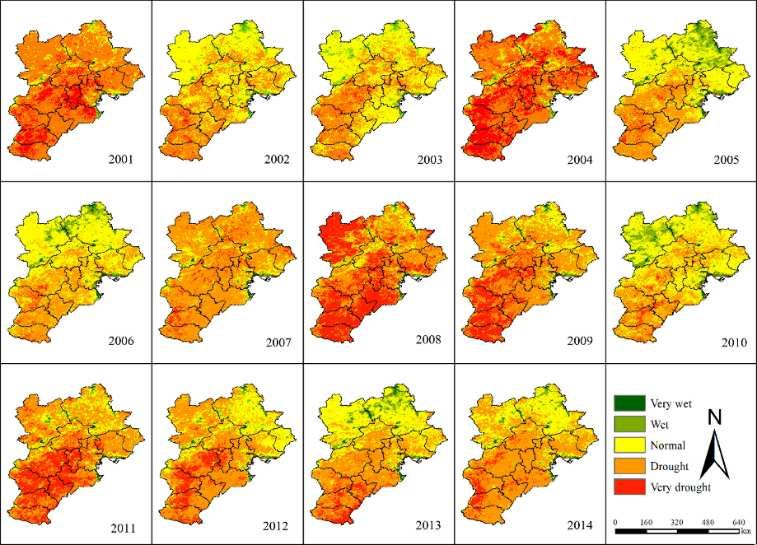
The International Archives of the Photogrammetry, Remote Sensing and Spatial Information Sciences, Volume XLII-3/W10, 2020
International Conference on Geomatics in the Big Data Era (ICGBD), 15–17 November 2019, Guilin, Guangxi, China
1 INTRODUCTION In this paper, the long-term sequence MODIS data (MOD13A2
and MOD11A2) from 2001 to 2014 were used to analyze the
As one of the most complicated climate disasters that have the spatial and temporal changes of drought in the
most serious impact on human society, drought has the Beijing-Tianjin-Hebei region. Based on the remote sensing
characteristics of high frequency, long duration and wide range monitoring model of temperature vegetation drought, the
of influence, which is an important problem that plagues the dry-wet edge equation was constructed to obtain the annual
development of today's society (Liu et al, 2019). As the main temperature vegetation drought index TVDI. Finally, the
producing area of wheat in China, the drought in the Beijing-Tianjin-Hebei region was monitored by
Beijing-Tianjin-Hebei region is a temperate monsoon climate the TVDI model, and the spatial and temporal distribution of
with uneven annual precipitation distribution, increased demand drought in the Beijing-Tianjin-Hebei region from 2001 to 2014
for water resources and increased pollution, resulting in was analyzed.
frequent drought disasters in the Beijing-Tianjin-Hebei region,
seriously affecting residents' living, social and economic
development. Environmental improvements have also caused 2 DATA SOURCE AND PROCESSING
economic losses to some extent (Nait-Ali et al, 2017; Centritto METHODS
et al, 2011). Therefore, the analysis of the spatial and temporal
changes of drought in the Beijing-Tianjin-Hebei region is of 2.1 Overview of the study area
great significance for alleviating the loss of drought disasters,
rationally planning limited water resources and ensuring its The Beijing-Tianjin-Hebei region is China's “Capital Economic
economic and social development. Circle”, located in the northern part of the North China Plain,
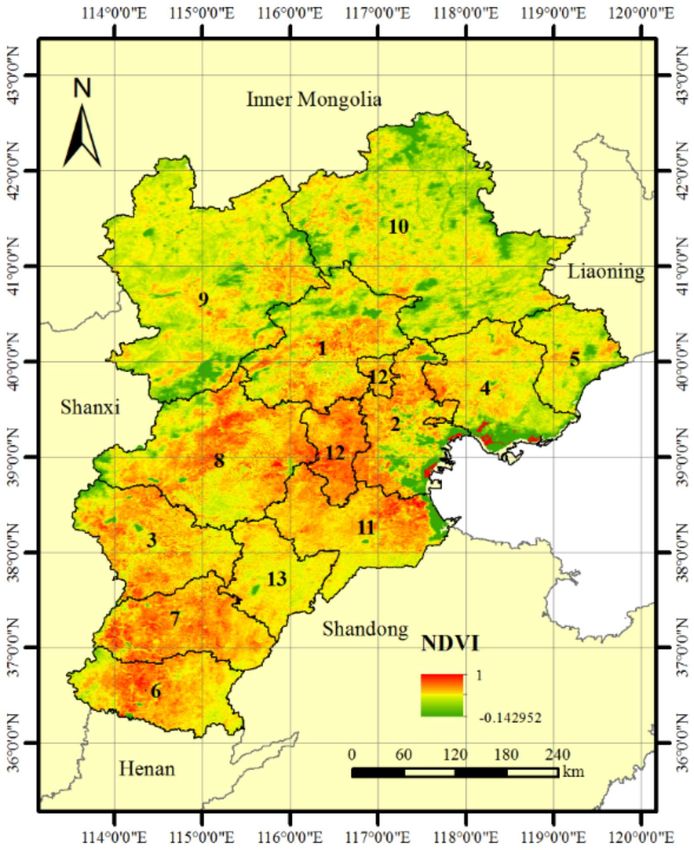
between 36°05'~42°37'N, 113°27'~119°50'E (Fig. 1).
Goward and Hope used NOAA-AVHRR data to find that the
Normalized Difference Vegetation Index (NDVI) and Surface
Temperature (Ts) vary with soil moisture (Goward, Hope, 1989);
Price and Carlson et al. The scatter plots showing NDVI as the
abscissa and Ts as the ordinate are generally triangular (Price,
1990; Carlson et al, 1994); Nemani, Moran, etc. further discover
that the feature space of Ts-NDVI is trapezoidal (Nemani et al,
1993; Moran et al, 1994); eventually Sandholt et al. The
Temperature Vegetation Dryness Index (TVDI) was proposed
and used as an important indicator for monitoring drought by
remote sensing (Sandholt et al, 2002). TVDI has been widely
used as soon as it is proposed. Qi et al. used TVDI to evaluate
the distribution of drought levels across the country and carried
out drought monitoring, and achieved good results (Qi, 2004);
Chen et al. compared the drought monitoring results of TVDI
with the research situation and found that TVDI can monitor the
drought well in time and accurately evaluate the drought
situation of the grassland. (CHEN et al, 2013); Bai uses the
normalized vegetation index NDVI and the enhanced vegetation Figure 1.Location of the Beijing-Tianjin-Hebei region and
index EVI and the surface temperature to construct the TVDI distribution in 2001 (1 Beijing 2 Tianjin 3 Shijiazhuang 4
temperature-vegetation feature space, and finds that the TVDI Tangshan 5 Qinhuangdao 6Handan 7 Xingtai 8 Baoding 9
calculated by the two vegetation indices is inversion of soil Zhangjiakou 10 Chengde 11 Zhangzhou 12 Langfang 13
moisture. Both have higher precision (Bai, 2014). Hengshui)
This contribution has been peer-reviewed.
https://doi.org/10.5194/isprs-archives-XLII-3-W10-747-2020 | © Authors 2020. CC BY 4.0 License. 748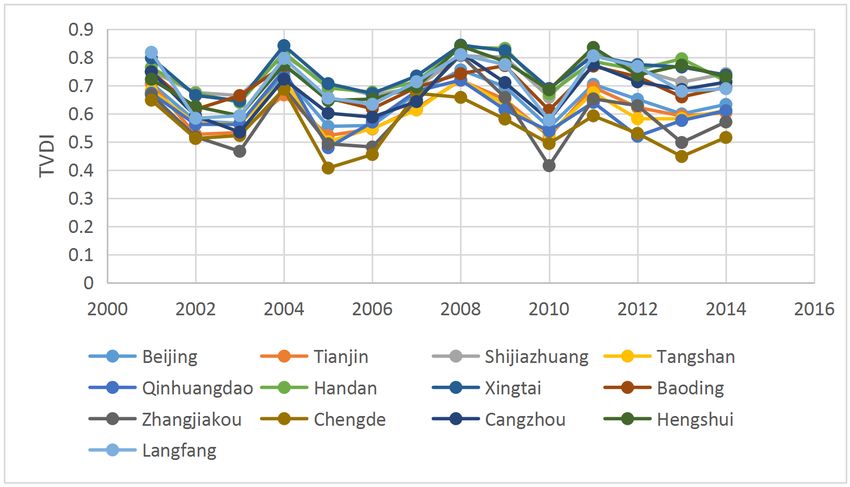
The International Archives of the Photogrammetry, Remote Sensing and Spatial Information Sciences, Volume XLII-3/W10, 2020
          International Conference on Geomatics in the Big Data Era (ICGBD), 15–17 November 2019, Guilin, Guangxi, China

It is bordered by the Yanshan Mountains in the north, the North        proposed by Sandholt. By constructing the NDVI-Ts feature
China Plain in the south, the Taihang Mountain in the west, and        space, the dry-wet edge equation is calculated, and finally TVDI
the Bohai Bay in the east. The terrain is higher in the northwest      (Fig. 2) is obtained. The NDVI-Ts feature space is approximated
and north, and the terrain is flatter in the south and east. From      as a triangle (Sandholt et al, 2002). The specific formula is:
the northwest, the Yanshan-Taihangshan mountain system
gradually transitions to the plain in the southeast, showing the                                              Ts-Tsmin
                                                                                                     TVDI=                               (1)
                                                                                                             Tsmax -Tsmin
topographical features of the northwest high and southeast low
(Zhang et al, 2017). From the perspective of geomorphology,
the area contains a variety of geomorphological features, but                           Tsmin =a1 +b1 ×NDVI,Tsmax =a2 +b2 ×NDVI          (2)
still dominated by plain landforms, along the coast of the shoal
and wetlands. The Haihe River Basin spreads in the form of             Where: Ts represents the surface temperature of any pixel;
fan-shaped water system in the Beijing-Tianjin-Hebei region.           represents the corresponding        wet     edge;    represents   the
The climate is typical of temperate semi-humid and semi-arid           corresponding dry edge; represents the coefficient of the fit
continental climate, and the spatial distribution of annual            equation of the dry and wet edges in the feature space,
precipitation is affected by factors such as atmospheric               respectively. TVDI=1 on the dry side and TVDI=0 (Sun et al,
circulation and geographical regions. The distribution is uneven,      2014) on the wet side.
mainly due to the large precipitation on the side of Yanshan and       When calculating TVDI, we can determine the dry and wet
Taihang Mountain. The precipitation in the plain area is               edges based on the NDVI value of the pixel, and then determine
generally higher than that in the dam area, and the precipitation      the TVDI value by the location of the pixel's surface
in the east is significantly larger than that in the west.             temperature in the feature space (Liu et al, 2013). The closer
                                                                       TVDI is to 0, the higher the soil moisture and the lower the
2.2 Data sources and pre-processing                                    degree of drought; the closer TVDI is to l, the lower the soil
                                                                       moisture and the higher the degree of drought (Zhang et al,
2.2.1 Data source:
                 :The 2001-2014 surface temperature data (Ts)          2019).
and normalized vegetation index (NDVI) data used in this paper
are from the NASA (National Aeronautics and Space
Administration) data sharing website (https://www.nasa.gov/).
The MODIS MOD13A2 and MODIS MOD11A2 image data
are widely used for large-area drought monitoring. The data
format is HDF and the spatial resolution is 1km.
2.2.2 Data preprocessing: (1) Due to the large amount of data
in this study, the data is processed in batch processing. First, the
MRT toolbox is used to perform format conversion, projection
coordinate conversion, and the like on the downloaded data
MOD13A2 and MOD11A2, and the coordinates used in the                                       Figure 2. TVDI definition
study are the WGS84 coordinate system. In ENVI 5.3, the                TVDI mainly depends on the fitting equation of dry and wet
administrative vector boundaries of the Beijing-Tianjin-Hebei          edges of feature space, and TVDI is between 0-1. The larger the
region are used to tailor the data required for the study area.(2)     TVDI value is, the more dry the soil is, the smaller the value is,
In the interannual variation analysis, this study averages the         the more moist the soil is. Yao et al. classify the arid regions
NDVI and LST data from April to October every year to                  based on TVDI (Table 1), which better reflects the local drought
prevent image outliers from affecting the processing results.          conditions (Wang et al, 2013). Based on this, this study will
                                                                       sample the partitioning criteria in subsequent analysis.
2.3 Research methods

The Temperature Vegetation Drought Index (TVDI) was first

                                                 This contribution has been peer-reviewed.
                    https://doi.org/10.5194/isprs-archives-XLII-3-W10-747-2020 | © Authors 2020. CC BY 4.0 License.                      749
The International Archives of the Photogrammetry, Remote Sensing and Spatial Information Sciences, Volume XLII-3/W10, 2020
International Conference on Geomatics in the Big Data Era (ICGBD), 15–17 November 2019, Guilin, Guangxi, China
RANGE CLASS TVDI space. The required NDVI data and its corresponding maximum
land surface temperature and minimum land surface
1 Very wet 0The International Archives of the Photogrammetry, Remote Sensing and Spatial Information Sciences, Volume XLII-3/W10, 2020
International Conference on Geomatics in the Big Data Era (ICGBD), 15–17 November 2019, Guilin, Guangxi, China
2014 has been showing a weakening trend. This result shows excluding some natural factors, and there are also some human
that the drought has occurred in the Beijing-Tianjin-Hebei factors. When the extremely dry areas expand, the latter. The
region for nearly fourteen years, and it has occurred repeatedly, drought in the year will be weakened.
Figure 3. Changes in TVDI values from 2001 to 2014 in Beijing, Tianjin and Hebei
3.2.2 Analysis of the characteristics of the arid space in in 2008 reached four-fifths of the Beijing-Tianjin-Hebei region,
Beijing-Tianjin: Global warming has been established in the while the arid regions accounted for almost 100% of the region.
past 100 years (Bachmair et al, 2016; Nail, 2018; Wilhite, 2000). The area where the drought is severely arid in the
Under this background, the aridification trend in the region is Beijing-Tianjin-Hebei region (ie, 0.8The International Archives of the Photogrammetry, Remote Sensing and Spatial Information Sciences, Volume XLII-3/W10, 2020
International Conference on Geomatics in the Big Data Era (ICGBD), 15–17 November 2019, Guilin, Guangxi, China
interaction between biology, soil, hydrology, climate and is the focus of our next research. In addition, the improvement
between human beings. It is also a humanistic process in which of climate in the Beijing-Tianjin-Hebei region and the reduction
humans interact with nature. There is a close relationship of drought conditions are closely related to the implementation
between human activities and vegetation cover and climate of a series of human activities such as returning farmland to
change. The paper does not specifically analyze the spatial forests and grasslands, and further analysis and verification are
distribution, time change and human activities of drought. This needed.
Figure 4. TVDI images from 2001 to 2014
4 CONCLUSION Beijing-Tianjin-Hebei region is prone to drought and severe
areas.
Based on the normalized vegetation index and surface
temperature data, this paper uses TVDI as a drought monitoring
ACKNOWLEDGEMENTS
model to analyze the drought monitoring and time-space
changes in the Beijing-Tianjin-Hebei region. The conclusions
This study was supported by the National Natural Science
are as follows: (1) The overall degree of drought in 2001-2014
Foundation of China (41801030, 41901370, 41961065);
is relatively high and fluctuating. Since 2011, the degree of
Guangxi Natural Science Foundation (2018GXNSFBA281054,
drought has slowed down and has been reduced year by year.
2018GXNSFBA281075, 2017GXNSFDA198016); Research
Speculation may be caused by human factors (afforestation,
Foundation of Guilin University of Technology
returning farmland to forests and grassland, and conserving
(GUTQDJJ2017069); the BaGuiScholars program of the
water sources), resulting in a gradual reduction in areas with
provincial government of Guangxi (Guoqing Zhou).
severe drought. (2) The drought in the Beijing-Tianjin-Hebei
region is widespread, and the severely arid regions are mainly
REFERENCES
concentrated in the southern and central regions. In the intensity
of drought, the most frequent occurrences in 14a were Xingtai,
Bachmair S, Svensson C, Hannaford J, Barker L J, Stahl K,
Hengshui, Shijiazhuang, and Heilongjiang, 14 years of drought;
2016. A quantitative analysis to objectively appraise drought
the least number of occurrences was Chengde, a total of 4 times;
indicators and model\drought impacts. Hydrology and Earth
the number of occurrences was second only to Chengde,
System Sciences. 20(7):2589-2609.
Tangshan, Zhangjiakou, Qinhuangdao, a total of 7 times, the
This contribution has been peer-reviewed.
https://doi.org/10.5194/isprs-archives-XLII-3-W10-747-2020 | © Authors 2020. CC BY 4.0 License. 752The International Archives of the Photogrammetry, Remote Sensing and Spatial Information Sciences, Volume XLII-3/W10, 2020
International Conference on Geomatics in the Big Data Era (ICGBD), 15–17 November 2019, Guilin, Guangxi, China
Bai Y Y, 2014. Research on surface soil moisture in salinized Applied Meteorology. 32(3):548-557.
farmland based on multi-temporal remote sensing image. Inner Price J C, 1990. Using spatial context in satellite data to infer
Mongolia Agricultural University. regional scale evapotranspiration. IEEE Transactions on
Carlson T N, Gillies R R, Perry E M, 1994. A method to make Geoscience and Remote Sensing. 28(5):940-948.
use of thermal infrared temperature and NDVI measurements to Liu Q, Zhang G L, Shahzad A, Wang X P, Wang G D, Pan Z K,
infer surface soil water content and fractional vegetation cover. Zhang J H, 2019. SPI-based drought simulation and prediction
Remote Sensing Reviews. 9(2):16l-173. using ARMA-GARCH model. Applied Mathematics and
Centritto M, Brilli F, Fodale R, Loreto F, 2011. Different Computation. 355(1):96-107.
sensitivity of isoprene emission, respiration and photosynthesis Qi S H, 2004. Drought Monitoring Remote Sensing Model and
to high growth temperature coupled with drought stress in black China's Drought Time and Space Analysis. Beijing: Chinese
poplar (Populus nigra) saplings. Tree Physiology. Academy of Sciences.
31(3):275-286. Sandholt I, Rasmussen K, Andersen J, 2002. A simple
Chen B, Zhang X X, Hua K, Xu W, 2013. Application of interpretation of the surface temperature/ vegetation index space
Temperature Vegetation Dryness Index (TVDI) in Grassland for assessment of surface moisture status. Remote Sensing of
Drought Monitoring. Arid Land Geography. 36(05):930-937. Environment. 79(2):213-224.
Fu Q, Zhou Z Q, Li T X, Liu D, Hou R J, Cui S, Yan P R, 2018. Sun Z Y, Zhang J Q, Zhang Q, Hu Y, Yan D H, Wang C Y, 2014.
Spatiotemporal characteristics of droughts and floods in Integrated risk zoning of drought and waterlogging disasters
northeastern China and their impacts on agriculture. Stochastic based on fuzzy comprehensive evaluation in Anhui Province,
Environmental Research and Risk Assessment. China. Natural Hazards. 71(3):1639-1657.
32(10):2913-2931. Telesca L, Vicente-Serrano S M, 2013. Power spectral
Goward S N. Hope A S, 1989. Evapotranspiration from characteristics of drought indices in the Ebro river basin at
combined reflected solar and emitted terrestrial radiation: different temporal scales. Stochastic Environmental Research &
Preliminary F1FE results from AVHRR data. Advances in Space Risk Assessment. 27(5):1155-1170.
Research. 9(7):239-249. Van Huijgevoort M H J, Van Lanen H A J, Teuling A J,
Liu X J, Zhang J Q, Ma D L, Bao Y L, Tong Z J, Liu X P, 2013. Uijlenhoet R, 2014. Identification of changes in hydrological
Dynamic risk assessment of drought disaster for maize based on drought characteristics from a multi-GCM driven ensemble
integrating multi-sources data in the region of the northwest of constrained by observed discharge. Journal of Hydrology.
Liaoning Province, China. Natural Hazards. 65(3):1393-1409. 512(5):421-434.
Moran M S, Clarke T R, Inoue Y, Vidal A, 1994. Estimating Wang Q F, Wu J J, Lei T J, He B, Wu Z T, Liu M, Mo X Y,
crop water deficit: using the relation between surface-air Geng G P, Li X H, Zhou H K, Liu D C, 2014. Temporal-spatial
temperature and spectral vegetation index. Remote Sensing of characteristics of severe drought events and their impact on
Environment. 49(3):246-263. agriculture on a global scale. Quaternary International.
Nail M, Zhang K, Martin K, 2018. Analysis of drought and vuln 349:10-21.
erability in the North Darfur region of Sudan. Land Degradatio Wilhite D A, 2000. Drought as a natural hazard: Concepts and
n & Development. 29(12): 4424-4438. definitions. Drought A Global Assessment. (1):3-18.
Nait-Ali B, Oummadi S, Portuguez E, Alzina A, Smith D S, Zhang J, Chen H, Zhang Q, 2019. Extreme drought in the recent
2017. Thermal conductivity of ceramic green bodies during two decades in northern China resulting from Eurasian warming.
drying. Journal of the European Ceramic Society. Climate Dynamics. 52(5-6):2885-2902.
37(4):1839-1846. Zhang L Y, Yang D, Ma L, 2017. Characteristics and Causes of
Nemani R, Pierce L, Running S, Goward S, 1993. Developing Meteorological Drought in Beijing-Tianjin-Hebei Region.
satellite-derived estimates of surface moisture status. Journal of Journal of Hydroelectric Engineering. 36(12):124-156.
This contribution has been peer-reviewed.
https://doi.org/10.5194/isprs-archives-XLII-3-W10-747-2020 | © Authors 2020. CC BY 4.0 License. 753You can also read