Weather, Psychological Wellbeing and Mobility during the First Wave of the COVID-19 Pandemic - IZA DP No. 14119 FEBRUARY 2021
←
→
Page content transcription
If your browser does not render page correctly, please read the page content below
DISCUSSION PAPER SERIES

IZA DP No. 14119

Weather, Psychological Wellbeing and
Mobility during the First Wave of the
COVID-19 Pandemic

Ashley Burdett
Apostolos Davillas
Ben Etheridge

FEBRUARY 2021
DISCUSSION PAPER SERIES

IZA DP No. 14119

Weather, Psychological Wellbeing and
Mobility during the First Wave of the
COVID-19 Pandemic
Ashley Burdett
University of Essex
Apostolos Davillas
Health Economics Group, University of East Anglia and IZA
Ben Etheridge
University of Essex

FEBRUARY 2021

Any opinions expressed in this paper are those of the author(s) and not those of IZA. Research published in this series may
include views on policy, but IZA takes no institutional policy positions. The IZA research network is committed to the IZA
Guiding Principles of Research Integrity.
The IZA Institute of Labor Economics is an independent economic research institute that conducts research in labor economics
and offers evidence-based policy advice on labor market issues. Supported by the Deutsche Post Foundation, IZA runs the
world’s largest network of economists, whose research aims to provide answers to the global labor market challenges of our
time. Our key objective is to build bridges between academic research, policymakers and society.
IZA Discussion Papers often represent preliminary work and are circulated to encourage discussion. Citation of such a paper
should account for its provisional character. A revised version may be available directly from the author.

 ISSN: 2365-9793

 IZA – Institute of Labor Economics
Schaumburg-Lippe-Straße 5–9 Phone: +49-228-3894-0
53113 Bonn, Germany Email: publications@iza.org www.iza.org
IZA DP No. 14119 FEBRUARY 2021

 ABSTRACT
 Weather, Psychological Wellbeing and
 Mobility during the First Wave of the
 COVID-19 Pandemic*
 To reduce infection rates during the first UK wave of the COVID-19 outbreak, a first
 lockdown was announced on March 23, 2020, with a final easing of the restrictions on
 July 4, 2020. Among the most important public health costs of lockdown restrictions are
 the potential adverse effects on mental health and physical activity. Using data from the
 UK Household Longitudinal Study (UKHLS) and Google COVID-19 Mobility Reports we find
 evidence of reduced park mobility during the initial period of the first UK lockdown and
 confirm existing evidence of worsening psychological wellbeing. Linkage with weather
 data shows that contrary to popular belief, weather conditions do not exacerbate the
 mental health consequences of the pandemic, while we find systematic links between
 park mobility and weather over the same period. Our results highlight the importance of
 promoting the existing guidelines on regular exercise during winter lockdowns.

 JEL Classification: I10, I12, C23
 Keywords: COVID-19, mental health, mobility, weather conditions

 Corresponding author:
 Apostolos Davillas
 Norwich Medical School
 Health Economics Group
 University of East Anglia
 Norwich
 United Kingdom
 E-mail: A.Davillas@uea.ac.uk

 * We thank Lisa Spantig for helpful discussions. Understanding Society is an initiative funded by the Economic
 and Social Research Council and various Government Departments, with scientific leadership by the Institute for
 Social and Economic Research, University of Essex, and survey delivery by NatCen Social Research and Kantar Public.
 The research data are distributed by the UK Data Service. The funders, data creators and UK Data Service have no
 responsibility for the contents of this paper.
1. Introduction

COVID-19 originated in the city of Wuhan, China, in December 2019 and spread rapidly
to become a global pandemic. As part of the UK response to the pandemic’s first wave, the
closure of pubs, restaurants, gyms and other social venues was announced on March 20,
2020, followed by the first national lockdown on March 23. It was not until May 13 that
the lockdown began to be eased, with two subsequent lockdown easings on June 1 and 15;
the final widespread easing occurred on July 4.1

The imposition of a national lockdown during the first wave of the COVID-19 outbreak
was driven by the alarming projected spread of the disease, the accompanying
implications for public health, and additional pressure on the health care system. This
motivated a shift of focus in government policy from “mitigation”, aiming to reduce the
health impact of the epidemic but not to stop transmission completely, to “suppression”,
where lockdown is required to reduce disease spread (Ferguson et al., 2020; Iacobucci,
2020). These lockdown restrictions, and the resulting impact on social life and the
economy, are however linked to at least two major negative public health consequences:
reduction in physical exercise (both indoors, due to the closure of gyms, and outdoors, due
to mobility restrictions) and deterioration of mental health.

A growing body of international studies show that lockdown policies have a negative
impact on mobility and outdoor recreational activity (e.g., Askitas et al., 2020); the
adverse impact of COVID-19 and lockdown restrictions on mental health has also recently
been documented (e.g., Banks and Xu, 2020; Davillas and Jones, 2021). Given pre-COVID
studies on the link between weather conditions and wellbeing outcomes (e.g., Frijters et
al., 2020), it is of particular interest to assess if adverse weather conditions during the
first lockdown in the UK exacerbated the consequences of the COVID-19 outbreak and
lockdown on mental health and outdoor recreational activity. This evidence is also of
interest because lockdown restrictions have been designed to permit (limited) outdoor
activity to alleviate concerns about mental health. Finally, such evidence allows us to
better understand if the wellbeing costs of additional lockdowns will be heightened during
winter and spring 2021.

1COVID-19 policy tracker. The Heath Foundation. https://www.health.org.uk/news-and-comment/charts-
and-infographics/covid-19-policy-tracker.

 1
In this study we use data from the UK Household Longitudinal Study (UKHLS) on
psychological wellbeing, collected before and during the first wave of the COVID-19
outbreak. Similarly, Google COVID-19 Mobility Reports are employed to explore outdoor
recreational activity before and during different stages of the first national lockdown.
Linkage with date- and location-specific weather conditions shows that, contrary to
popular belief, weather conditions do not exacerbate the mental health consequences of
the pandemic, while we find a stronger link with park mobility.2

2. Data

UK Household Longitudinal Study (UKHLS)
The UKHLS is a longitudinal, nationally representative UK study. From April
2020, participants of the UKHLS were repeatedly approached to complete a short web
survey focussing on the impact of the COVID-19 pandemic. We utilize the April to July
monthly waves of this survey, covering the first wave of the pandemic in the UK. Pre-
pandemic data is taken from an interim release of the UKHLS main survey, containing
responses from households interviewed in 2019.3

Psychological wellbeing is measured by the Likert GHQ-12 score, collected using identical
questions in the interim UKHLS wave (2019) and the April-July UKHLS COVID-19
survey waves. For our analysis, scores are inverted and standardized to have a mean of
zero and standard deviation of one, with higher values implying better mental health.

Google Covid-19 mobility data
Park mobility, our proxy for outdoor recreational activity, is taken from Google COVID-
19 Mobility Reports, which provide a daily measure of mobility from cell-phone locations
aggregated at the mobility zone level. Mobility zones roughly correspond to major cities
and counties. Mobility is measured by the percentage change in a combined index of park
mobility (capturing number of visits and duration of stay in parks) relative to the baseline

2 It has been claimed by columnists that the negative effect on mental health due to the COVID-19 pandemic
will be exaggerated by experiences of colder and darker days (for example, The Economist,
https://www.economist.com/business/2020/11/26/why-office-morale-will-be-hard-to-maintain-this-year).
3 Due to delays in data collection, the dataset also contains a very small number of responses from January

and February 2020 (before the COVID-19 outbreak in the UK).

 2
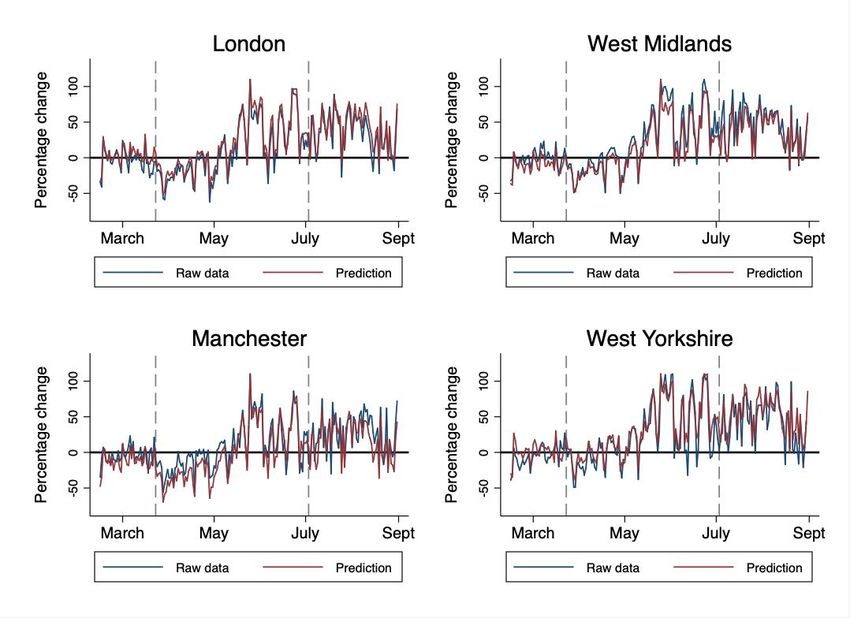
period, January 3 ─ February 6, 2020, before COVID-19 risks were fully realised.4 We use
data from February 15 to August 31, 2020, covering all stages of the first national
lockdown in the UK.

Figure 1 plots park mobility for the four most populous mobility zones. The vertical lines
demarcate the start and end of the first lockdown period. Compared to baseline (January
3 ─ February 6, 2020), there is a drop in mobility in the initial period after the
announcement of the first lockdown (as shown by the negative percentage changes in
mobility from baseline) followed by a sizeable increase in our relative outdoor recreational
activity measure (positive percentage changes from baseline) in the middle of May and
beyond, a period that coincides with the relaxation of the lockdown restrictions on the
duration of outdoor exercise and seasonal variation.

 Figure 1: Mobility in parks, February – August 2020

Note: Prediction from regression models of park mobility on location and date fixed effects, lockdown
indicators and their interactions. Population weights are accounted for.

4It was not until February 11, 2020 that the Health Secretary made his first official parliamentary statement
regarding the potential risks of COVID-19 for the UK population. The UK government set out the first
COVID-19 'battle plan' much later (March 1, 2020).

 3
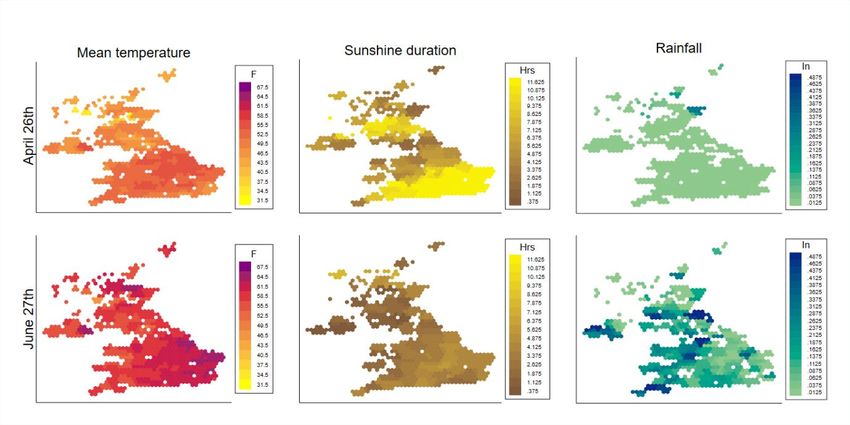
Linkage of UKHLS and Google Covid-19 mobility records to weather data
Daily measures of mean temperature, sunshine duration and total precipitation are
extracted from weather station data available from the National Centers of
Environmental Information and the Meteorological Office Integrated Data Archive
System. By mapping each Lower layer Super Output Area (LSOA) available in our
UKHLS panel to its nearest weather station, we are able to link date- and location-specific
weather data with the UKHLS. 5 This allows us to explore the association between
weather conditions and psychological wellbeing before and during different stages of the
first COVID-19 outbreak.6

Weather data are also linked with our Google mobility data, again using the nearest
weather station at the day and mobility zone level.7 This dataset allows us to consider the
impact of weather on park activity.

Figure 2 plots weather conditions for a day in April and a day in June 2020. These graphs
show the presence of systematic variations in weather conditions across locations and over
time.

5 The LSOAs are lower layer geographies, defined to account for population size, mutual proximity and social
homogeneity; they contain on average 1,500 residents/650 households.
6 Some weather observations are missing at both the daily and within day level because stations

intermittently go offline. To alleviate this problem, we apply the mapping iteratively to find the closest
weather stations to each LSOA. We then assume weather information is missing if the nearest weather
station with data is more than 40km away from the LSOA.
7 As in the case of linkage with the UKHLS data, we employ the mapping iteratively to mitigate the impact

of missing weather information.

 4
Figure 2: Neighbourhood-level (LSOA) weather variations

Control variables
Our psychological wellbeing regressions also account for a set of control variables, which
may affect mental health during the COVID-19 outbreak. Specifically, we account for age
polynomials, gender, holding a university degree, employment, presence of children in the
household, living with a partner and region of residence (dummies for the nine
government office regions of England, Scotland, Wales and Northern Ireland).8

3. Methods

We estimate the following model for both our outcomes, psychological wellbeing and park
mobility, captured at time t by :

 = + ∑ ( ) × ( 1 + 2 + 3 ) + + + + (1)

where, is the mean daily temperature, the daily sunshine duration and
is total daily precipitation. For the park mobility regressions, stands for mobility zone;
for the psychological wellbeing regressions, indexes individuals.

8 Summary statistics of all other variables used in the analysis are available in Table A1 (Appendix).

 5
We use a trichotomous lockdown indicator ( ) which partitions the survey period into
“pre-lockdown” (up to March 22), “lockdown” (March 23 - July 3) and “eased restrictions”
(July 4 onwards) 9 . Estimates of 1 , 2 , 3 capture effects of the interaction of the
weather variables with each lockdown sub-period (binary dummies, ). All our models
include fixed effects, , to absorb time-invariant individual (for the psychological
wellbeing equation) or mobility zone (for the mobility equation) characteristics , and day
effects, , to account for seasonal and common time components, such as changes in park
mobility or wellbeing around bank holidays.

A set of additional covariates, , is also included in each equation. For the park mobility
equation, this vector most importantly includes interactions between the lockdown
indicator and mobility zones, capturing potential effects of “local lockdowns” after the full
lockdown ended in July, as well as differential location-specific compliance during the
lockdown period itself.10

For our psychological wellbeing model, controls for individual-level factors that may
vary over time (see Section 2). We allow for arbitrary correlation of the error terms
within individuals/mobility zones and across time, by clustering standard errors at the
location level.11

4. Results

Table 1 presents the estimates of our psychological wellbeing regression model. Compared
to baseline (2019), psychological wellbeing declined during lockdown as shown by the
negative April - July 2020 wave coefficients. This decline is strongest over April - June
and less pronounced in July, in line with the easing of lockdown restrictions.

Concerning weather, we find that the estimated associations with psychological well-
being are small and not statistically significant. The interactions between weather

9 Due to the different data sources used in our analysis (UKHLS data and Google mobility data), pre-lockdown
period in our mobility equation model covers February 15 – March 22, while the pre-lockdown period for our
psychological wellbeing model covers the whole of 2019 up to February 2020 (Interim 2019 UKHLS wave).
10 We also include an interaction between mobility zones and day of the week indicators, primarily to account

for the structure of the data, which is normalized at the location day-of-the-week level.
11 Specifically, standard errors for the mobility regressions are clustered at the mobility zone level, while for

the psychological wellbeing regressions the standard errors are clustered at the primary sample unit level
(corresponding to postal sectors of UKHLS sample collection).

 6
conditions and lockdown indicators show no systematic associations during any sub-
period, suggesting, in particular, that weather conditions do not exacerbate the
psychological wellbeing consequences of lockdown 12 . In Table A2 (appendix) we show
similarly small and insignificant coefficients when we estimate the effect of weather
without interactions.

 Table 1: Psychological wellbeing regression model
 Coeff.
 (std. error)
 0.025
 Mean temp. (tens of F)
 (0.019)
 -0.013
 Sunshine duration (4 hours)
 (0.009)
 -0.008
 Rainfall (tenths of an inch)
 (0.011)
 -0.024
 Pre-lockdown x Mean temp.
 (0.024)
 0.010
 Pre-lockdown x Sunshine duration
 (0.021)
 0.0087
 Pre-lockdown x Rainfall
 (0.013)
 0.018
 Eased restrictions x Mean temp.
 (0.043)
 0.020
 Eased restrictions x Sunshine duration
 (0.017)
 0.013
 Eased restrictions x Rainfall
 (0.013)
 -0.150***
 April 2020
 (0.033)
 -0.159***
 May 2020
 (0.029)
 -0.189***
 June 2020
 (0.033)
 -0.085*
 July 2020
 (-0.048)
 Sample size 50,062
 Note: Analysis accounts for sample weights.
 *p
Detailed results of the park mobility regression model are presented in Table 2. The first
column presents results from a simplified version of eq. 1, without the interaction effects
between the lockdown stages and weather. The second column presents our estimates of
the full specification. To ease interpretation of the later, Figure 3 offers a graphical
visualization of the estimated marginal effects of weather at each lockdown stage.

 Table 2: Mobility (expressed as percentage changes from pre-
 lockdown baseline) regression models
 (1) (2)
 Coeff. Coeff.
 (std. error) (std. error)
 3.704** 7.554***
 Mean temp. (tens of F)
 (1.697) (1.846)
 11.910*** 10.700***
 Sunshine duration (4 hours)
 (0.625) (0.698)
 -0.877*** -1.410***
 Rainfall (tenths of an inch)
 (0.177) (0.220)
 -2.832
 Pre-lockdown x Mean temp.
 (2.429)
 -1.265
 Pre-lockdown x Sunshine duration
 (1.871)
 1.253***
 Pre-lockdown x Rainfall
 (0.348)
 -17.49***
 Eased restrictions x Mean temp.
 (3.863)
 5.290***
 Eased restrictions x Sunshine duration
 (1.272)
 0.454
 Eased restrictions x Rainfall
 (0.549)
 Sample size 12,831
 Note: Population weights are accounted for. * p
Turning to the pre-lockdown period, there is limited evidence that temperature and
sunshine conditions exert systematically different effects compared to the lockdown
period itself (fourth and fifth rows of Table 2). However, in the period after lockdown
(‘eased restrictions’), there is evidence of differential effects of these variables: while the
effect of sunshine on mobility is heightened, temperature has a negative effect on mobility
(Figure 3). Although initially surprising, the later seems plausible; during the summer
months, cooler weather is more amenable to outdoor activity. We also find a systematic
negative association between mobility and rainfall during the same period (Figure 3).

Figure 3: Marginal effects (with 95% confidence interval bars) of weather on mobility in
 parks by stages of the first UK lockdown (Specification 2, Table 2)

5. Conclusion

Using survey and Google mobility data we find evidence for reduced outdoor recreational
activity (proxied by park mobility) during the initial period of the first UK lockdown and
confirm existing evidence of worsening psychological wellbeing. Weather conditions

 9
(temperature, sunshine and rainfall) affect park mobility, while we find no systematic
associations between weather conditions and psychological wellbeing either before,
during, or after the first national lockdown.

Overall, our evidence suggests that weather conditions do not exacerbate the mental
health costs of the pandemic. Promotion of the existing guidelines from public health
authorities on regular indoor exercise should be further intensified during winter
lockdowns as weather conditions affects people’s outdoor physical activity.

References

Askitas, N., Tatsiramos, K., Verheyden, B. (2020). Lockdown strategies, mobility patterns
and COVID-19. In Covid Economics-Vetted and Real-Time Papers.

Banks, J., Xu, X. (2020). The mental health effects of the first two months of lockdown
during the COVID-19 pandemic in the UK. Fiscal Studies, 41(3), 685-708.

Davillas, A., Jones, A.M. (2021). The First Wave of the COVID-19 Pandemic and Its
Impact on Socioeconomic Inequality in Psychological Distress in the UK. IZA, Bonn,
Germany. DP No. 14057.

Ferguson, N., Laydon, D., Nedjati Gilani, G., Imai, N., Ainslie, K., Baguelin, M., .., Ghani,
A. (2020). Report 9: Impact of non-pharmaceutical interventions (NPIs) to reduce
COVID19 mortality and healthcare demand. Imperial College London, 10(77482), 491-
497.

Frijters, P., Chitwan, L., Debayan, P.(2020). Daily weather only has small effects on
wellbeing in the US. Journal of Economic Behavior and Organization, 176, 747-762.

Iacobucci, G. (2020). Covid-19: UK lockdown is “crucial” to saving lives, say doctors and
scientists. BMJ , 368. https://doi.org/10.1136/bmj.m1204

 10
Appendix

 Table A1: Summary statistics of selected variables used in our analysis.
 Variable Mean Standard deviation
 Park mobility† 20.905 43.662
 Mean temperature (tens of F) 57.567 8.514
 Sunshine duration (4 hours) 7.721 5.189
 Rainfall (tenth of an inch) 0.055 0.137
 GHQ-12 Likert Score†† 12.270 6.019
 Control variables at the GHQ-12 models
 Age (in years) 51.406 17.661
 Female 0.526 0.499
 Male (reference) 0.474 0,499
 Degree 0.298 0.457
 Non-degree (reference) 0.702 0.457
 Cohabitation/married 0.637 0.481
 Non-cohabitation/married (reference) 0.363 0.481
 Children in hh 0.178 0.383
 No children in hh (reference) 0.822 0.383
 Employed 0.589 0.492
 Non-employed (reference) 0.411 0.492
 North West 0.091 0.287
 Yorkshire and the Humber 0.064 0.245
 East Midlands 0.087 0.283
 West Midlands 0.097 0.296
 East of England 0.100 0.299
 London 0.122 0.328
 South East 0.167 0.368
 South West 0.089 0.284
 Wales 0.038 0.190
 Scotland 0.084 0.277
 Northern Ireland 0.021 0.144
 North East (reference) 0.044 0.206
 † Based on our working sample for analysis of our mobility outcome (12,831 observations). Summary
 statistics for all other variables are based on our full sample of 50,062 observations (sample size used
 in the analysis for our mental health outcome).
 †† Summary statistics of the raw GHQ-12 Likert score are presented here. For the needs of our

 analysis, the GHQ-12 Likert score is inverted and standardized so that higher values imply better
 mental health.
 Note: Sample weights are accounted for.

 11
Table A2: Psychological wellbeing regression model –
 Without weather-lockdown interactions
 Coeff.
 (std. error)
 0.010
 Mean temp. (tens of F)
 (0.013)
 -0.006
 Sunshine duration (4 hours)
 (0.007)
 -0.002
 Rainfall (tenths of an inch)
 (0.005)
 Sample size 50,062
 Note: Analysis accounts for sample weights.
 *p
You can also read