Economic and Financial Outlook - World - Présentation à CFA Montréal Stefane Marion January 23, 2020 - CFA Montréal
←
→
Page content transcription
If your browser does not render page correctly, please read the page content below
Economic and Financial
Outlook
Présentation à CFA Montréal

Stefane Marion
January 23, 2020

World

                              2
3

U.S.: Perspective on the current business cycle
Actual vs. potential* real GDP

20,000
          $ billions
19,600

19,200                                                                                                   Actual GDP
18,800

18,400
                                                                                                                     F
                                                                                                                    Mature
18,000
                                                                                                                    phase

17,600

17,200
                                                  Potential GDP
16,800                                                                              E
                                                                                 Expansion
16,400

16,000           A
               Peak
15,600

15,200                 B                      D
14,800
            Recession           C
                              Trough
                                              Recovery

           2007        2008     2009   2010    2011      2012   2013     2014     2015    2016     2017     2018     2019    2020
 * As calculated by the Congressional Budget Office (CBO) - NBF Economics and Strategy (data via Fed of St-Louis)
                                                                                                                                    4
U.S.: Perspective on inflation
Inflation as measured by PCE deflator: Total, core and trimmed

 4.5
       % (y/y)
 4.0

 3.5

 3.0

 2.5
                                                                                             Trimmed
 2.0
                                                                                               Core
 1.5                                                                                           Total

 1.0

 0.5

 0.0

-0.5

-1.0

-1.5
   2000          2002      2004        2006    2008    2010      2012   2014   2016   2018     2020
 NBF Economics and Strategy (data via Fred)
                                                                                                       5

U.S.: Perspective on inflation
Inflation as measured by CPI, CPI median and CPI-trimmed

 6
     % (y/y)

 5

 4

                                                                                             Median
 3
                                                                                             Trimmed
 2                                                                                              CPI

 1

 0

-1

-2

-3
               2002     2004        2006      2008    2010    2012      2014   2016   2018     2020
 NBF Economics and Strategy (data via Fred)
                                                                                                       6
U.S.: Duration of the mature phase and inflation
U.S. output gap vs. core PCE inflation

12
      %

10

 8

 6
                                                               Core PCE
 4                                                            (y/y change)

 2

 0
                 72           21         24            9                 57        24                 27
 -2

 -4
             Mature phase:
 -6                                                            Output gap
          Longest = 72 months
          Shortest = 9 months
 -8
  1960      1965      1970      1975     1980   1985   1990     1995     2000   2005    2010   2015   2020
 NBF Economics and Strategy (data via FRED)
                                                                                                             7

                                                                                                             8
9

10
11

World: The most synchronized easing cycle in a decade
Share of central banks cutting rates (%)

80
     % (quarterly data)

70

60                                                                                             Q3 2019

50

40

30

20

10

 0
     2000        2002        2004         2006           2008   2010   2012   2014   2016   2018
 NBF Economics and Strategy (data via Financial Times)
                                                                                                     12
13

World: Signs of stabilization
Global sales of semiconductors

42
     $ billions

40

38

36

34

32

30

28

26

24
          2014               2015                 2016   2017   2018   2019   2020
 NBF Economics and Strategy (SIA via Bloomberg)
                                                                                14
15

Perspective on financial stress
NBF financial stress index for Canada and the United-States (JAN 2020)

 6.0
       Standard deviations
 5.5

 5.0

 4.5

 4.0

 3.5

 3.0

 2.5

 2.0

 1.5

 1.0

 0.5

 0.0
                                                                                                            CAN
-0.5

-1.0                                                                                                    U.S.
   2007 2008        2009      2010      2011     2012      2013   2014   2015   2016   2017   2018   2019      2020
 NBF Economics and Strategy (data via Bloomberg and Refinitiv)
                                                                                                                  16
World: Positive economic surprises are becoming widespread
Citi economic surprise index: Emerging Markets and Advanced Economies

 60
      Index
 50

 40

 30

 20
                                                                                                     Advanced
 10
                                                                                                        Emerging
  0

-10

-20

-30

-40

-50
 2017Q3 2017Q4         2018Q1      2018Q2     2018Q3    2018Q4   2019Q1   2019Q2   2019Q3   2019Q4    2020Q1
 NBF Economics and Strategy (data via Bloomberg)
                                                                                                                17

MSCI composite index: EPS Performance
                                                                                                 12 months
                                             2018          2019           2020         2021
                                                                                                      forward

MSCI ACWI                                      13.4         0.0            9.8          10.3             9.8
 MSCI World                                    14.5         -0.1           8.8          9.8              8.9
  MSCI USA                                    24.2          1.0            9.2          11.2             9.8
  MSCI Canada                                  11.7         5.0            5.9          7.7              6.0
  MSCI Europe                                  5.8          -0.8           8.8          8.0              8.7
  MSCI Pacific ex Jp                           7.7          -0.4           4.2          5.0              4.3
  MSCI Japan                                       NA       -4.8           -6.6         9.9              7.5
 MSCI EM                                       8.0          1.0           15.1          13.3            15.0
  MSCI EM EMEA                                 25.7         -3.3          10.1          8.9              9.6
  MSCI EM Latin America                       10.6          5.1           18.7          11.0            17.9
  MSCI EM Asia                                 3.6          1.6           16.0          14.9            15.9
1/17/2020

NBF Economics and Strategy (data via Refinitiv)
                                                                                                                18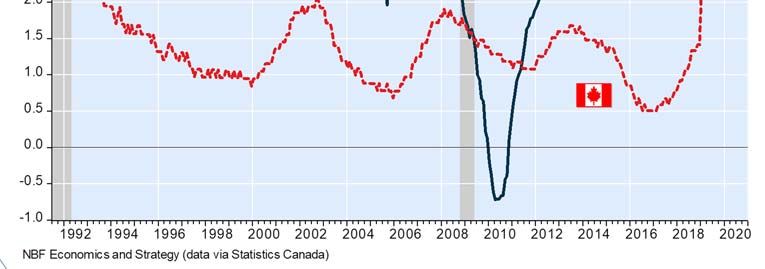
U.S.: Valuation at cyclical high
 Forward PE ratio for the S&P 500

 25
         ratio
 24
 23
 22
 21
 20
 19
 18
 17
 16
 15
 14
 13
 12
 11
 10
     9
             1990                     1995              2000                   2005                     2010                     2015            2020
 NBF Economics and Strategy (data via Refinitiv)
                                                                                                                                                        19

U.S. : Perspective on valuation
S&P 500 earnings yield and 7-10 years U.S. treasury yield
12

10

8

6

4
                   Equities cheap
                  relative to bonds
2

0

-2               Equities expensive
                  relative to bonds
                                        Recessions      U.S. 7-10 years Treasury Yield          S&P 500 Earnings Yield          Spread
-4
  1990      1992       1994     1996     1998    2000     2002      2004      2006       2008       2010      2012       2014      2016   2018   2020

NBF Economics and Strategy (data via Refinitiv)
                                                                                                                                                        20
U.S. Treasuries: Term premium on 10-year zero coupon
Estimate based on Tobias Adrian, Richard Crump, and Emanuel Moench model
550
Basis points
500
450
400
350
300
250
200
150
100
50
0
-50
-100
-150
1965 1970 1975 1980 1985 1990 1995 2000 2005 2010 2015 2020
NBF Economics and Strategy (data via Federal Reserve Bank of New York)
21
Average S&P 500 performance by sectors in different phases
of the cycle since 1973
(Total return indices, annualized growth rates)
Recoveries Expansions Mature Phases Current Phase
Total 22.4% 10.8% 14.0% 14.4%
Oil & Gas 57.8% 6.9% 23.5% ‐1.4%
Basic Materials 23.3% 10.4% 13.3% 5.2%
Gold mining 20.0% 12.3% 9.6% 10.0%
Metals and mines 12.2% 10.4% 20.8% ‐1.2%
Industrials 34.6% 9.9% 17.6% 13.2%
Consumer discretionary 29.2% 13.9% 8.7% 17.3%
Consumer Staples 8.2% 15.5% 17.7% 7.0%
Health Care 6.9% 11.8% 16.4% 14.1%
Financials 22.3% 16.8% 11.7% 12.2%
Banks 29.3% 17.4% 6.2% 8.5%
Insurance 11.1% 18.3% 16.2% 9.1%
Real Estate 11.6% 18.0% 13.9% 12.4%
IT 12.9% 7.5% 12.6% 25.8%
Telecoms 11.9% 18.8% 13.9% 9.0%
Utilities 24.0% 15.4% 13.3% 13.8%
*Reces sions da tes a re thos e of the NBER
NBF Economics a nd Stra tegy 22World: The greenback is weakening
Trade-weighted U.S. dollar index (vs. a basket of 26 currencies)
120
index
119
118
117
116
115
114
113
112
111
110
109
108
107
106
2016 2017 2018 2019 2020
NBF Economics and Strategy (Federal Reserve data via Refinitiv)
23
World: Speculators are still long the greenback
Leveraged funds net speculative position on USD
35
USD
30
25
20
15
10
5
0
-5
-10
-15
-20
2016 2017 2018 2019 2020
NBF Economics and Strategy (Federal Reserve data via Refinitiv)
2425 26
U.S.

                                                                                                                      27

       U.S.: Manufacturing weakness did not spread to services
       ISM nonmanufacturing vs. manufacturing

       62
            Index
       60

       58
                                                                                                               Services
       56

       54

       52

       50

       48

       46                                                                                                   Manufacturing

       44

       42

       40

       38

       36

       34
             2007     2008      2009     2010     2011    2012   2013   2014   2015   2016   2017   2018   2019   2020
        NBF Economics and Strategy (data via Refinitiv)
                                                                                                                      28
29
U.S.: Homebuilder confidence at 20-year high
NAHB/Wells Fargo Housing Market Index. Last observation: December 2019
80
Index
75
70
65
60
55
50
45
40
35
30
25
20
15
10
5
1985 1990 1995 2000 2005 2010 2015 2020
NBF Economics and Strategy (data via Refinitiv)
30U.S.: Supply of homes on resale market at a record low
Number of houses available on the market expressed as a multiple of monthly sales
12
months
11
10
9
8
7
6
5
4
3
1990 1995 2000 2005 2010 2015 2020
NBF Economics and Strategy (Source: National Association of Realtors via Refinitiv)
31
32World: China alters hukou system to increase urbanization rate
Urbanization rate: China and the U.S.
85
%
80 U.S.
75
70
65
60
55
50
45 China
40
35
30
25
20
15
1975 1980 1985 1990 1995 2000 2005 2010 2015 2020 2025
NBF Economics and Strategy (data via https://population.un.org/wup/Download/)
33
34U.S.: Inflation expectations are trending up
10-year breakeven inflation rate
2.20
%
2.15
2.10
2.05
2.00
1.95
1.90
1.85
1.80
1.75
1.70
1.65
1.60
1.55
1.50
1.45
2018Q1 2018Q2 2018Q3 2018Q4 2019Q1 2019Q2 2019Q3 2019Q4 2020Q1
NBF Economics and Strategy (data via Refinitiv)
35
3637 38
39

40
Canada

         41

         42
Canada: The strongest population growth on record
2019 population growth, natural vs. caused by migration. Selected OECD countries
1.6
%
% Natural Migration Total
1.4
1.2
1.0
0.8
0.6
0.4
0.2
0.0
‐0.2
‐0.4
‐0.6
JAP PRT DEU POL GRC CZE ITA FIN FRA AUT NLD GBR DNK BEL CHE ESP NZL USA SWE NOR AUS MEX CAN
NBF Economics and Strategy (data via Statistics Canada and U.S. Census)
43
4445
Taux de croissance des 25-44 ans et croissance de l’IPP
2008-2018
80%
IPP a/a SWE
AUT CAN
70% NZL
AUS
60% NOR
50% GER
40%
SWI
GBR
30%
PRT BEL
FIN USA
20% DEN
10% JAP
NLD
0% FRA
-10%
ESP ITA
-20% IRE
-30%
-40% GRC
pop a/a
-50%
-18% -16% -14% -12% -10% -8% -6% -4% -2% 0% 2% 4% 6% 8% 10% 12% 14% 16%
FBN Économie et Stratégie (données via US census, Statistics Canada, Eurostats, OCDE)
46Canada : Foreign-born population is well educated
Percentage of immigrants having tertiary education (2017)
CAN
AUS
IRE
NZL
MEX
SWE
DEN
SWI
USA
OECD
BEL
PRT
FRA
AUT
NLD
ESP
DEU
GRC
ITA %
0 10 20 30 40 50 60 70
NBF Economy & Strategy (data from OECD)
47
48Canada: Perspective on homeownership rates
Homeownership rates, Canada vs. U.S.
69.2
%
68.8
68.4
68.0 Canada
67.6
67.2
66.8
66.4
66.0
65.6
65.2
64.8
U.S.
64.4
64.0
63.6
63.2
62.8
62.4
62.0
1985 1990 1995 2000 2005 2010 2015
NBF Economics and Strategy (data via U.S. Census and Statistics Canada)
49
5051 52
Toronto: Home resale market
  Ratio of active listings to sales, seasonally adjusted, quarterly basis

                      Condos apartments                                                   Other dwellings
3.5                                                                  5
        Number of standard deviations from mean
3.0
                                                                     4
2.5

2.0      Buyers’ market                                              3

1.5
                                                                     2
1.0

0.5                                                                  1

0.0
                                                                     0
-0.5
                     Balanced market
-1.0                                                                -1

-1.5
              Sellers’ market                                       -2
-2.0

-2.5                                                                -3
          2000           2005          2010       2015      2020           2000          2005        2010           2015   2020
       Last observation: Q4 2019 as of December
       NBF Economics and Strategy, data from CREA and TREB seasonally adjusted by NBF.
                                                                                                                            53

  Vancouver: Existing home resale market
 Normalized active-listings-to-sales ratio. Last observation: December 2019
 5.0 Number of standard deviations from long-term mean
 4.5
                                                                          2019.12 / 2018.12
 4.0                                                                       Active listings:     -16.3%
                                                                            Sales        :       88.1%
 3.5
 3.0
 2.5
 2.0
 1.5             Buyers’ market
 1.0
 0.5
              Balanced market
 0.0
-0.5
-1.0
                 Sellers’ market
-1.5
                   2006            2008           2010         2012            2014             2016           2018        2020
  NBF Economics and Strategy, REBGV data seasonally adjusted by NBF – for sales, CREA seasonal factors were used.
                                                                                                                            54
Montreal: Active listings to sales, by type of dwellings
Seasonally adjusted data, last observation: December 2019
Single‐family Condos
2.5 2.5
Number of standard deviations from mean Number of standard deviations from mean
Number of months to sell listed dwellings at
2.0 2.0 current sales rate
1.5 Buyers’ 1.5 Buyers’
market market
1.0 1.0
Balanced Balanced
0.5 0.5 market
market Buyers’ market
0.0 0.0
-0.5 -0.5
-1.0 -1.0
Sellers’ Sellers’
-1.5 -1.5
market market
-2.0 -2.0
2004 2006 2008 2010 2012 2014 2016 2018 2020 2004 2006 2008 2010 2012 2014 2016 2018 2020
NBF Economics and Strategy, data from Centris (seasonally adjusted by NBF)
55
56Canada: Core inflation running at its fastest pace in a decade in Q4
Average of the three core measures preferred by the Bank of Canada
2.7 So why is the BoC considering rate cuts?
Year on year % chg.
2.6 What has Mr. Poloz most nervous is an apparent deterioration
of the consumer sector. He pointed to slowing retail sales, weak
car sales and, notably, decaying consumer confidence
2.5
“Those things … they’re not just surprises, they’re more
2.4
profound,” he said. “It’s more behavioral; you can’t blame that on the
weather, per se.
2.3
“If it’s behavioral, it doesn’t usually end just instantly,” he said.
2.2
+2.1%
2.1
BoC mid‐point target
2.0
1.9
1.8
1.7
1.6
1.5
1.4
2002 2004 2006 2008 2010 2012 2014 2016 2018 2020
NBF Economics and Strategy (data via Statistics Canada)
57
58Forecast
___
summary
• World, U.S.
- Global growth of around 3.0% in 2019, faster in 2020
- China continues to grow at around 6%
- US economy at around 2% in 2020
- Geopolitical risks to remain an issue / we still expect common sense to prevail
Canada
- GDP growth a little above potential in 2020 at 1.8%; Consumers remain resilient
- No rate cuts from the BoC
• Interest rates, currency:
- Interest rates to remain low for the foreseeable future but we still see 10-year Treasury above 2.0%
- CAD towards 1.25?
- Commodity prices: Some upside (WTI closer to $60/barrel)
Regime change: Dual supply chain = less productivity = sticky inflation?
59
NBF Market Forecast NBF Market Forecast
Canada United States
Actual Q42020 (Est.) Actual Q42020 (Est.)
Index Level Jan-03-20 Target Index Level Jan-03-20 Target
S&P/TSX 17,066 17,900 S&P 500 3,235 3,300
Assumptions Q42020 (Est.) Assumptions Q42020 (Est.)
Level: Earnings * 1053 1120 Level: Earnings * 160 172
Dividend 521 554 Dividend 58 62
PE Trailing (implied) 16.2 16.0 PE Trailing (implied) 20.2 19.2
Q42020 (Est.) Q42020 (Est.)
10-year Bond Yield 1.54 2.05 10-year Bond Yield 1.79 2.18
* Before extraordinary items, source Thomson * S&P operating earnings, bottom up.
NBF Economics and Strategy 60General - This Report was prepared by National Bank Financial, Inc. (NBF), (a Canadian investment dealer, member of IIROC), an indirect wholly owned subsidiary of National Bank of Canada. National Bank of Canada is a public company listed on the Toronto Stock Exchange. The particulars contained
herein were obtained from sources which we believe to be reliable but are not guaranteed by us and may be incomplete and may be subject to change without notice. The information is current as of the date of this document. Neither the author nor NBF assumes any obligation to update the information or
advise on further developments relating to the topics or securities discussed. The opinions expressed are based upon the author(s) analysis and interpretation of these particulars and are not to be construed as a solicitation or offer to buy or sell the securities mentioned herein, and nothing in this Report
constitutes a representation that any investment strategy or recommendation contained herein is suitable or appropriate to a recipient’s individual circumstances. In all cases, investors should conduct their own investigation and analysis of such information before taking or omitting to take any action in
relation to securities or markets that are analyzed in this Report. The Report alone is not intended to form the basis for an investment decision, or to replace any due diligence or analytical work required by you in making an investment decision. This Report is for distribution only under such circumstances
as may be permitted by applicable law. This Report is not directed at you if NBF or any affiliate distributing this Report is prohibited or restricted by any legislation or regulation in any jurisdiction from making it available to you. You should satisfy yourself before reading it that NBF is permitted to provide this
Report to you under relevant legislation and regulations.
Canadian Residents - NBF or its affiliates may engage in any trading strategies described herein for their own account or on a discretionary basis on behalf of certain clients and as market conditions change, may amend or change investment strategy including full and complete divestment. The trading
interests of NBF and its affiliates may also be contrary to any opinions expressed in this Report. NBF or its affiliates often act as financial advisor, agent or underwriter for certain issuers mentioned herein and may receive remuneration for its services. As well NBF and its affiliates and/or their officers,
directors, representatives, associates, may have a position in the securities mentioned herein and may make purchases and/or sales of these securities from time to time in the open market or otherwise. NBF and its affiliates may make a market in securities mentioned in this Report. This Report may not
be independent of the proprietary interests of NBF and its affiliates. This Report is not considered a research product under Canadian law and regulation, and consequently is not governed by Canadian rules applicable to the publication and distribution of research Reports, including relevant restrictions or
disclosures required to be included in research Reports.
UK Residents - This Report is a marketing document. This Report has not been prepared in accordance with EU legal requirements designed to promote the independence of investment research and it is not subject to any prohibition on dealing ahead of the dissemination of investment research. In
respect of the distribution of this Report to UK residents, NBF has approved the contents (including, where necessary, for the purposes of Section 21(1) of the Financial Services and Markets Act 2000). This Report is for information purposes only and does not constitute a personal recommendation, or
investment, legal or tax advice. NBF and/or its parent and/or any companies within or affiliates of the National Bank of Canada group and/or any of their directors, officers and employees may have or may have had interests or long or short positions in, and may at any time make purchases and/or sales as
principal or agent, or may act or may have acted as market maker in the relevant investments or related investments discussed in this Report, or may act or have acted as investment and/or commercial banker with respect hereto. The value of investments, and the income derived from them, can go down
as well as up and you may not get back the amount invested. Past performance is not a guide to future performance. If an investment is denominated in a foreign currency, rates of exchange may have an adverse effect on the value of the investment. Investments which are illiquid may be difficult to sell
or realise; it may also be difficult to obtain reliable information about their value or the extent of the risks to which they are exposed. Certain transactions, including those involving futures, swaps, and other derivatives, give rise to substantial risk and are not suitable for all investors. The investments
contained in this Report are not available to retail customers and this Report is not for distribution to retail clients (within the meaning of the rules of the Financial Conduct Authority). Persons who are retail clients should not act or rely upon the information in this Report. This Report does not constitute or
form part of any offer for sale or subscription of or solicitation of any offer to buy or subscribe for the securities described herein nor shall it or any part of it form the basis of or be relied on in connection with any contract or commitment whatsoever.
This information is only for distribution to Eligible Counterparties and Professional Clients in the United Kingdom within the meaning of the rules of the Financial Conduct Authority. NBF is authorised and regulated by the Financial Conduct Authority and has its registered office at 71 Fenchurch Street,
London, EC3M 4HD. NBF is not authorised by the Prudential Regulation Authority and the Financial Conduct Authority to accept deposits in the United Kingdom.
U.S. Residents - With respect to the distribution of this report in the United States of America, National Bank of Canada Financial Inc. (“NBCFI”) which is regulated by the Financial Industry Regulatory Authority (FINRA) and a member of the Securities Investor Protection Corporation (SIPC), an affiliate of
NBF, accepts responsibility for its contents, subject to any terms set out above. To make further inquiry related to this report, or to effect any transaction, United States residents should contact their NBCFI registered representative. This report is not a research report and is intended for Major U.S.
Institutional Investors only. This report is not subject to U.S. independence and disclosure standards applicable to research reports.
HK Residents - With respect to the distribution of this report in Hong Kong by NBC Financial Markets Asia Limited (“NBCFMA”)which is licensed by the Securities and Futures Commission (“SFC”) to conduct Type 1 (dealing in securities) and Type 3 (leveraged foreign exchange trading) regulated
activities, the contents of this report are solely for informational purposes. It has not been approved by, reviewed by, verified by or filed with any regulator in Hong Kong. Nothing herein is a recommendation, advice, offer or solicitation to buy or sell a product or service, nor an official confirmation of any
transaction. None of the products issuers, NBCFMA or its affiliates or other persons or entities named herein are obliged to notify you of changes to any information and none of the foregoing assume any loss suffered by you in reliance of such information. The content of this report may contain information
about investment products which are not authorized by SFC for offering to the public in Hong Kong and such information will only be available to, those persons who are Professional Investors (as defined in the Securities and Futures Ordinance of Hong Kong (“SFO”)). If you are in any doubt as to your
status you should consult a financial adviser or contact us. This material is not meant to be marketing materials and is not intended for public distribution. Please note that neither this material nor the product referred to is authorized for sale by SFC. Please refer to product prospectus for full details. There
may be conflicts of interest relating to NBCFMA or its affiliates’ businesses. These activities and interests include potential multiple advisory, transactional and financial and other interests in securities and instruments that may be purchased or sold by NBCFMA or its affiliates, or in other investment
vehicles which are managed by NBCFMA or its affiliates that may purchase or sell such securities and instruments.
No other entity within the National Bank of Canada group, including National Bank of Canada and National Bank Financial Inc, is licensed or registered with the SFC. Accordingly, such entities and their employees are not permitted and do not intend to: (i) carry on a business in any regulated activity in
Hong Kong; (ii) hold themselves out as carrying on a business in any regulated activity in Hong Kong; or (iii) actively market their services to the Hong Kong public.
Copyright - This Report may not be reproduced in whole or in part, or further distributed or published or referred to in any manner whatsoever, nor may the information, opinions or conclusions contained in it be referred to without in each case the prior express written consent of NBF.
61You can also read