Interpretive Guide for Score Reports - Alternate ACCESS for ELLs Grades 1-12 SPRING 2021
←
→
Page content transcription
If your browser does not render page correctly, please read the page content below
Alternate ACCESS for ELLs
Interpretive Guide
for Score Reports
        Grades 1–12
       SPRING 2021

UNDERSTANDING STUDENT SCORES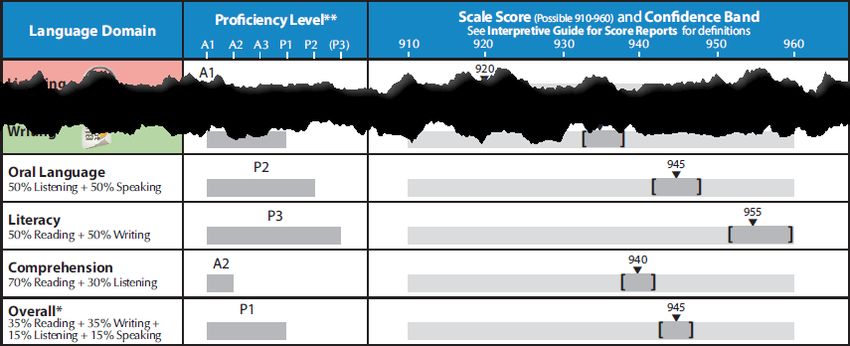
Contents
Alternate ACCESS for ELLs .................................................................................................................. 1
   Understanding Scores .................................................................................................................... 1
Alternate ACCESS for ELLs Score Reports .......................................................................................... 2
   Individual Student Report .............................................................................................................. 2
   Student Roster Report ................................................................................................................... 2
   Frequency Report........................................................................................................................... 2
Individual Student Scores ................................................................................................................... 3
   Domain Scores................................................................................................................................ 3
   Composite Scores ........................................................................................................................... 5
   Listening and Reading Scores......................................................................................................... 5
   Interpreting Student Scores ........................................................................................................... 6
Group Scores ...................................................................................................................................... 7
   Student Roster Report ................................................................................................................... 7
   Frequency Reports ......................................................................................................................... 8
Alternate Proficiency Level Descriptors (Grades 1–12) .................................................................. 10
Reading the Alternate ACCESS for ELLs Individual Student Report ................................................ 12

       This document helps educators understand what students’ Alternate ACCESS for ELLs scores
       mean and what to do with that information. It also introduces some of the tools available to
       program coordinators and district administrators interested in reviewing and taking action on
       group performance on Alternate ACCESS for ELLs.
       This document presents WIDA recommendations for interpreting and using test scores.
       State and district policies on test score use differ from each other and may vary from the
       recommendations presented in this document.
       The Every Student Succeeds Act of 2015 requires that all students identified as English
       language learners (ELLs), including those who receive special education services, be
       assessed annually for English language proficiency. The Individuals with Disabilities
       Education Act of 2004 also mandates that students with disabilities participate in state and
       district assessment programs, including alternate assessments, with any accommodations
       documented in Individualized Education Programs (IEPs). Alternate ACCESS for ELLs meets
       federal accountability requirements and provides educators with a measure of the English
       language proficiency growth of ELLs with the most significant cognitive disabilities.

© 2021 Board of Regents of the University of Wisconsin System, on behalf of WIDA.
Comments on this document? Email documentation@wida.us.                                                                       Last revised 3/1/21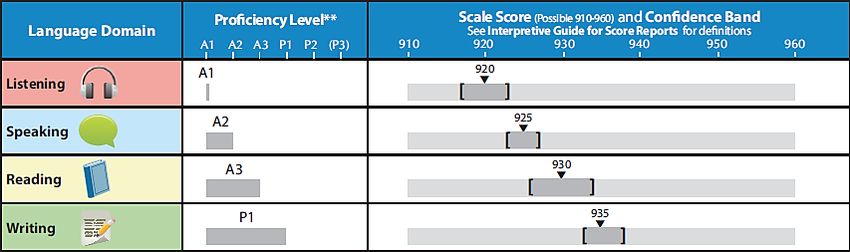
Alternate ACCESS for ELLs
Alternate ACCESS for ELLs is a suite of large-scale English language proficiency tests for grade 1–12
students with the most significant cognitive disabilities. It is one component of WIDA’s comprehensive,
standards-driven system that supports the teaching and learning of English language learners (ELLs).
The purpose of Alternate ACCESS for ELLs is to monitor student progress in English language
proficiency on a yearly basis and to serve as just one of the many criteria that educators consider as
they determine whether English learners have attained an English language proficiency level that will
allow them to meaningfully participate in English language classroom instruction. Visit
wida.wisc.edu/assess/alt-access for detail on Alternate ACCESS for ELLs.
Alternate ACCESS for ELLs is a standards-referenced test, which means that student performance is
compared to English language development standards WIDA has defined. Any student can achieve
any score, and students are not ranked against each other or against the expected performance of
monolingual English speakers. Visit wida.wisc.edu/teach/standards for detail on WIDA standards.

   The WIDA English Language Development Standards Framework, 2020 Edition will be the basis
     of future test development. However, all tests available in the 2020–2021 school year were
                                   based on the 2012 standards.

Understanding Scores
Before diving into your students’ score reports, take some time to familiarize yourself with the sample
reports on the Alternate ACCESS Scores and Reports page of the WIDA website and consider what
test scores mean in practical terms. As you examine and discuss the English language proficiency
profile that each Individual Student Report shows, use WIDA resources to help you move from scores
to concrete recommendations for the services, instructional support, and future assessment needs of
each student.
Consider holding an in-service session for your school or district so that educators can talk through
the WIDA English Language Development Standards Framework, review sample score reports, and
discuss how students’ scores might inform plans for classroom instruction and support.
WIDA offers a variety of professional development resources that can help educators and
administrators fully understand and make the best use of WIDA assessments. Check out the current
professional learning offerings and the webinars available in the Secure Portal Download Library.

    Don’t keep Alternate ACCESS for ELLs information to yourself! Scores can help parents or
   guardians, IEP teams, and other educators better understand a student’s abilities. Find resources
               for sharing scores on the Family Engagement page of the WIDA website.

Use the WIDA resources like the Alternate ACCESS for ELLs Speaking and Writing Rubrics to identify
and describe the language abilities a student already has, the skills a student can work on, and the
instructional supports that might be effective as a student develops new language abilities. Share the
profile and plans you develop with your students’ IEP teams and content teachers. Translate your
plans into the student’s home language and share them with the student’s family during conferences,
family nights, or home visits so that home can be a place of active language learning.

                                                   1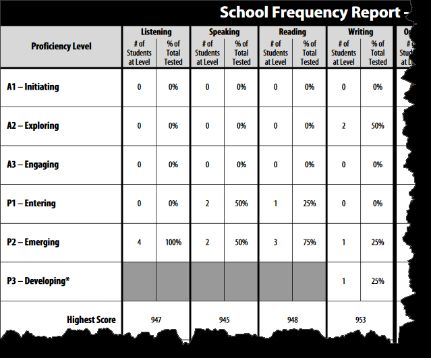
Alternate ACCESS for ELLs Score Reports
Individual Student Report
                   Audience: Students, Parents and Guardians, Teachers, IEP Teams
                   Detailed report of a single student’s performance, including proficiency level and
                   scale scores for each language domain and four composite areas. Share with
                   students to set language goals. Share with parents and guardians as part
                   of discussions around student progress and achievement. Share with the student’s
                   teachers to inform individualized classroom instruction and assessment. Share with
                   IEP teams when determining the student’s abilities and needs.

    Translations of the Individual Student Report are available in the following languages in WIDA AMS.

     Albanian, Amharic, Arabic (MSA), Bengali, Bosnian, Burmese, Chamorro, Chinese (Simplified), Chinese
     (Traditional), Chuukese, French (European), German, Gujarati, Haitian Creole, Hawaiian, Hindi, Hmong,
    Ilokano, Italian, Japanese, Karen, Khmer (Cambodian), Korean, Lao, Malayalam, Mandingo, Marshallese,
       Nepali, Polish, Portuguese (Brazilian), Punjabi, Romanian, Russian, Samoan, Serbian, Somali, Spanish
         (International), Swahili, Tagalog, Telugu, Tongan, Turkish, Ukrainian, Urdu, Vietnamese, Wolof

      Translated reports should always accompany—not replace!—official reports in English.

Student Roster Report
                     Audience: Teachers, Program Coordinators and Directors, Administrators
                     Overview report of the performances of a group of students, including
                     proficiency level and scale scores for each language domain and composite area
                     by school, grade, student, and grade-level cluster. Share with administrators,
                     teachers, and IEP teams to inform classroom instruction and assessment.

Frequency Report
              High-level report for a single grade within a school, district, or state on the number and
              percentage of tested students that achieved each proficiency level for each language
              domain and composite area.
School Frequency Report            District Frequency Report                State Frequency Report
Audience: Program                  Audience: Program Coordinators           Audience: Boards of Education,
Coordinators and Directors,        and Directors, Administrators,           State Assessment and Title III
Administrators                     Boards of Education                      Personnel
Share with school and district     Share with district staff to inform      Share with state staff to inform
staff to inform school-level       district-level programmatic              state- and district-level
programmatic decisions.            decisions.                               programmatic decisions.

              View sample reports at wida.wisc.edu/assess/alt-access/scores-reports.

                                                      2
Individual Student Scores
Domain Scores
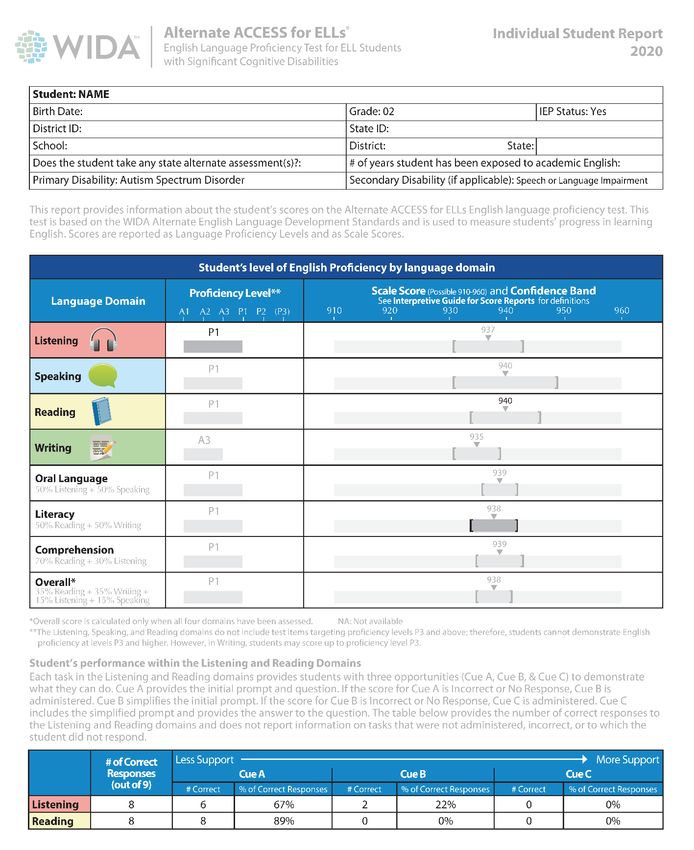
The Individual Student Report contains detailed information about a student’s performance on each
section of Alternate ACCESS for ELLs. It is primarily for students, parents or guardians, teachers, and
IEP teams. It provides a snapshot of how well the student understands and can produce the language
needed to access the academic content presented in an English language classroom. The Individual
Student Report shows a proficiency level and a scale score for each of the four language domains.
Proficiency levels are interpretive scores. In other words, they are based on, but separate from, the
student’s earned test score (see Listening and Reading Scores below for detail). The proficiency level
score describes the student’s performance in terms of the six WIDA Alternate English Language
Proficiency Levels:
P3
A1 A2 A3 P1 P2 Developing
Initiating Exploring Engaging Entering Emerging (Writing
only)
Alternate ACCESS for ELLs proficiency levels are unique. A student who scores a P1 on
Alternate ACCESS for ELLs is not necessarily performing at the same level as a student who
scores at the Entering proficiency level on ACCESS for ELLs Online or ACCESS for ELLs Paper.
At the end of the Individual Student Report, each proficiency level is explained in terms of what the
student can do using English. A complete list of these proficiency level descriptors is included in this
document. These descriptions reflect the language acquisition process at each level, including
students’ growing ability to produce and process an increasing variety of language forms and
conventions.
Take care when comparing proficiency level scores across grades. A second grader with a P1 in
Listening and an A3 in Speaking is demonstrating more developed listening skills than speaking skills.
However, proficiency levels are relevant to the context of a particular grade level. A second grader
with a P1 in Listening and an eighth grader with a P1 in Listening are exposed to very different, grade-
level appropriate content as they test. While their score reports reflect the same proficiency level,
the eighth grader is demonstrating more skill by responding to more challenging content.
3Use proficiency levels… Use scale scores…
… to make comparisons across domains. … to monitor student growth
… to develop a student-specific English language over time within a domain,
skill profile. but not across domains. A
scale score of 931 in
… as one of multiple criteria to determine a student’s Reading is not the same as
eligibility for English language support services. a 931 in Speaking!
Scale scores precisely track student growth over time and across grades. Because scale scores take
into account differences in item difficulty, they place all students on a single continuum that stretches
from grade 1 through grade 12.
In addition, scale scores allow you to compare student performance across grades, within each
domain, with more granularity than you’ll see with proficiency levels. For example, using scale scores,
you can track how much a student’s listening ability increases from sixth to seventh grade.
A scale score is reported as a single point
within a confidence band that shows the
Standard Error of Measurement (SEM).
In other words, the box beneath the scale score shows the range of scores a student might
receive if that student took the test again and again at a single point in time.
Confidence bands are a reminder that scales scores represent just one point in a range of
potential student performance outcomes. Consider, for example, these scenarios:
1) The student is healthy and well rested. The testing session goes smoothly.
2) The student isn’t feeling well. The testing session goes smoothly.
3) The student is healthy and well rested. The testing session is repeatedly interrupted
by loud noises in the room next door.
Even though the student is the same, has the same proficiency level, and responds to the
same test questions in all three scenarios, she is most likely to achieve the highest score in
the first scenario. Because Alternate ACCESS for ELLs is a statistically reliable assessment,
the scores in each scenario would be similar—but probably not exactly the same. The
confidence band reflects the expected score variation.
To use scores for instructional planning, consult the Alternate ACCESS for ELLs Speaking and Writing
Rubrics, which detail the types of spoken and written language expected of students at each
proficiency level. For example, you can use these rubrics to see that one characteristic of students at
Speaking A2—Exploring is “single words or syllables of single words.” Students at this proficiency
level might benefit from classroom activities which focus on combining words to increase meaning,
such as moving from “go” to “I go” or “you go.”
Find WIDA rubrics at wida.wisc.edu/resources?keys=rubrics.
4Composite Scores
In addition to proficiency level and scale scores for each language domain, students receive a
proficiency level score and a scale score for different combinations of the language domains. These
composite scores are Oral Language, Literacy, Comprehension, and Overall.
Proficiency levels are always calculated from scale scores. A Literacy
proficiency level, for example, is based on the Literacy scale score. The
Literacy proficiency level doesn’t reflect the midpoint between the
student’s proficiency level scores in the Reading and Writing domains.
Composite scores demand careful consideration. Composite scores can helpfully summarize
student skills. However, similar composite scores can detract from critical differences between
students. For example, two students with identical Overall scores might have very different
profiles in terms of their oral language and literacy development as well as their disabilities.
One student might have very strong speaking skills, while another might excel at reading.
Because a high score in one language domain can inflate a composite score, a student’s
individual performance in each domain is more informative than a single composite score.
Only students who complete all four domains receive all four composite scores. If a student does not
complete a particular domain, scores for that domain and any associated composite scores will be
missing from the student’s score report.
The letters NA appear on the Individual Student score report when information recorded on a test
booklet or entered in WIDA AMS specifies that a particular domain test should not be scored. When
NA appears for an individual language domain, NA also appears for each composite score calculated
using that domain, including the Overall score. For example, when a Do Not Score code is marked for
the Reading domain, NA appears for the Reading, Literacy, Comprehension, and Overall scores.
Spaces are blank when a test booklet is returned without any evidence that the student engaged with
the content of an entire domain test. In other words, the space for a language domain score is blank
when no response to any item in that domain test is marked in the test booklet.
Listening and Reading Scores
At the bottom of the first page of the Individual Student Report, a table shows detail about the
number of Listening and Reading items that the student answered correctly. These raw scores are not
the same as the scale scores reported above.
5The raw scores provide context for the scale scores in that they are a good indicator of how much
support the student needed to provide answers. In general, the amount of support a student needs to
complete tasks on Alternate ACCESS for ELLs should be reflective of the amount of support that
student needs to engage in classroom instruction or other assessments. If raw score data indicate the
student needed significantly more or less support than anticipated to engage with Alternate ACCESS
for ELLs testing, a reassessment of the student’s current support services might be appropriate.
The scripted cueing system for the Reading and Listening domain tests provides students up to
four opportunities to complete each task successfully. For Cue A, the test administrator delivers
the initial prompt and question. If needed, Cue A is repeated. For Cue B, the test administrator
delivers a simplified version of the initial prompt. For Cue C, the test administrator delivers a
simplified version of the prompt, provides an answer to the question, and asks the question
again. This test design offers students supported opportunities to demonstrate their developing
English language proficiency without the presentation of overly difficult items.
Keep in mind that only scale scores show student progress over time, and only scale scores can be
used to compare one student’s performance to another’s. Scale scores reflect the fact that a student
who answers correctly at Cue A demonstrates a higher level of proficiency than a student who
answers correctly at Cue C.
Interpreting Student Scores
• Alternate ACCESS for ELLs scores provide information on students’ English proficiency. They
do not measure students’ academic achievement or content knowledge, and they do not
provide information about a student’s disability.
• The Alternate ACCESS for ELLs assessment and score reports are not designed or intended
to provide any meaningful information about an individual educator’s skills or performance.
School- and district-wide trends are more meaningful as a means to evaluate long-term
program impacts than as a method to evaluate any one individual or draw conclusions about
any particular small group of students.
• WIDA recommends using Alternate ACCESS for ELLs scores as one of multiple pieces of
information that inform high-stakes reclassification or exit decisions. Schoolwork, in-class
assessments, and IEP team input are all valuable evidence that can help you understand a
student’s English language proficiency and development.
State education agencies set reclassification policies, which include determining exit criteria
and establishing guidelines for the use of Alternate ACCESS for ELLs scores.
6Understanding Student Growth
Both proficiency levels and scale scores can help you understand student growth year over year.
Proficiency levels are a practical way to understand students’ skills, while scale scores offer more
nuance about how much a student’s language use and control is changing. As you review Alternate
ACCESS for ELLs scores and consider student growth, keep the following information in mind:
• A student’s foundation in a home or primary language is a good predictor of English language
development. For example, a student with a strong literacy background in a home language is
likely to acquire literacy in English at a quicker pace than a student with lower levels of home
language literacy.
• The pace of language development is different for each individual. It is common for younger
students and those at beginner proficiency levels to make progress more quickly than older
students and those at more advanced proficiency levels.
• Students rarely acquire proficiency across domains at the same pace. Often, oral language
skills (listening and speaking) develop faster than literacy skills (reading and writing). At the
same time, receptive language skills (listening and reading) often develop faster than
productive language skills (speaking and writing). Every student’s growth is different, but it’s
not unusual that students need longer to develop skills in Writing than in any other domain.
Multiple consecutive years of data are
necessary to analyze student growth.
Consider 2021 scores carefully.
Consider the first year a student takes
Alternate ACCESS for ELLs as an Many students experienced an unusual 2020–2021
opportunity to establish a baseline of school year due to COVID-19. While the test and
test performance. Results from the the meaning of scores remain the same, many
second year can show growth, and variables could impact how this year’s scores relate
only with three years or more of test to previous and subsequent scores. For example,
results can you see trends in the testing schedules and remote learning might affect
student’s language development. scores in ways WIDA can’t yet analyze.
Group Scores
Student Roster Report
The Student Roster Report contains information on a group of students within a single school and
grade. Like the Individual Student Report, the Student Roster Report provides scale scores and
proficiency levels for individual language domains and composite areas for each student, giving
teachers, administrators, and program coordinators and directors an overview of their students’
English language skills and a place to look for patterns in student performance.
7Use the Student Roster Report…
… to identify patterns in student performance. Consult with colleagues about factors that
might explain similarities and differences in how various groups of students perform.
… to verify that student scores reflect reasonable expectations. For example, you can
expect that students new to an English language school context or who have had
limited or interrupted formal schooling will be at the lower end of the scale. For
students with particularly high scores, consider whether their classroom engagement
and schoolwork support this indicator that they might be ready to exit language
support programs.
… to group students for instructional planning or classroom support purposes.
… to develop school and district improvement plans or educator professional
development
opportunities Individual Student Report
that target the Student Roster Report
Proficiency levels
areas in which
Scale scores Proficiency levels
students are
Confidence bands Scale scores
struggling.
Proficiency level descriptors Multiple students' results
Frequency Reports
Frequency reports provide a snapshot of a particular student population. Available for individual
schools, districts, and states, these reports show the number and percentage of students in each
grade to attain each proficiency level. In addition, the reports provide the highest and lowest scale
scores attained in each of the four language domains. (The individual students who earned these high
and low scores are not identified.)
Skills at proficiency level P3—Developing are measured only
in the Writing domain on Alternate ACCESS for ELLs, so no
information appears in the P3 cells of the Listening, Speaking,
and Reading columns.
Administrators, program coordinators and directors, and boards of education can review frequency
reports as they plan the type and amount of English language support services their schools, districts,
or states will offer. In combination with educator input and the results of content assessments,
frequency reports can help high-level decision and policy makers compare the progress and success
of ELL students to that of former ELLs and their English-proficient peers.
8Frequency reports do not show the performance of individual students. Instead, they show the
performance of a group of students using both real numbers of test-takers and percentages of the
total test-taker population. Be sure to use both of these numbers as you consider student
performance. Percentages are a useful way to compare populations of different sizes. However, a
small population size can distort percentage results—knowing that 100% of students achieved a
particular proficiency level isn’t all that meaningful if the population size is 1.
As with all student achievement reports, keep in mind that context is crucial. When you share
frequency reports with decision makers, also provide information about the student population, such
as the percentage of students with IEPs or 504 Plans and the variety of backgrounds students bring to
your school, district, or state in terms of languages, cultures, and experiences. The frequency report
itself cannot explain why students are distributed as they are among the proficiency levels. For
example, it’s not unusual for a school with many new students or a particularly mobile or linguistically
diverse population to have more students at beginning proficiency levels than another school with an
equally strong English language support program but a more stable and homogeneous student
population.
What next? Now that you’re an expert in student score reports, revisit the Understanding
Alternate ACCESS for ELLs Scores section of this document for resources that can help you
connect test scores to classroom practices!
9Alternate Proficiency Level Descriptors (Grades 1–12)
At each grade level, toward the end of a given alternate level of English
language proficiency, and with instructional support...
English language learners with
English language learners with significant
Level significant cognitive disabilities will
cognitive disabilities will produce:
process:
• Specific content language, including
Students may score up to alternate
cognates and expressions
proficiency level P3 in the domain of
• Words or expressions with multiple
Writing. The domains of Listening,
P3 Developing
meanings used across content areas
Speaking, and Reading do not include
• Repetitive grammatical structures with
test items targeting alternate
occasional variation
proficiency level P3 and above;
• Sentence patterns across content areas
therefore, students taking this test
• Short and some expanded sentences with
cannot demonstrate English language
emerging complexity
at alternate proficiency level P3 and
• Expanded expression of one idea or
higher in those domains.
emerging expression of multiple ideas
• General content words and
expressions, including cognates
• General content words and expressions
• Social and instructional words
across content areas
and expressions across content
• Social and instructional words and
P2 Emerging
areas
expressions across content areas
• Compound grammatical
• Formulaic grammatical structures
constructions
• Repetitive phrasal and sentence patterns
• Repetitive phrasal and sentence
across content areas
patterns across content areas
• Phrases or short sentences
• Multiple related simple
• Emerging expression of ideas
statements
• An idea with details
• General content-related words
• General content-related words
• Social and instructional words
• Everyday social and instructional words
and expressions
and expressions
P1 Entering
• Simple grammatical constructions
• Phrase-level grammatical structures
• Common social and instructional
• Phrasal patterns associated with common
forms and patterns
social and instructional situations
• Single statements or questions
• Words, phrases, or chunks of language
• An idea within words, phrases, or
• Single words used to represent ideas
chunks of language
...within sociocultural contexts for language use.
© 2021 Board of Regents of the University of Wisconsin System, on behalf of WIDA. Last revised 3/1/21Alternate Proficiency Level Descriptors (Grades 1–12)
At each grade level, toward the end of a given alternate level of English
language proficiency, and with instructional support...
English language learners with
English language learners with significant
Level significant cognitive disabilities will
cognitive disabilities will produce:
process:
• Familiar words associated with daily • Symbols, letters, and/or
routine numbers
• Representations of sounds, words, or • Spoken social and instructional
ideas withdrawing symbols, letters, or words and familiar expressions
numbers • Routinely practiced social and
A3
• Routinely practiced patterns instructional forms and patterns
Engaging
associated with common social and • Familiar statements or questions
instructional situations associated with daily routine
• Oral approximations of words or • An idea within visual
phrases representations or familiar
• Symbols or letters to represent ideas language
• Different sounds and gestures to
communicate • Routinely practiced oral cues
• Markings or symbols to communicate • Familiar visual representations
(e.g., with writing utensil or assistive associated with daily routines
A2 device) • Environmental symbols and
Exploring • Approximations of routinely practiced shapes
words • Spoken words associated with
• Varied tone and inflection to convey familiar people, daily routine,
needs, desires, or moods (to convey and/or environment
adherence to social norms)
• Imitations of sounds • Familiar voices and
A1 • Varied body movements to communicative sounds
Initiating communicate (e.g., eye gaze, grasp • Change in expression (e.g.,
writing utensil) facial, body, vocal)
...within sociocultural contexts for language use.
© 2021 Board of Regents of the University of Wisconsin System, on behalf of WIDA. Last revised 3/1/21Reading the Alternate ACCESS for ELLs Individual Student Report
Student
information
Proficiency level score Makes performance comparable across domains
Domain scores
Scale score
Tracks
growth
over time
Composite
within a
scores
Confidence band domain
Shows a range
of potential
performance
outcomes
Raw scores Indicate how much support the student needed to provide answers
© 2021 Board of Regents of the University of Wisconsin System, on behalf of WIDA. Last revised 3/1/21You can also read


