SmartphoneS Customer experienCe: Variance due to - November, 2018 - Broadband India Forum
←
→
Page content transcription
If your browser does not render page correctly, please read the page content below

November, 2018

                                        Customer
                                       Experience:
                        Variance due to
                 Smartphones
                  The report captures details of the variance
                    in customer experience across different
                                                smartphones

Contents
01   INTRODUCTION      03

 02 CUSTOMER METRICS   06

     03 IMPLICATIONS    08

      04 METHODOLOGY        09

        05 ABOUT US          10

         06 APPENDIX             11

                                      3
INTRODUCTION      CUSTOMER METRICS              IMPLICATIONS                    METHODOLOGY                          ABOUT US                      APPENDIX
 & SUMMARY

       01                             INTRODUCTION
      Study shows that a 10% increase in mobile internet traffic, contributes to a 0.7% increase
        in GDP on an average across countries. However, in case of India the impact is nearly
      double. Every 1 0% increase in mobile internet traffic in India contributes to a handsome
         gain of 1.3% on the GDP. It is said that growth in Internet would add up to USD 537.4
                          billion to India’s GOP by 2020J1l, (Source: ICRIER).

      Explosive 4G adoption has shown strong appetite                       Smartphone availability across different price ranges
      that Indian consumers have towards mobile                             has been a key factor enabling this level of adoption
      internet. The growth potential of 5G will be                          in our market. Some of the top consumer purchase
      restricted to the imaginative power of players of                     decision-making parameters for smartphones are as
      the ecosystem.                                                        follows[3l:

      Govt. of India has done its fair bit through                          • Price
      initiatives like Digital India and Make in India. 5G                  • Camera
      roll out will further accelerate adoption of ·always                  • Screen Size
      on networks, where smartphones, smartwatches,
                                                                            • Memory and
      smart wearables and other lOT devices are
      always connected to the network and powered by                        • Battery Life
      Artificial Intelligence (AI) and Machine Learning
      (ML). Investments in 5G infrastructure have                           Yet, one critical component- device impact on
      started in right earnest and most observers would                     experience and performance of a network is seldom
      concur that India will be among the earliest mass                     considered. Most consumers are completely
      embracer of this technology.                                          unaware of the fact that device and network
                                                                            performances are interlinked, and not all devices will
      Democratization of data through mass usage of                         deliver at the same level of efficacy under similar
      smart phones has been a principal factor driving                      network conditions. Each smartphone model applies
      accelerated growth in monthly data usage across                       different algorithms in network decision making,
      India - a figure that has multiplied over 15x in over                 resulting in performance deviations - while within
      last 3 years (from 2015-18).                                          limited ranges for major players, there are many
                                                                            models that have variance bands of >30% for data.
      Incremental to the industry disruption enabled by
      large scale operator -led telecom infrastructure                      In a first of its kind study, this paper outlines
      investments, content consumption increases have                       the tests conducted across smartphones under
      also been fueled by affordability and availability                    similar network conditions and shows the variance
      of smartphone devices, and flexible mobile                            ranges across models in India. All popular mobile
      payment options. Consequently today, with such                        models accounting for more than 45% share of the
      ease of mass access, user behavior has begun to                       Indian market have been chosen for the study. The
      demonstrate a heavy preference for video content,                     results of the study for a country like India which
      which contributes to nearly 87% of the data traffic                   is readying-up for massive 5G investments have
      explosion[2l.                                                         been an eye opener.

4                             Confidential: The report is strictly confidential. Under no circumstances should this report, or information contained therein
                                 be distributed, reprinted or reproduced 1n any form Without the written consent of PhiMetrics Technologies Pvt Ltd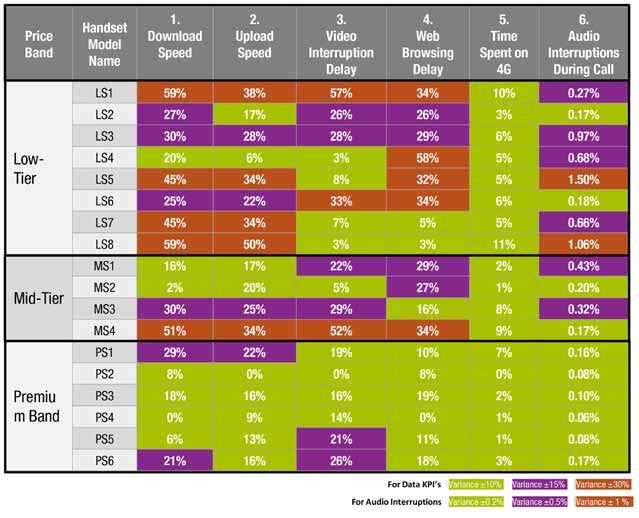
INTRODUCTION       CUSTOMER METRICS         IMPLICATIONS          METHODOLOGY              ABOUT US            APPENDIX
 & SUMMARY

   SUMMARY OF REPORT
   Average variance range due to Smartphones
   PhiMetrics Study shows Customer Experience Variance Band of smartphones
   in India is much higher compared to Global Variance Bands (GVB):

                             GLOBAL :           ± 10%                                     GLOBAL :          ± 0.2%
       VB (Data)             INDIA :            ± 27%              VB (Voice)             INDIA : ±         0.5%

   While variances across devices occur globally, in case of India they are in a much wider band.

   The key reason for the variance band being wider in India is due to the fact that models sold in India which
   constitute a large portion of market share differ from their Global peers (in the US, UK and EU).
   ■■ Global top models which mainly accounts for premium band phones constitute for less than 5% of models sold
      in India. Wide discrepancy in the variances is due to the types of models sold in India compared to global peers.

   Models are chosen by price bands for this study: (Premium price band >INR 25K, Mid-Tier band between
   10K and 15K INR and Low-Tier band
Variance Band Weighted (VBW) by market share for smartphone models in
    global market v/s India market:

    VBW Indices (± 30% for data & ± 1% for voice) are much higher for India compared
    to Global.
    ■■ For Global centric brands the variance is 9% for data & 1% for voice, whereas for India centric brands, the
       variance is 39% for data and 9% for voice.

    Variance by smartphone models in India market across different price bands:

    High variances (± 30% for data & ± 1% for voice) are seen across the Low-Tier and Mid-Tier price band devices
    for data, Low-Tier price band devices for voice.

    Since we have tested only the top selling devices across categories, the variance impact is likely to be much
    higher when all devices are considered.

    A country variance in the ±27% range for data & ± 0.5% range for voice suggests serious implications on overall
    customer experience.

    While devices have complexities like category#, carrier aggregation, frequency band and others, to explain some
    of the inconsistencies, even devices with similar features vary greatly. Ironically, such features (or lack thereof)
    do not provide any clarity to the customer about the impact the device has on ‘overall experience’.

6                               Confidential: The report is strictly confidential. Under no circumstances should this report, or information contained therein
                                   be distributed, reprinted or reproduced 1n any form Without the written consent of PhiMetrics Technologies Pvt Ltd
INTRODUCTION &    CUSTOMER METRICS       IMPLICATIONS         METHODOLOGY            ABOUT US              APPENDIX
   SUMMARY

                                 CUSTOMER EXPERIENCE
        02                       VARIANCE: SUMMARY
   In this report, we have taken five Key Customer Experience Indicators (CEI’s) for assessing data and Voice
   services and variances across devices is measured on each of these parameters.

       1. Download Speed                                  4. Web Browsing Delay
       2. Upload Speed                                    5. Interruptions during Audio Call
       3. Video Interruption Delay

   Summary Data Services:
   ■■ Almost 39% of India’ top selling models have variance bands as high as ± 30%, thus impacting customer
      experience significantly.
   ■■ In most cases, such variance bands are observed in devices across the Low-Tier to Mid-Tier price ranges
      (details in the following section).
   ■■ No handset from Premium ranges vary beyond the 15%. In fact, majority of these handsets are in ±10% range.
      Thus, these handsets do not negatively impact the customer experience greatly.
   ■■ However, devices in Low-Tier & Mid-Tier price ranges with high market share have shown variances in the
      ±30% band across most GEls.

   Note:
   Tests were conducted using 4G devices in the “free” mode. All devices were found to be in 4G mode for
   >-95% of the time.

   Summary Voice Services:
   ■■ ~10% of India’ top selling models vary in bands as much as 0.8%, thus impact on voice customer experience
      is significant. The variances are mainly observed in Low-Tier price band devices.
   ■■ No handset from the Premium price band varies beyond VB (Global) of 0.2%. Thus, these handsets do not
      negatively impact the customer experience.

                                                                                                                      7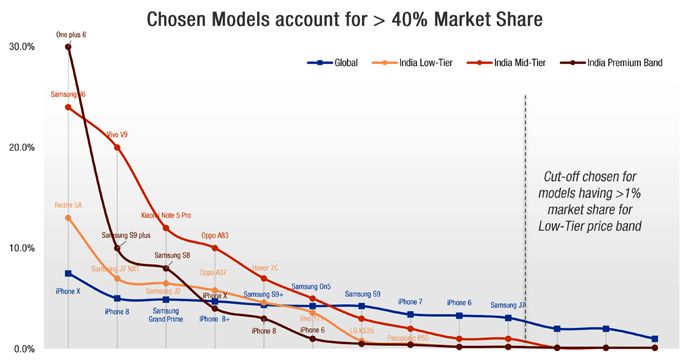
Below are the VBs across the different customer CEIs:

    01 Download Speed Variance: VBW is 26%                                     02 Upload Speed Variance: VBW is 25%

    03 Video Interruption Delay Variance: VBW is 25%                           04 Web Browsing Delay Variance: VBW is 30%

    05 Audio Interruptions During Call: VBW is 0.5%

8                          Confidential: The report is strictly confidential. Under no circumstances should this report, or information contained therein
                              be distributed, reprinted or reproduced 1n any form Without the written consent of PhiMetrics Technologies Pvt Ltd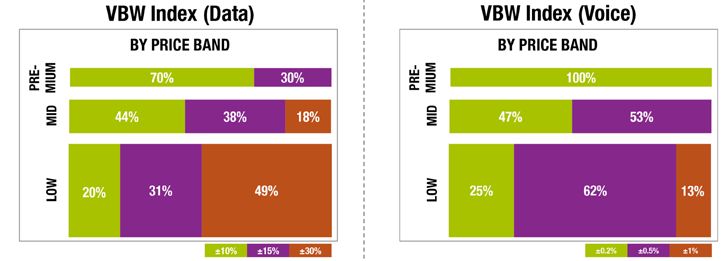
INTRODUCTION &
   SUMMARY          CUSTOMER METRICS       IMPLICATIONS         METHODOLOGY           ABOUT US           APPENDIX

         03                        IMPLICATIONS
   Different smartphones have high variances in their performance. These variations not only impact the experience
   of the owner but also that of other customers in the ecosystem. Variance bands in the ±27% range for data
   (against global averages of ±10-15%) are clearly unacceptable. While variance bands in the ±0.5%range for voice
   seem low, it should be noted that failures in voice tend to be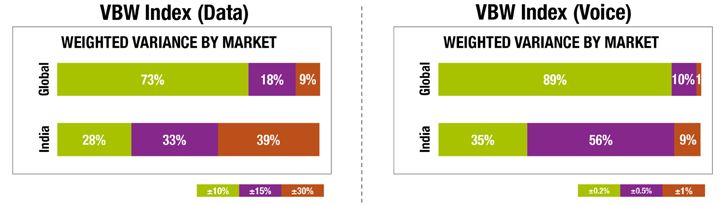
INTRODUCTION &
    SUMMARY          CUSTOMER METRICS               IMPLICATIONS                  METHODOLOGY                          ABOUT US                      APPENDIX

                                      METHODOLOGY -
          04                          SUMMARY
     In this section we share the highlights of the methodology adopted for undertaking the tests and the analysis of
     the same. Indian numbers are compared to Global peers.

          Global Level                                                                      India Specific
             10 Devices measured,                                                      18 Devices measured,
                   >45% of market                                                      >50% of market
         iPhone X, iPhone 8 plus; iPhone 8, iPhone 7,                                  Below is the list of 18 devices measured &
           iPhone 6; Samsung S9 plus, Samsung S9;                                      market share by price band for devices -
           Samsung J7, Samsung On5 and Samsung
                                                                                       Premium (55% market share): iPhone X, iPhone
                           Galaxy Grand Prime Plus
                                                                                       8, iPhone6, One plus 6, Samsung S9 plus,
                                                                                       Samsung S8;
       Apple Samsung and Huawei alone account for
                      50% of market share Globally                                     Mid-Tier (68% market share): Samsung J6,
                                                                                       Xiaomi Note 5 Pro, Vivo V9, Oppo A83;
                                                                                       Low-Tier (42% market share): Samsung J7 NXT,
                                                                                       Samsung J2 Pro, Xiaomi Redmi 5A, Vivo Y71,
                                 > 30 Countries                                        Honor 7C, Oppo A37, LG K535, Panasonic P55
      Handset variance of top 10 global models were
       analyzed across multiple countries of Europe,
                     Middle East and Asian markets
                                                                                       ~3300 hours tested
                                                                                       across 12 cities
                                                                                       Diagnostic tests were performed in
                   >1 Mn Data Points daily                                             n Top 12 Indian cities
                    over 12 months period                                              n at 15 unique cluster types, with
         Crowdsource data with more than 1 Mn data                                     n	approximate 3300 hours of cumulative
       points collected on daily basis over a period of                                   rigorous testing.
      12 months were used for handset performance
     analysis across different markets for verification
                                                                                       5 Key Indicators
                                                                                       Various metrics which impinge the overall
                                                                                       customer experience for data & voice services
                                                                                       were summarized to 5 KPI’s:
                                                                                       1.    Download Speed,
                                                                                       2.    Upload Speed,
                                                                                       3.    Video Interruption Delay,
                                                                                       4.    Web Browsing Delay,
                                                                                       5.    Interruptions During Audio Call

10                              Confidential: The report is strictly confidential. Under no circumstances should this report, or information contained therein
                                   be distributed, reprinted or reproduced 1n any form Without the written consent of PhiMetrics Technologies Pvt Ltd
INTRODUCTION & CUSTOMER METRICS IMPLICATIONS METHODOLOGY APPENDIX
SUMMARY ABOUT US
05 About us
PhiMetrics Technologies Pvt. Ltd. is a company specializing in Radio
Domain in Telecom, Analytics & Advisory Services. It has 9+ years of
vast telecom experience.
PhiMetrics’ solutions are a result of its deep and intensive telecom
domain knowledge. Whether you are a Telecom Regulator, a Network
operator, a Vendor or a Service provider, PhiMetrics can help you deliver
more value to your end-customers.
PhiMetrics – largest independent telecom audit and analytics player in
India. Operates across emerging markets in Asia, MEA and the Caribbean.
QOSBEE – an Indo-French JV between PhiMetrics and QoSi (4G Mark)
to provide only global QoE platform – used by operators, regulators,
consumers, enterprises & OTT’s.
QOSBEE’ app gives end customer a comparative view of Telco, Device
and OTT app best suited for its use.
QoSi (PhiMetrics Partners) is the leading specialist in France for measuring
QoE/QoS in telecoms networks as well as the market leader in mobile
customer knowledge and crowdsourcing. It has 15 years of experience and
works with numerous operators, manufacturers, and media around the globe.
Since methods and measurement tools on the one hand and equipment
and usage on the other are undergoing significant change, QoSi developed
a strategy to the integrate innovative and disruptive solutions in their
offers with 4G Mark.
QoSi mainly operates in Western Europe and French Speaking African
Countries.
11INTRODUCTION &
SUMMARY CUSTOMER METRICS IMPLICATIONS METHODOLOGY ABOUT US APPENDIX
APPENDIX - I
06 customer experience variance:
(by handsets)
Detailed variances for each of the handset model is provided in the table below
for every KPI:
1. Download Speed: Variance in Premium band ranges upto 30% whereas in Low-Tier and Mid-Tier band ranges
from 2% to 59%.
2. Upload Speed: Variance in Premium band ranges upto 22%, in Mid-Tier ranges from 17% to 34% whereas
Low-Tier band ranges from 6% to 53%.
3. Video Interruption Delay: Variance in Premium band ranges upto 26% whereas in Low-Tier and Mid-Tier band
ranges from 3% to 59%.
4. Web Browsing Delay: Variance in Premium band ranges upto 21%, in Mid-Tier band ranges from 16% to 34%
whereas Low-Tier band ranges from 3% to 58%.
5. Time Spent on 4G: Variance in all price band is with ±10%.
6. Audio Interruptions During Call: Variance in Premium band is within ±0.2%, in Mid-Tier band ranges from
±0.27% to ±0.97% whereas Low-Tier band ranges from ±1.06 to ±1.0%.
12 Confidential: The report is strictly confidential. Under no circumstances should this report, or information contained therein
be distributed, reprinted or reproduced 1n any form Without the written consent of PhiMetrics Technologies Pvt LtdAPPENDIX II - Methodology
The approach is broken into three parts: India Devices:
A. Components: which involves selection of Indian market is divided into different price bands:
1. Data Sources The handset models were chosen, to best represent
2. Device their respective price bands in terms of most market
3. Test Bed share.
B. Measurement • Premium Band (>25K) - 5%[5]
C. Analysis Below-mentioned models account for 56%[5] market
share in the Premium band price range
A. Component Selection:
1. Data Sources Premium (>25K) Models Market Share[5]
The Device Performance Report is prepared by in One Plus 6 30%
depth study of various data sources, providing
iPhone X 8%
insights on the key consumer metrics vis-à-
vis devices. The report’s findings are based on iPhone 8 iPhone 6
following sources: Samsung S9 plus
18%
I. I nternal Data: Collected from the Samsung S8
diagnostic tests performed by testing
engineers
II. Anonymized crowdsource data • Mid-Tier (10K to 25K) - 25%[5]
III. External reports Below-mentioned models account for 68%[7] market
share in the Mid-Tier price range.
2. Device Selection: Mid End (10K to 25K) Market Share [6]
Most popular devices holding the major portion of Models
the markets share were taken into consideration. Xiaomi Redmi Note 5 24%
2 sets of devices were used for measurements. Pro
Global Devices (models having majority market
Samsung Galaxy J6 20%
share globally) and India Market Devices (models
in India having the most market share in their Vivo V9 12%
respective price band) Oppo A83 12%
Global Devices: Below-mentioned models account
for 43%[4] market share of the globally shipped
smartphones for top 3 brands (Apple, Samsung and • Low-Tier (< 10K) - 70%[5]
Huawei). Below-mentioned models account for 41%[8] market
share in the Low-Tier price range.
Model Name Global Market Share
Low End (APPENDIX II - Methodology (cont’d)
3. Test Bed (QOSBEE platform): C. Analysis:
India is divided into ~5.2 million hexagons of
500*500 meter. The entire geography can be Analysis was carried out to evaluate the variance
represented by 15 unique cluster types and exhibit across each smartphone (for Global and India
the same phenomena across each city. specific devices) against the baseline for each
KPI. The analysis was carried out using the
Clinical tests were carried out at such 15 unique crowdsourcing data and clinical tests performed
clusters types in each of the Top 12 cities under by testing engineers.
test. Multiple tests amounting to ~3300 hours
(cumulative) of rigorous testing were carried out • Global Analysis: This analysis was performed
for the selected devices at different locations. on the models pertaining to global devices.
Data points across each country and KPI from
The results were vetted against >100Mn of data crowdsource database was examined and
samples of every KPI collected on QOSBEE platform analyzed to arrive at the variance, exhibited
for verification purposes. by each of the Top 10 models in each of the
country. The overall variance was calculated by
assigning equal weightages to the variances of
B. Measurement: each KPI’s.
The variations of the individual devices were • India Analysis: Diagnostic tests were performed
aggregated against the best performing median for each of the devices shown under different
scores, for each of the experience metrics tested. network conditions as described in the Test
Individual device variations thus measured, were Bed section. Variance trends were verified
aggregated as a proportion of their relative market against the 1M+ daily data points collected on
shares; in order to arrive at an average variance. the QosBee platform.
14 Confidential: The report is strictly confidential. Under no circumstances should this report, or information contained therein
be distributed, reprinted or reproduced 1n any form Without the written consent of PhiMetrics Technologies Pvt LtdAPPENDIX III
Impact Analysis
Below is the detailed calculation shown for Overall Impact on the mobile performance metrics :
1. Market Size in 2020 by Category
Voice
1. Minutes of Usage (MOU) per subscriber per month & subscribers’ details
Quarter 1 (Q1, January-March 2018) [11]
• GSM Full Mobility Service including LTE: 584 MOU per subscriber per month
• COMA Full Mobility Service: 61 MOU per subscriber per month
• Total Outgoing Minutes of Usage for Internet Telephony: 258 Million
• GSM Subscribers: 1,179.12 Million
• Wireless Subscribers Total Wireless Subscribers: 1,183.41 Million
Quarter 2 (Q2. April -June 2018) [12]
• GSM Full Mobility Service including LTE: 608 MOU per subscriber per month
• COMA Full Mobility Service: 19 MOU per subscriber per month
• Total Outgoing Minutes of Usage for Internet Telephony: 188.78 Million
• GSM Subscribers: 1,143.48 Million
• Wireless Subscribers Total Wireless Subscribers: 1,146.49 Million
2. Voice market size calculations:
• In Q1, GSM MOU * GSM subscribers = 1.18M*584 min = 690M minutes per month = 8.25B
minutes/year
• In Q1, GSM MOU * GSM subscribers = 1.18M*584 min = 690M minutes per month = 8.25B
minutes/year
• Therefore, total Minutes of usage (including LTE) is taken at a constant of 700M minutes per
month in 2020 = 8.48 minutes/year
Data:
1. Data consumption & growth : 2.4PB in 2016 with 144% Y-0-Y growth[10]
2. Total Data consumption by 2020: 7.2 PB
3. Data consumption category ratio[10]
• Video: (70%)
• Browsing: (16%)
• Download & Upload: (14%)*
*Assumption: 10% Download and 4% Upload
4. Data consumption category ratio[10]
• Video: 5.0 PB
• Browsing: 5.0 PB
• Download: 0.7 PB
• Upload: 0.3 PB
15APPENDIX III
Impact Analysis (cont’d)
2. Negative Impact Ratio by Category [Refer Appendix IV for calculations]
• Video Interruption Delay: -1.4%
• Web Browsing Delay: -30.1%
• Download Speed: -33.8%
• Upload Speed: -29.3%
• Interruptions During Audio Call: -0.8%
3. Impact of each category (Market Size of each category* Negative Impact Ratio)
• Video: 0.07 PB
• Browsing: 0.35 PB
• Download: 0.24 PB
• Upload: 0.08 PB
• Voice Call: 0.07 B mins
Total Impact on Data (TID): 0.74 PB
Total Impact on Voice (TIV): 0.07 B mins
4. Negative Impact Ratio by Category [Refer Appendix IV for calculations]
((TID / Total Data Market Size)+ (TIV / Total Voice Market Size))* 100 = 11%
5. Potential Loss to Internet Economy:
(Efficiency Loss* App Contribution to GDP) = (11% * $270 B[9]) = $30 Billion
16 Confidential: The report is strictly confidential. Under no circumstances should this report, or information contained therein
be distributed, reprinted or reproduced 1n any form Without the written consent of PhiMetrics Technologies Pvt LtdAPPENDIX IV - Glossary
Abbreviations
❍❍ IOT Internet of Things
❍❍ AI Artificial Intelligence
❍❍ VB Variance Band
❍❍ VBW Variance Band Weighted
❍❍ CEI’s Customer Experience Indicators
❍❍ LTE Long Term Evolution
❍❍ PB Peta Bytes (1 PB = 1000 Tera Bytes)
Definitions
❍❍ D
ownload Speed: Time taken for an amount of data to be transferred successfully in the
downlink direction from Point A to Point B, where both the points are connected to the Internet.
❍❍ U
pload Speed: Time taken for an amount of data to be transferred successfully in the uplink
direction from Point A to Point B, where both the points are connected to the Internet.
❍❍ V
ideo Interruption Time: Summation of the total delay encountered from video start to end (This
includes video play start time and also the interruptions which occurs during the video play).
❍❍ Web Browsing Delay: Time taken for the complete web page to download successfully.
❍❍ Interruptions During Audio Call: Summation of total voice impairments encountered during a
voice call.
❍❍ V
ariance Band: Amount of dispersion of customer experience variance performance from the
best performing smartphone.
❍❍ V
ariance Band Weighted: Variance Band which is weighted by market share of smartphones
which are included in the study Negative Impact Ratio
• or Download Speed. Upload Speed & Web Browsing Delay
F
1-Performance of Inconsistent Devices I Acceptable Devices
• or Video Interruption Delay
F
(Average Performance of Inconsistent Devices-Acceptable Devices)/ Video Duration
• or Interruptions During Audio Call
F
(Average Performance of Inconsistent Devices-Acceptable Devices)/ Audio Call Duration
17APPENDIX V - REFERENCES
1. Estimating eValue of Internet based Applications
❍ http:icrier.org/pdf/Estimating_eValue_of_lnternet%20Based%20Applications.pdf
2. Indians Gorging on Mobile Data Usage
❍ https://timesofindia.indiatimes.com/business/india-business/indians-gorging-on-mobile-data-
usage-goes-up-15-times-in-3-yrs/articleshow/64432913.cms
3. Top consumer purchase decision-making parameters
❍ www.gadgetsnow.com
4. World’s Best-Selling Smartphone
❍ https://www.forbes.com/sites/jeanbaptiste/2018/06/13/the-iphone-x-was-the-worlds-best-selling-
smartphone-in-q1-2018/#5a9478c87d2f
5. Price Band Market Share in India
❍ https://economictimes.indiatimes.com/tech/hardware/xiaomi-samsung-are-fighting-
it-out-in-the-rs-10000-rs-25000-smartphones-range/articleshow/64442506.cms?utm
source=contentofinterest&utm medium=text&utm campaign=cppst
6. Premium Band Market Share
❍ https://venturebeat.com/2018/09/01/chinese-smartphone-makers-are-winning-in-india-the-
fastest-growing-market/
❍ https://www.idc.com/getdoc.jsp?containerld=prAP44210918
❍ h
ttps://indianexpress.com/article/technology/mobile-tabs/how-oneplus-has-become-the-king-of-
indians-premium-smartphone-market-above-apple-samsung-5284322/
❍ h
ttps://www.indiatoday.in/technology/news/story/oneplus-6-sales-make-oneplus-top-brand-in-
indian-premium-phonemarket-it-now-has-40-per-cent-share-1301198-2018-07 -31
7. Mid-Tier Market Share
❍ https://www.counterpointresearch.com/samsung-topples-xiaomi-regain-number-one-position-
india-q2-2018/
❍ https://www.idc.com/getdoc.jsp?containerld-prAP44210918
8. Low-Tier Market Share
❍ https://www.counterpointresearch.com/samsunq-topples-xiaomi-regain-number-one-position-
india-q2-2018/
❍ https://www.jdc.com/getdoc.jsp?containerld-prAP4421 0918
❍ h
ttps://indianexpress.com/article/technoloqy/mobile-tabs/samsung-xiaomi-eacb-shipped-9-9-
million-smartphones-in-india-in-q2-2018-canalys-5266433/
9. Contribution of 5G to GDP
❍ https·//economictimes.indiatimes.com/economy/policy/indja-on-track-for-5g-need-to-develop-
ecosystem-manojsinha/articleshow/59600578.cms
10. India Overall Usage by Category
❍ https://networks.nokia.com/in/mbit-index
11. The Indian Telecom Services Performance Indicators (January- March 2018)
❍ https://trai.gov.in/sites/default/files/PIReport270620180.pdf
12. The Indian Telecom Services Performance Indicators (April - June 2018)
❍ https://trai.gov.in/sites/default/files/PIRJune03102018 pdf
18 Confidential: The report is strictly confidential. Under no circumstances should this report, or information contained therein
be distributed, reprinted or reproduced 1n any form Without the written consent of PhiMetrics Technologies Pvt LtdPublisher:
PhiMetrics Technologies Private Limited
410-411, Shrikant Chambers,
Next to R.K.Studios, Sion Trombay Road,
Chembur (E) – Mumbai, 400071
Copyright & Disclaimer: All contents in this report are the sole property of PhiMetrics Technologies Pvt. Ltd. Any reproduction or distribut1on of the report
(or part thereof) would require written consent of PhiMetrics Technologies. Sources used for information contained in the research are explicitly cited in Appendix
III of this document. PhiMetrics does not take any responsibility for the information provided by these sources.
Additionally, this exercise has been conducted by PhiMetrics independently without any commercial consideration nor has been commissioned by any entity.
This report is only intended to highlight variances exist across smartphones under similar network conditions and their impact on the Indian consumer. It is not
intended to compare performances of the different devices nor does it attest to the capabilities of these devices. Any purpose for use of this report other than
our stated intention, would not constitute any liability on our part.
Although efforts are made to keep this report’s contents accurate and up to date, much of the material on it could be subject to change since exact test
conditions cannot be re-simulated. Hence, this report is not, and should not be considered, a certified or definitive source of information that can be relied on
for any purpose. PhiMetrics does not guarantee nor does it accept any legal liability whatsoever arising from, or connected to, the use of any material contained
in this report. In no event will PhiMetrics be liable for any loss or damage arising out of, or related to the use, inability to use, performance or non-performance
of the report and its contents.
By accessing, reading and using this report, you expressly acknowledge that you have read and understood this “Copyright and Disclaimer” section and agree
on behalf of yourself and your organization (if applicable,) to be bound by its terms.You can also read


