Analysis of the influence of environmental change on river runoff in Loess Plateau of China
←
→
Page content transcription
If your browser does not render page correctly, please read the page content below
Hydrological processes and water security in a changing world
Proc. IAHS, 383, 111–119, 2020
https://doi.org/10.5194/piahs-383-111-2020                                                                            Open Access
© Author(s) 2020. This work is distributed under
the Creative Commons Attribution 4.0 License.

           Analysis of the influence of environmental change on
                  river runoff in Loess Plateau of China
                                                  Yong Jing1,2 and Zuhao Zhou1
                    1 China   Institute of Water Resources and Hydropower Research, Beijing, 100038, China
                 2 Hydrology    and Water Resources Survey Bureau of Shaanxi Province, Xi’an, 710068, China
                     Correspondence: Yong Jing (yong.j@126.com) and Zuhao Zhou (zhzh@iwhr.com)

                                                    Published: 16 September 2020

       Abstract. The double interaction between climate change and human activity affects the changes in the envi-
       ronmental conditions of catchment runoff and confluence. Using 1956–2012 57 years of river runoff series data
       of 27 rivers in hilly gully area of Loess Plateau in Shaanxi province 39 hydrological station data, reduction of
       social and economic water consumption, plotting the annual precipitation and annual runoff double cumulative
       curve of annual runoff flow series consistency test, the consistency processing of annual runoff data and the
       quantitative analysis of its influence were also made. The results show that: the consistency of annual runoff data
       sequence of 21 hydrological stations is affected by the change of environmental conditions of runoff generation
       and confluence, and the turning point (year) and the degree of impact can be divided into three situations or three
       periods. One is the 12 station in 2000 after the annual runoff system is small; Two, there are 4 stations before and
       after in 1970, the annual precipitation and annual runoff double cumulative curve is obviously turning point. Be-
       fore the turning point, a series of systems has a large high production period. After turning, it shows that a series
       of systems with low runoff yield caused by the Changes in environmental conditions of runoff and confluence in
       the underlying surface and climate and so on; the three is to have 5 stations occurred both before and after the
       1970 high low flow period of the transition period in 2000, and after the annual runoff series of small low again.

1   Foreword                                                        production and confluence made up of human activities are
                                                                    summarized. The methods of thinking which affect the river
In China, the observed annual runoff of the Yellow River,           runoff (Hui et al., 1993; Jing et al., 2008a, b, d; Jing, 2016;
Haihe River and the Pearl River has decreased sharply, the          Peng, 2016; Wang et al., 2001, 2012; Zhang et al., 2012; Zhu
trend of drought and flood has intensified (Zhang et al.,           et al., 2008) are more consistent : In the long series of hy-
2012), and the research upsurge of climate change and hu-           drological data, the short series of “natural runoff”in the pe-
man activities affecting the runoff variation in the river basin    riod of high yield flow on the underlying surface of the orig-
has lasted for more than 10 years (Hui et al., 1993; Jing et al.,   inal ecology with slight influence on early human activities
2008a–d; Jing, 2016; Peng, 2016; Wang et al., 2001, 2012;           were classified. This requires finding a turning point (year)
Zhang et al., 2012; Zhu et al., 2008).The quantitative study        in the impact of strong human activities; and then using the
of the effects of climate factors and human activities, in par-     “underlying surface of the primordial” high-yielding “natu-
ticular various human activities, on the runoff of rivers un-       ral”runoff data as a “baseline”. The difference between the
doubtedly contributes to the scientific evaluation of increas-      recent runoff data of “current underlying surface” and that
ingly strained water resources and their exploitation and uti-      of low-yield runoff is the comprehensive influence value of
lization, It is of great significance to support social economic    the environmental change of watershed runoff. Finally, on
and political development and the construction of ecological        the basis of data and methods, the climate factors and hu-
civilization.                                                       man activities can be separated from this comprehensive ef-
   The present quantitative analysis of climate factors and the
changes of the environmental conditions of the catchment

Published by Copernicus Publications on behalf of the International Association of Hydrological Sciences.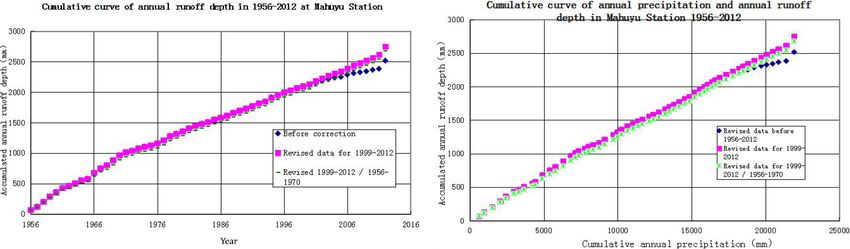
112                                                                         Y. Jing and Z. Zhou: The influence on river runoff.

fect value, and all kinds of factors of the effect of human       confluence in the river basin will result in a turning point
activity can also be analyzed.                                    change of low yield flow under the “current underlying sur-
   Taking the study area of Loess Plateau in the northern part    face”, and make the river runoff decrease.
of Shaanxi Province as an example, the time-series cumula-           Data preprocessing: under the condition that the condition
tive value correlation curve method is used in this paper. This   of the underlying surface of the river basin remains consis-
paper analyzes and proves the great influence of the great        tent, the annual river runoff series should be kept basically
change of environmental conditions on the abortion and con-       consistent after the amount of river water consumed directly
fluence of river path: the “present condition underlying sur-     by human society is “reduced” to the measured amount of
face”of low yield water in the basin has been irreversible to     water measured by the hydrologic station. Before analyzing
the “primordial underlying surface” of its early high yield       and judging whether the consistency of annual river runoff
water. The hydrological data monitored under the condition        series is destroyed by the change of underlying surface, we
of high yield water in the early stage of “original ecological    should carry out the “reduction” of the direct consumption
underlying surface” no longer have the basis of “consistency      of river water by human society by the measured data of hy-
of underlying surface” of “low yield water” in the near fu-       drologic station. As far as possible, the actual annual runoff
ture, and three kinds of influence conditions are analyzed and    of the hydrological section can reflect the “true value” of the
summarized. In this paper, three kinds of correction meth-        current year’s runoff yield and confluence of the watershed,
ods of the “consistency” of the current underlying surface are    that is, the “reduction calculation” of the “true value” of the
proposed for the source of the data. On this basis, the com-      measured annual runoff in the current year. The “reduction
prehensive influence of environmental change on river runoff      calculation” adopts the method of investigation and analysis
is analyzed quantitatively.                                       of agricultural irrigation, industry, urban and rural life, reser-
   The research area is the central part of China’s Loess         voir water storage variables and the amount of water diver-
Plateau and an important national energy and chemical base.       sion across the river basin by means of the itemized investi-
In this area, the gullies are developed, the topography is bro-   gation and reduction method.
ken, the precipitation is less, and the water resources are          By using the method of subdivision investiga-
poor, so it is the most serious and important area of soil and    tion and reduction: Wnatural = Wmeasured + Wirrigation +
water loss in history. The whole area is about 93 000 km2 , the   Windustrial + Wurban life + Wrural life + Wreservoir storage variable ±
population is 5.635 million people, the annual GDP scale is       Wdiversion of water (drainage area elicited or introduced) , the amount of
about CNY 385.6 billion, the annual output value of agricul-      water consumed by human society is added to the measured
ture, forestry, animal husbandry and fishery industry is about    value of hydrology, that is, the natural river runoff is reduced
CNY 48.67 billion. Since the 1960s and 1970s, the massive         to “natural river runoff”. Year by month, agricultural irriga-
soil and water loss control has continued to this day, with the   tion, industry, urban and rural life, reservoir water storage
rapid development of modern energy and chemical industry          variables and cross-basin water diversion are investigated
park and urbanization, the development and utilization of re-     and calculated month by month, forming the series of
gional soil and water mineral energy resources, as well as the    “natural river runoff” after the reduction of human society’s
geomorphological and hydrogeological conditions of the un-        consumption of river water by every hydrological station
derlying surface of natural production and confluence in the      from 1956 to 2012. In order to further analyze whether the
basin are deeply affected.                                        underlying surface and other environmental factors have an
                                                                  impact on its series.
2     Research methods and data sources
                                                                  2.2   Data sources
2.1    Research methods                                           39 hydrological station, 95 precipitation station from 1956
Covering the hilly and gully region of the Loess Plateau in       to 2012, 57 years monitoring data, analysis and calculation
Shaanxi, a 57-year series from 1956 to 2012 of the annual         and involves a large number of agricultural irrigation, indus-
runoff data of 39 hydrologic stations on 27 rivers were se-       trial and urban life, reservoir storage and inter-basin water
lected. The series of runoff data are calculated by “reduc-       transfer variable water volume, water and soil conservation
tion” of the amount of water consumed directly by human           engineering construction status and the related data, such as
society year by year, and the method and steps of 57-year se-     social economic indicators from the author of nearly 30 years
ries consistency check and correction are adopted, To com-        in the handbook of shaanxi province hydrology, the shaanxi
prehensively study and verify the effects of long-term large-     province water resources investigation and water resources
scale human activities on the gradual accumulation of runoff      in Shanxi Province and other preparation work, the relevant
production and confluence on the underlying surface of the        government water conservancy, statistics, meteorological de-
basin, and the changes of climatic factors such as precipita-     partments to collect, textual research and practical investiga-
tion, which have a dual interaction with each other, And fi-      tion data accumulation.
nally, the environmental conditions of runoff production and

Proc. IAHS, 383, 111–119, 2020                                                      https://doi.org/10.5194/piahs-383-111-2020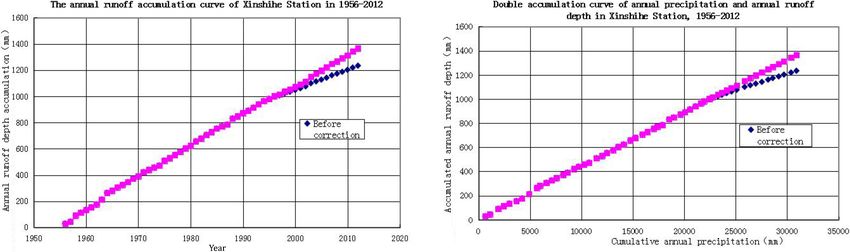
Y. Jing and Z. Zhou: The influence on river runoff.                                                                                                                113

Figure 1. Annual runoff accumulation and double accumulation curve of annual precipitation runoff at Shenmu station.

Table 1. Statistical tables of small hydrological stations in the annual runoff series system around 2000 (Data Series 1956–2012).

    Hydrologic      Series of         Series of damage                 Series of damage           Correction of          After the destruction
    station         damage          turning points (years)           turning points (years)         the annual        turning point (year) series
                    turning            before the series                 after the series          mean runoff
                    points      Annual runoff    Annual mean     Annual runoff    Annual mean      in the same       Average annual           Annual          Annual
                    (year)        depth mean     precipitation     depth mean     precipitation    period after        mean value of     precipitation   precipitation
                                        (mm)            (mm)             (mm)            (mm)        the break    uncorrected runoff        increased       increased
                                                                                                    year (mm)        is less than that   or decreased    or decreased
                                                                                                                   before the revised             (%)             (%)
                                                                                                                           series (%)
    HuangPu         1999                 49.6            385.8            11.5            379.6           46.5                 −76.8            −1.6            −6.3
    WangDaoHengTa   1996                 56.7            378.9            19.3            350.7           56.8                 −66.0            −7.4             0.2
    ShenMu          1998                 70.4            399.2            24.3            381.3           67.1                 −65.5            −4.5            −4.7
    WenJiaChuan     1996                 77.2            406.7            26.7            383.1           68.7                 −65.4            −5.8           −11.0
    XinShiHe        1995                 24.7            554.2            15.0            516.2           22.3                 −39.3            −6.9            −9.7
    CaoPing         1996                 48.0            456.7            24.9            451.7           46.3                 −48.1            −1.1            −3.5
    ZiChang         2003                 47.6            493.3            28.3            519.4           47.5                 −40.5             5.3            −0.2
    YanChuan        2003                 44.1            448.3            27.8            468.4           45.7                 −37.0             4.5             3.6
    YanAn           2003                 42.7            484.8            23.8            441.0           38.8                 −44.3            −9.0            −9.1
    GanGuYi         2003                 38.4            506.6            24.9            471.4           36.1                 −35.2            −6.9            −6.0
    DaCun           1996                 37.8            563.0            23.6            523.9           33.6                 −37.6            −6.9           −11.1
    DanShi          2000                 41.9            375.8            25.3            415.6           43.1                 −39.6            10.6             2.9

3     Result analysis and discussion                                                 at 21 stations is broken by the change of the environmental
                                                                                     conditions of runoff production and confluence, the damage
3.1     Consistency analysis of annual river runoff series                           turning point (year) and the influence degree can be divided
        based on environmental change                                                into three situations.

After the amount of water consumed by human society is                                  1. the slope of the cumulative curves of the 12 stations,
“reduced” to the measured amount of water, in general, the                                 such as Shenmu River, slowed significantly after 2000,
annual river runoff series should be kept consistent basically,                            showing that the annual runoff sequence system was
but the mechanism that the underlying surface condition af-                                smaller. The details are Fig. 1 and Table 1.
fects the consistency of runoff production and confluence is
complicated and the process is long. It is very difficult to                            2. the double accumulation curve of annual precipitation
judge and quantitatively calculate its influence. Through the                              runoff of 4 stations had a significant turning point
upstream and downstream balance check of the river runoff                                  around 1970, and the series before the turning point
after the “actual measurement and reduction of the amount                                  showed a large and systematic high-yield flow period.
of water consumed by human society”, and the comparative                                   After turning, a series of low yield periods are shown as
analysis of the trunk and tributaries, the double and single                               a result of the change of environment conditions such as
accumulative curves of the annual precipitation and the an-                                underlying surface and climate. See Fig. 2 and Table 2
nual runoff of 39 hydrologic stations are drawn. The results                               for details.
show that the consistency of the annual runoff data series

https://doi.org/10.5194/piahs-383-111-2020                                                                              Proc. IAHS, 383, 111–119, 2020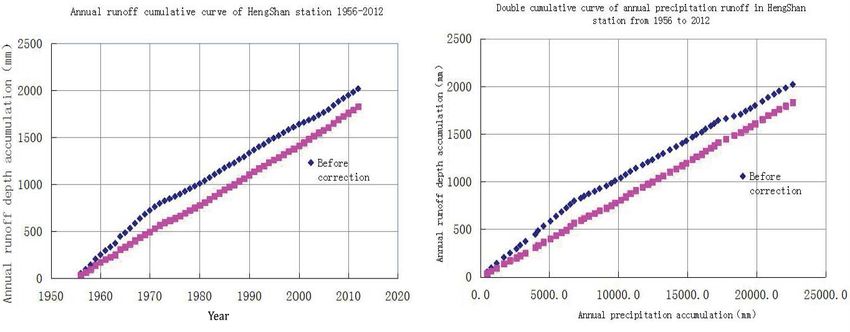
114                                                                                      Y. Jing and Z. Zhou: The influence on river runoff.

Figure 2. Annual runoff accumulation and double accumulation curve of annual precipitation runoff at Hengshan station.

Table 2. Statistical tables of small hydrological stations in the annual runoff series system around 1970 (Data Series 1956–2012).

 Hydrologic(al)   Series of     Series of damage         After the destruction         Correction of           Series of damage             Difference of the
 station          damage      turning points (years)     turning point (year)       the mean annual             turning points               average annual
                  turning        before the series               series                 runoff depth              (years) ago                   runoff of the
                  points      Annual         Annual     Annual         Annual               after the   Average annual          Annual           revised series
                  (year)       runoff          mean      runoff          mean             high-yield       runoff depth    precipitation   ratio of high-yield
                                depth   precipitation     depth   precipitation       current period    of the modified        over the         current period
                                mean           (mm)       mean           (mm)             before the    high-yield flow    same period               “after the
                                (mm)                      (mm)                             breakage     period series is          (mm)             destruction
                                                                                             turning    lower than that                                turning
                                                                                        point (mm)           of the pre-                                point”
                                                                                                              correction                                   (%)
                                                                                                             period (%)
 HengShan         1970          48.2           415.4      30.9           390.3                  32.8             −32.0            415.4                    6.1
 JingJiaGou       1970          52.1           445.3      40.1           391.0                  44.2             −15.2            445.3                   10.2
 QingYangCha      1970          55.8           459.6      40.2           432.1                  43.1             −22.8            459.6                    7.2
 BaiJiaCha        1970          52.8           484.4      36.9           447.8                  38.3             −27.5            484.4                    3.8

                                                                             nual runoff of the 1956–1970 series before 1970 is higher
                                                                             than that of the later series 1971–2012. It is necessary to re-
                                                                             vise the annual runoff of the high-yield flow period of “pri-
                                                                             mordial underlying surface” with slight disturbance of hu-
                                                                             man activities to the period of low-yield flow under the en-
                                                                             vironment of “current underlying surface” after the change
                                                                             of strong human activities and climate factors, in order to
                                                                             maintain the consistency of environmental conditions of pro-
                                                                             duction and confluence (see Sect. 3.2).

                                                                                  3. In five stations, a turning point occurred in the period of
                                                                                     high and low runoff of “primordial underlying surface”
Figure 3. Relationship between annual precipitation and runoff at
                                                                                     around 1970, and after 2000, the annual runoff series
Qingyangcha station.                                                                 system in the environment of “current underlying sur-
                                                                                     face” was again smaller than the low yield period, as
                                                                                     shown in Fig. 4 and Table 3, respectively.
   Figure 3 of the relationship between annual precipitation
and annual runoff at Qingyangcha station also shows that in
the same order of magnitude of annual precipitation, the an-

Proc. IAHS, 383, 111–119, 2020                                                                    https://doi.org/10.5194/piahs-383-111-2020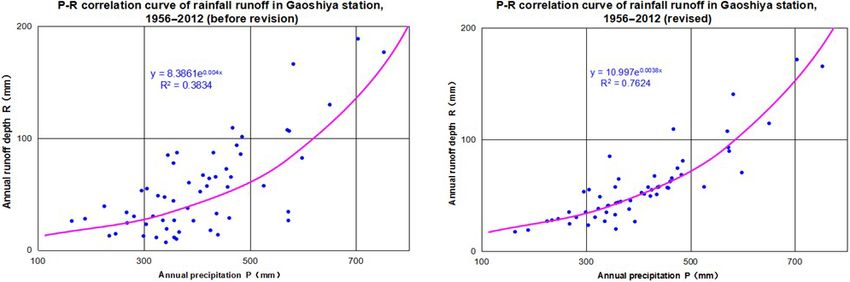
Y. Jing and Z. Zhou: The influence on river runoff. 115
Table 3. Statistical tables of small hydrological stations in the annual runoff series system around 1nd 2000 (Data series 1956–2012).
Hydrologic(al) (1) Turning (2) Turning The series before the Turning point (1) and (2) “current underlying surface” The modified After the
station point of high point of turning point of “current underlying environmental low-yield series of correction
yield flow secondary high-yield flow surface” flow period after high yield of the low
period failure in the period in “underlying environmental the turning point flow period yield flow
of “underlying environment surface of primordial low-yield flow (2) series compared with period turning
surface of of “current ecology” (1) period series turning point point (2),
primordial underlying Annual Annual Annual Annual Annual Annual (1) and (2): the series is
ecosystem” surface” runoff depth mean runoff mean runoff mean “current higher than
(year) during the mean (mm) precipi- depth precipi- depth mean precipi- underlying that between
period of tation mean tation (mm) tation surface” turning point
low yield (mm) (mm) (mm) (mm) environmental (1) and (2).
and current low The “current
flow yield underlying
(year) flow surface”
period environmental
series low yield
flow period
series
Before Behind Before Behind Annual Annual Annual Annual
correction correction correction correction runoff precipi- runoff precipi-
mean tation mean tation
difference mean difference mean
(%) difference (%) difference
(%) (%)
MaHuYu 1970 1998 64.5 59.8 455.0 39.3 342.0 32.0 48.7 396.0 52.2 33.0 23.9 15.8
GaoShiYa 1978 1998 83.6 68.1 443.1 51.6 375.4 17.9 50.6 385.3 32.0 18.0 −1.9 2.6
GaoJiaBao 1971 1999 176.3 153.3 445.4 128.2 355.7 88.0 130.6 421.1 19.6 25.2 1.9 18.4
GaoJiaChuan 1971 1999 134.6 116.4 449.7 101.5 355.2 70.6 104.0 430.7 14.7 26.6 2.5 21.3
ShenJiaWan 1971 1998 96.1 72.1 394.1 48.5 326.1 28.7 56.1 360.6 48.7 20.9 15.7 10.6
3.2 Consistency correction of “underlying surface” of Table 4. Statistical table of annual precipitation and correction co-
annual runoff series efficient of Qingyangcha station.
3.2.1 Correction method P (mm) 200 300 400 500 600 700 800
A (%) 34.6 30.4 25.9 21.1 16.0 10.5 4.8
Different ways of thinking and methods were used to correct
the environmental changes of the three kinds of production β 0.65 0.70 0.74 0.79 0.84 0.89 0.95
and confluence mentioned above.
For the series which only changed around 2000, it was
considered that the environmental conditions of the “cur-
rent underlying surface” and “primordial underlying surface” runoff before and after turning year (Fig. 3). Select an an-
were basically consistent with those of the “original ecolog- nual precipitation value, Two annual runoff depth values R1
ical underlying surface” during the high-yield flow period. and R2 were found on two curves. The annual runoff atten-
And the runoff series is relatively small due to the lack of uation rate and correction coefficient were calculated by for-
“natural” amount of the measured annual runoff in that year, mulas α = (R1 − R2 )/R1 · 100 % and β = R2 /R1 . The depth
which is corrected by the relationship of precipitation and of runoff in the period of low yield flow on “current under-
runoff before the turn. lying surface”; Make annual precipitation correction coeffi-
For the series that only turned after 1970, Table 2 shows cient Table 4; draw P–β relation curve diagram 5; check the
that although the series precipitation decreases after turning, correction coefficient of P–β relation curve, multiply by the
Fig. 3 the precipitation runoff relationship curve shows that annual runoff (depth) of the year to be revised, we can get
the two series are obviously larger and smaller before and the corresponding corrected natural annual runoff.
after the transition. The investigation confirmed the physi- For the long series with two transitions around 1970 and
cal causes of the disturbance of strong human activities such 2000, it is the combination of the two situations. Table 3
as persistent large-scale soil and water conservation in these shows that the two short series of precipitation before the
areas before and after the turning year, and considered that turn of 1970 and after the turn of 2000 are greater than the
the high-yield flow period of the “underlying surface of the mean of the series between the two turning points. It is con-
original ecology” has been transformed into the period of sidered that it is more reasonable to unify the high yield flow
low yield flow under the environmental condition of “cur- before 1970 and the low yield flow after 2000 to the “current
rent underlying surface”. The correction coefficient method underlying surface” low yield flow period between the two
is used to correct the high yield flow before turning to the turning points. The correction coefficient method is used for
low yield flow condition on the “current underlying sur- high yield flow correction and the relationship of precipita-
face”. Operation steps of the modified coefficient method tion and runoff between the two turning points is corrected
(Li, 2003): plot the relationship between precipitation and for low yield flow after 2000.
https://doi.org/10.5194/piahs-383-111-2020 Proc. IAHS, 383, 111–119, 2020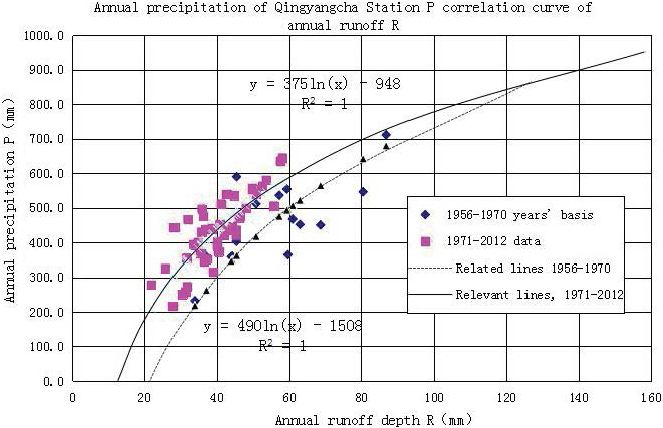
116                                                                            Y. Jing and Z. Zhou: The influence on river runoff.

Figure 4. Annual runoff accumulation and double accumulation curve of annual precipitation runoff at Ma Huyu station.

                                                                      excluding the influence of no mutation of precipitation fac-
                                                                      tors and direct consumption of river water by human activi-
                                                                      ties, only the consistency of the underlying surface is greatly
                                                                      changed and the abrupt turning system of annual runoff se-
                                                                      ries is reduced. There are 4 hydrological stations, such as
                                                                      Qingyangcha, where the annual precipitation series is larger
                                                                      after 2000 than in 2000–2012 and 1956–1999,the mean value
                                                                      of the series is increased from 9 % to 18.6 %, which indicates
                                                                      that the rainfall runoff fitting relationship before the previous
                                                                      year 2000 runoff series is reasonable. See Fig. 7 and Table 5
                                                                      for details.

Figure 5. P–β relationship curve of Qingyangcha station.              3.3.2   Quantitative Analysis of the impact of
                                                                              Environmental changes such as precipitation and
                                                                              Human activities on Annual runoff
3.2.2    Consistency Test of modified sequences
                                                                      Based on the average annual runoff of the series of high yield
Plotting the double accumulation curve of the annual precip-          runoff in the ”underlying surface of the original ecology”,
itation runoff and annual runoff single accumulation curve            the series mean after the consistency correction is compared
from 1956 to 2012 after correction, and Compared with                 with it to judge the influence degree of the environmental
the series of annual precipitation runoff relation curves be-         change. Tables 1 and 2 show that the average effect of the
fore and after revision. From the cumulative line to the near         corresponding two cases was 49.6 % and 24.3 %, the highest
straight line, the relative concentration degree and the cor-         was 76.8 % and 32 %, and the lowest was 35.2 % and 15.2 %.
relation coefficient of the data scatter point are greatly im-        The mean influence degree of the five stations with two turns
proved, which shows that the modified sequence keeps a                around 1970 and 2000 was 15 % and 30 %, respectively, as
good consistency. The correlation coefficient of Gaoshiya             shown in Table 6.
station has been raised from 0.38 to 0.76, which is shown                The special Wudinghe River and Beiluohe River Basin
in Figs. 1, 2, 4, 6.                                                  environmental changes on regional effects of the runoff are
                                                                      quantitatively analyzed from the author (Jing et al., 2008a, b;
3.3     Analysis of annual runoff affected by environmental           Jing, 2016): The effect of soil and water conservation mea-
        change                                                        sures on runoff decreased by more than 50 % in the middle
                                                                      reaches of Wudinghe River, while the decrease of rainfall in
3.3.1    Analysis on Variation of annual Precipitation                the whole basin affected the runoff decrease by 76.4 %, and
         Series from 1956 to 2012                                     the influence of human activity accounted for 23.6 %,among
The accumulated annual precipitation curve of 21 hydrologic           them, the water consumption in human society accounted for
stations, whose annual runoff series consistency has been             18.8 %, and the effect of soil and water conservation mea-
destroyed due to the great change of underlying surfaces,             sures was 4.8 %.
shows that 17 stations have maintained a good stability of
57 years from 1956 to 2012. It is further proved that after

Proc. IAHS, 383, 111–119, 2020                                                        https://doi.org/10.5194/piahs-383-111-2020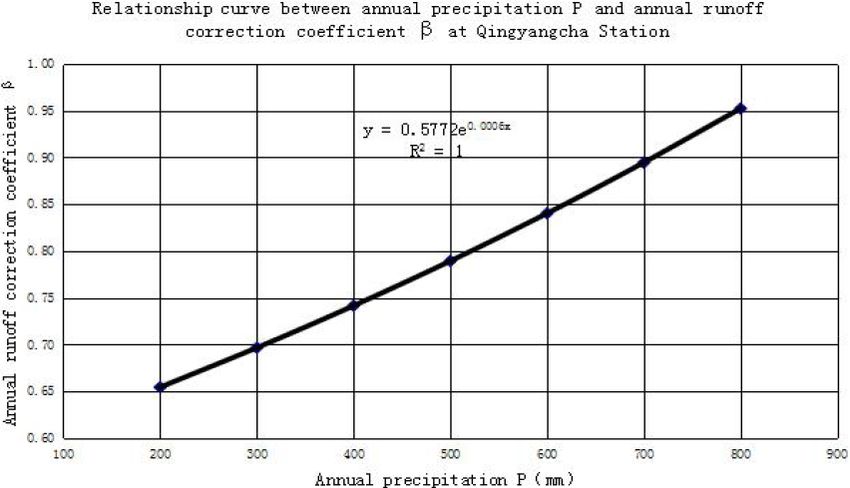
Y. Jing and Z. Zhou: The influence on river runoff. 117
Figure 6. Comparison of precipitation runoff curve before and after correction at Gaoshiya station.
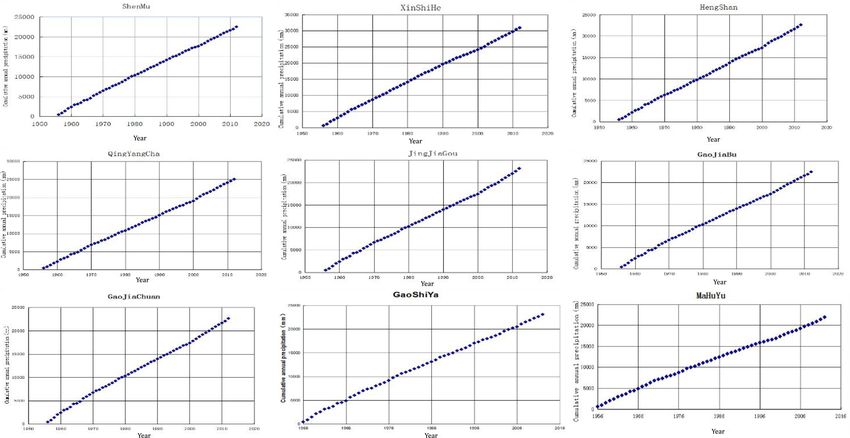
Figure 7. Accumulated curves of annual precipitation in 1956–2012 at 9 hydrologic stations such as Shenmu, Hengshan and Qingyangcha
ect.
4 Conclusion rent underlying surface” environment low yield flow period
after 2000 or so. The consistency of the environmental condi-
The underlying surface of the watershed in the hilly and gully tions of the abortion and confluence of most of the rivers, and
region of the Loess Plateau in Shaanxi Province is gradually the consistency of the hydrological monitoring data sequence
accumulated due to the long-term interactive and compre- of the river runoff have been destroyed simultaneously. With
hensive disturbance of climate factors and strong human ac- the same order of precipitation, the yield and confluence of
tivities. The “primordial underlying surface” of most rivers the watershed tend to decrease.
in the high-yield flow period can be extended to about 2000 In the near future, the “current underlying surface” of the
or so. Some rivers changed from “original ecological under- basin has a low yield, which is irreversible to the environ-
lying surface” high yield flow period to low yield flow pe- mental condition of high yield in the early stage of the “un-
riod under “current underlying surface” environment condi- derlying surface of the original ecology”. Based on the prin-
tion around 1970, and some rivers again appeared lower “cur- ciple of maintaining the consistency of the environmental
https://doi.org/10.5194/piahs-383-111-2020 Proc. IAHS, 383, 111–119, 2020118 Y. Jing and Z. Zhou: The influence on river runoff.
Table 5. Statistical unit of large hydrologic station in the annual precipitation series after 2000 Units: mm.
Hydrologic(al) River Average annual Average annual After 2000, Increase in the
Station location precipitation precipitation the series increases average value of the
1956–1999 2000–2012 compared with the series after 2000
previous series compared with the
previous series by %
Qingyangcha Wuding River tributary 424.2 490.4 66.2 15.6
Dali River (Middle reaches)
Dingjiagou Wuding River main stream 388.8 461.1 72.3 18.6
(middle reaches)
Gaojiabu Tu Wei River main stream 386.4 421.1 34.7 9.0
(middle and upper reaches)
Gaojiachuan Tu Wei River main stream 387.4 430.7 43.3 11.2
(downstream near estuary)
Table 6. 1970 and 2000 annual runoff series affected by environmental changes.
Hydrologic (al) High yield flow period of “underlying surface of Low production flow period of “current underlying
station primordial ecology” surface” environment after 2000
Annual Human society Fixed to “current underlying Human society Fixed to “current underlying
runoff consumes rivers surface” low yield period consumes rivers surface” low yield period
mean between 1970 and 2000 between 1970 and 2000
Period (mm) Wastage Influence Wastage Influence Period Period Wastage Influence Wastage Influence
(mm) degree (%) (mm) degree (%) (mm) degree (%) (mm) degree (%)
MaHuYu 1956–1970 64.5 −4.7 −7.3 1971–1997 1998–2012 −15.8 −24.5
GaoShiYa 1956–1978 83.6 2.07 2.48 −15.5 −18.5 1979–1997 1998–2012 3.39 4.06 −33.0 −39.5
GaoJiaBao 1956–1971 176.3 0.28 0.16 −23.0 −13.0 1972–1997 1999–2012 5.05 2.86 −45.7 −25.9
GaoJiaChuan 1956–1971 134.6 0.56 0.42 −18.2 −13.5 1972–1997 1999–2012 6.03 4.48 −30.6 −22.7
ShenJiaWan 1956–1971 96.1 1.19 1.24 −24.0 −25.0 1972–1997 1998–2012 4.1 4.27 −40.0 −41.6
conditions of the production and confluence of the current Data availability. The meteorological data used in the previous
underlying surface in the near future, the hydrological obser- study came from the China Meteorological Network (http://data.
vation data of the river should be revised to a unified basic cma.cn, last access: 26 June 2018), and the agricultural irriga-
standard, so that the hydrological sequence data can keep the tion, industrial and urban domestic water use data came from
consistency of the source “underlying surface” of the hydro- the Shaanxi Water Resources Bulletin (http://slt.shaanxi.gov.cn/
sxmwr-zxfw-dfkj-3-show-93956, last access: 26 June 2018). The
logical sequence. It is more meaningful in practical applica-
hydrological data were collected from the the Yellow River Water
tion. Conservancy Commission (YRWCC), Ministry of Water Resources
In the region controlled by most rivers in the hilly and of China and the Hydrology and Water Resources Survey Bureau
gully of the Loess Plateau in northern Shaanxi, the annual of Shaanxi Province. These data are proprietary or confidential in
precipitation has maintained the stability of the 57 years se- nature and may only be provided with restrictions.
ries of 1956–2012 without systematic abrupt changes. After
2000, the annual precipitation in the whole basin of TuWeihe
river was about 10 % larger a year, over the middle reaches of Author contributions. JY conceived the idea, data analysis and
Wudinghe river, there are about 17 %, while the annual pre- wrote the manuscript; ZZ supervised the data analysis and writing
cipitation in the lower reaches of Wudinghe river keeps the process. Both authors have read and agreed to the published version
stability of 57 years series. of the manuscript.
The correction method in this paper can only meet the
accuracy of the consistency correction of annual runoff se-
ries when the regional water resources evaluation is satisfied. Competing interests. The authors declare that they have no con-
The difficulty is how to discretize the revised data as random flict of interest.
events occur, which should be concretely analyzed, selected
and used.
Special issue statement. This article is part of the special issue
“Hydrological processes and water security in a changing world”.
Proc. IAHS, 383, 111–119, 2020 https://doi.org/10.5194/piahs-383-111-2020Y. Jing and Z. Zhou: The influence on river runoff. 119
It is a result of the 8th Global FRIEND–Water Conference: Hydro- Jing, Y.: Analysis on flow consistency and effect of human being in
logical Processes and Water Security in a Changing World, Beijing, Wu Dinghe River , in: 2008 Academic Forum on Water Ecology
China, 6–9 November 2018. Monitoring and Analysis, Shenyang, China, 2 December 2008,
272–276, 2008 (in Chinese).
Li, Y. Y.: Work document for the preparation of the national wa-
Financial support. This research has been supported by the the ter resources comprehensive planning, The office of the leading
National Key Research and Development Program of China (grant group of the national water resources comprehensive planning
no. 2016YFC0402405). work, Beijing, China, Report, 2003 (in Chinese).
Peng, R. S.: A preliminary study on the correction of water
and sediment data, Study on water resources, 5, 368–378,
https://doi.org/10.12677/JWRR.2016.54043, 2016 (in Chinese).
References Wang, G. Q., Jia, X. A., Chen, J. N., Zhang, Y., and Li,
H. B.: Interference point analysis of the significant influ-
Hui, Y. Y., Liu, T. H., and Tong, X. Q.: Water and sediment changes
ence of human activities on Hydrologic sequence, North-
in Wuding River, Yanhe River and Qingjian River and their
west Water Resources and Water Engineering, 12, 13–15,
development trend forecast, Yellow River Water and Sediment
https://doi.org/10.3969/j.issn.1672-643X.2001.03.004, 2001 (in
Change Research Foundation, China, Dissertation, 1993 (in Chi-
Chinese).
nese).
Wang, G. Q., Zhang, J. Y., Liu, J. F., and He, R. M.:
Jing, Y., Chen, F. L., and Ge, F. L.: Study on Idiosyncrasy of Wa-
Quantitative Analysis of the effects of Climate change
ter and Sediment on Area headstream in Beiluohe Watershed,
and Human activities on runoff, China Water, 2, 55–58,
Hydrology and Water Resources Survey of Shaanxi Province,
https://doi.org/10.3969/j.issn.1000-1123.2008.02.016, 2012 (in
Shaanxi, China, Report, 2008a (in Chinese).
Chinese).
Jing, Y., Chen, F. L., Ge, F. L., and Gu, M. X.: Analysis of character-
Zhang, A. J., Wang, B. D., and Cao, L.: Summary of studies
istics of Water and sediment in Source area of North Luohe River,
on the contribution of climate change and human activities to
Hydrology, 030, 92–96, https://doi.org/10.3969/j.issn.1000-
runoff, Northeast China Water Conservancy and Hydropower, 1,
0852.2010.04.023, 2010b (in Chinese).
7–8, https://doi.org/10.14124/j.cnki.dbslsd22-1097.2012.01.001,
Jing, Y., Ge, F. L., and Tian, H. W.: Department of Water Re-
2012 (in Chinese).
sources of Shaanxi Province, Water Resources Bulletin (2000–
Zhu, H. F., Zhao, W. W., Kang, M. Y., and Guo, W. W.: Analy-
2016), Shaanxi, China, Report, 2016c (in Chinese).
sis on Obvious Disturbing Point in Time Variation Process of
Jing, Y., Li, Z. Y., and Pang, L.: Technical methods of Shaanxi
Sediment Discharge of the Yanhe River, Yellow River, 8, 80–
Provincial Hydrological calculation Manual, Shaanxi Provincial
81, https://doi.org/10.3969/j.issn.1000-1379.2008.08.036, 2008
Bureau of Hydrology and Water Resources Survey, Shaanxi,
(in Chinese).
China, Report, 2017d (in Chinese).
https://doi.org/10.5194/piahs-383-111-2020 Proc. IAHS, 383, 111–119, 2020You can also read