Cape Town Water Outlook 2018 - Updated 20 July 2018 Department of Water and Sanitation City of Cape Town
←
→
Page content transcription
If your browser does not render page correctly, please read the page content below
Cape Town Water Outlook 2018
                 Updated 20 July 2018
   Department of Water and Sanitation
                   City of Cape Town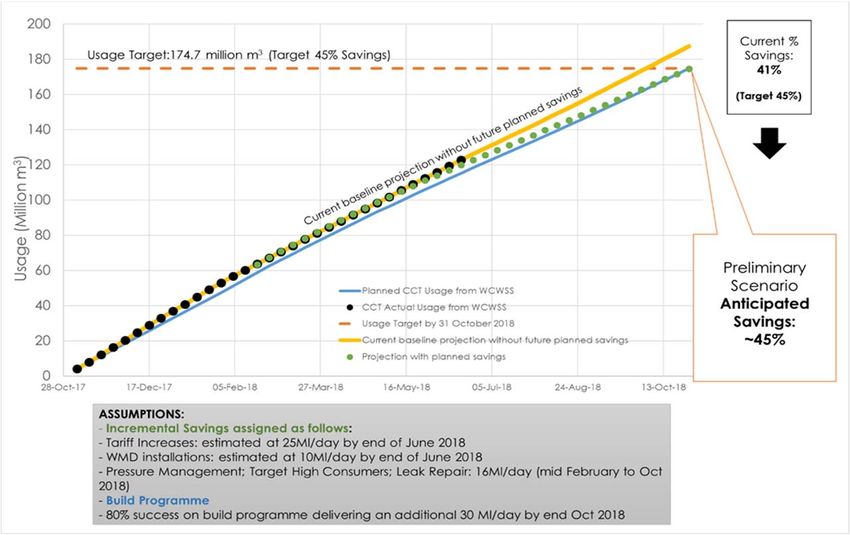
Overview

•   2018 rainfall to date and balance of season forecast

•   Impact on dams and rainfall scenarios

•   What has changed in managing demand & supply?

•   Too early to relax – implement recovery plan to provide relief without compromising
    water security

•   Restrictions, demand management initiatives, reduced demand & diminishing returns

•   WCWSS rules and reconciliation strategy approach

•   Providing assurance of water supply

•   Augmentation considerations - determining optimal augmentation volumes, timing,
    source, cost, responsibility

•   Existing, committed and future augmentation options

•   Summary of current water outlook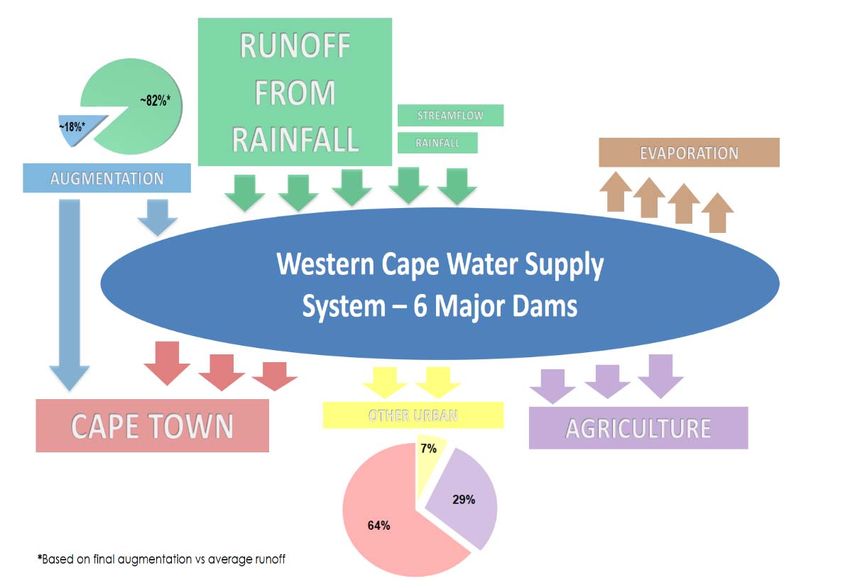
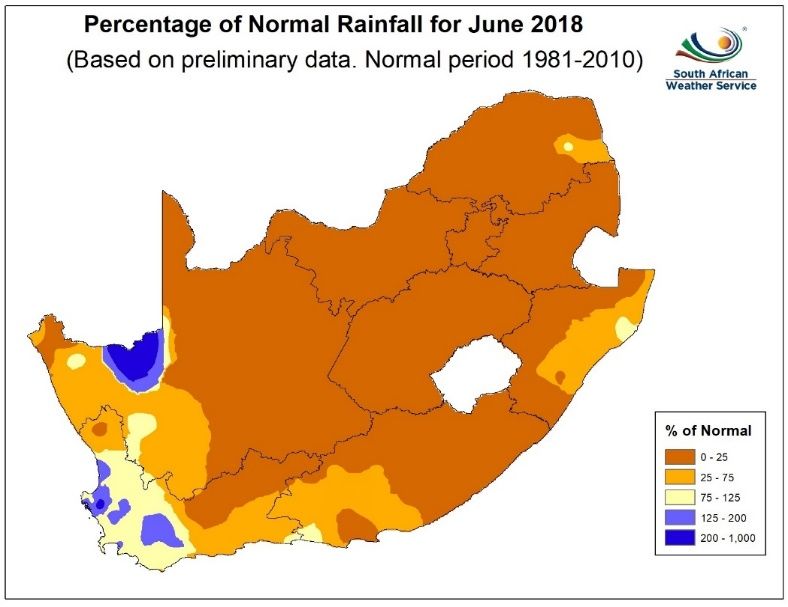
Rainfall in May & June in WCWSS
approximately average
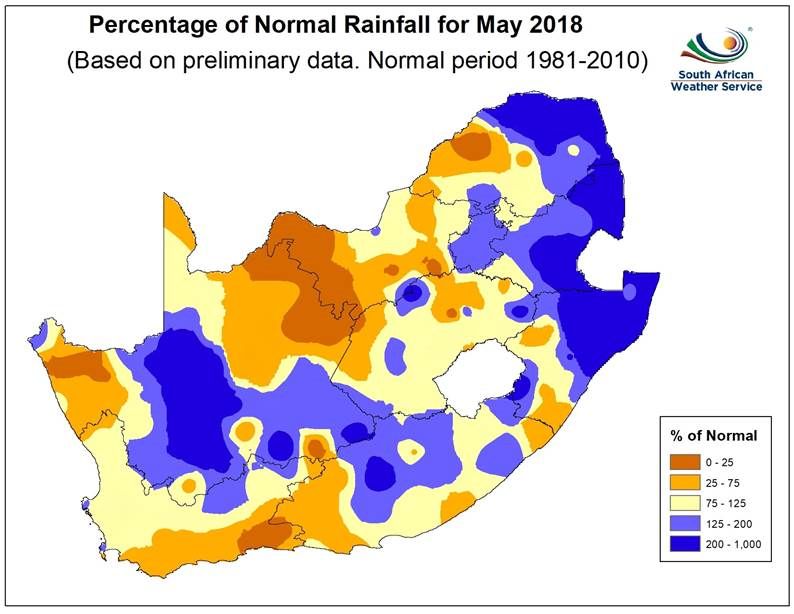
SAWS Rainfall outlook Q3 2018
1. El Nino / Southern Oscillation (ENSO) is in a neutral phase.

2. Latest forecasts indicate a high likelihood (almost a 50% probability) of the
   development of an El Nino event during spring and summer.

3. It is still too early to predict its exact outcome during summer.

4. It is advised that this system be monitored in the next few months to
   determine its impact on the summer-rainfall areas.

5. During Jul-Aug-Sep there are sustained, almost countrywide indications for
   above-normal rainfall, but there is still no confidence for this period.

6. There is however indications of drier conditions along parts of the south coast,
   with confidence, during Aug-Sep-Oct and Sep-Oct-Nov.

7. Overall, higher than normal temperatures are expected towards Spring and
   beyond. There is a particularly high confidence forecast for above-normal
   temperatures over the northern parts of the country.

(as at 10 July 2018)
Average rainfall significantly raised dam levels – 55.8% as at 19 July 2018
1 000 000                                                                                                                                                                       110%
                                                                                                                                                     97%

 900 000                                                                                                                                                                        100%
                    84.1%                                                                                                                                           2014

 800 000                                                                                                                                                                        90%

                                                                                                                                                    71%
                                                                                                                                                                                80%
 700 000

                                                                                                                                                    60.3%                       70%
 600 000            55.4%                                                                                                                                           2015

                CT L2                                                Dam levels ~29% than in 2017                                                                               60%
                                                                                                                                                  CT L3
 500 000                                                                                                                                                            2016
                    46.5%
                                                                                                                                                    38.4%
                                                                                                                                                                                50%
 400 000
                    31.0%                                                                                     CT L5                               DWS 45/60%                    40%
            CT L6                                                                                                                                                   2017
 300 000                             DWS 20%
                    CT L6B                                                                                                                                                      30%
                                               CT L4

                                                                                                                              Hydrological year
                                                            CT L4B
 200 000
                                                                                                                                                                                20%
                                          2018

                                                                                                                              Start 1 Nov
 100 000                                                                                                                                                                        10%

       0                                                                                                                                                                        0%
            1       3        5   7   9   11 13 15      17      19      21 23       25 27       29 31 33    35 37      39 41   43 45                       47   49   51     53
                                         1999  2000         2001        2002       2003       2004  2005     2006      2007   2008
                                         2009  2010         2011        2012       2013       2014  2015     2016      2017   2018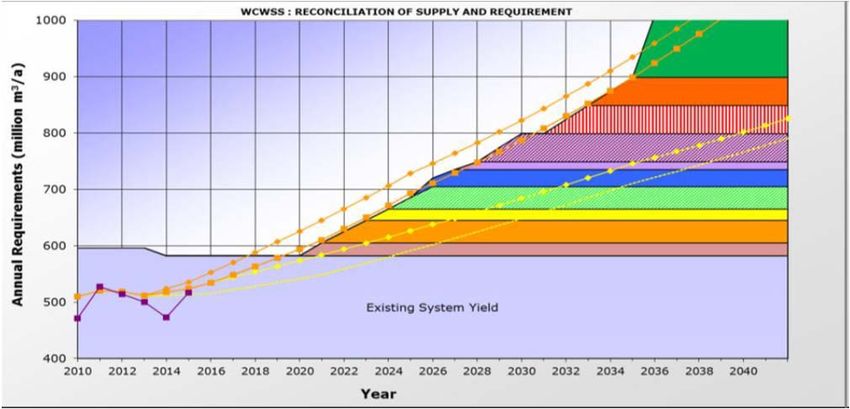
The impact of rainfall on dam levels if current restrictions remain
90%                                                                                                                                          Proposed CAPE TOWN restriction                                                  Wet winter
                                                                                                                                             levels will depend on restrictions
80%                                                                                                                                          prevailing in the WCWSS                                                         Long term average rainfall

70%

60%

                              Actual dam levels
50%

40%                                                                                                                                                                                                                                                        2017 rainfall

30%                                                                                                                                                                                                                                         50% of 2017 rainfall

20%

10%                                                                                                                                          Drawdown will vary depending on restriction level imposed by DWS
                                                                   31 Oct end of hydrological year
0%
                                                                     01-JUN-18

                                                                                                                                                                                                                                01-JUN-19
                                           01-APR-18

                                                                                                                                                                                                     01-APR-19
      01-JAN-18

                  01-FEB-18

                               01-MAR-18

                                                       01-MAY-18

                                                                                     01-JUL-18

                                                                                                 01-AUG-18

                                                                                                             01-SEP-18

                                                                                                                         01-OCT-18

                                                                                                                                     01-NOV-18

                                                                                                                                                 01-DEC-18

                                                                                                                                                               01-JAN-19

                                                                                                                                                                           01-FEB-19

                                                                                                                                                                                       01-MAR-19

                                                                                                                                                                                                                 01-MAY-19

                                                                                                                                                                                                                                               01-JUL-19

                                                                                                                                                                                                                                                            01-AUG-19

                                                                                                                                                                                                                                                                        01-SEP-19

                                                                                                                                                                                                                                                                                    01-OCT-19
                                                                                 2017 rainfall                  50% of 2017 rainfall                         Average rainfall                      Wet winter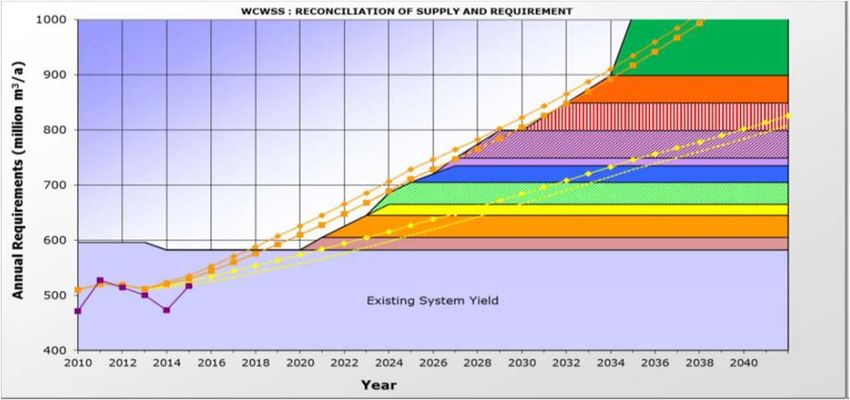
What happened to Day Zero? / Drought Monitoring - 2018 Hydrological Year

• The Day Zero monitor provided for dam levels below 40%, based on rainfall similar to 2017.

• In light of improved dam levels, the City is exploring incremental reduction of restrictions to provide relief to consumers while not
  compromising water security.
Dam levels > in 2015: How has this changed what we do?
•   Still too early to relax
•   Drought management moving to a recovery phase
•   Focus on long-term resilience
•   Ensure lessons from the drought are used to ensure water security going forward
•   Formalise water strategy as it relates to water supply & demand, resilience & adaptation, governance, financial
    sustainability

                        Demand                                                        Supply
• Rolling out of pressure management zones will               • Managing dam system optimally according to system
  continue until all possible zones are completed.              rules;
  Pressures are linked to restriction levels;
                                                              • Managing catchments including clearing alien
• Water management devices will still be installed in
                                                                vegetation;
  alignment with restriction levels but at a reduced
  pace;                                                       • Reviewing level of desired supply assurance for the
• Tariffs will remain in place until restriction levels are     City (currently 1:50);
  reduced and need to compensate for bounce-back              • Determine optimal augmentation volumes and timing
  uncertainties;                                                aligned with reconciliation strategy;
• Communication campaigns will continue, to ensure            • Continue existing augmentation projects.
  responsible water use.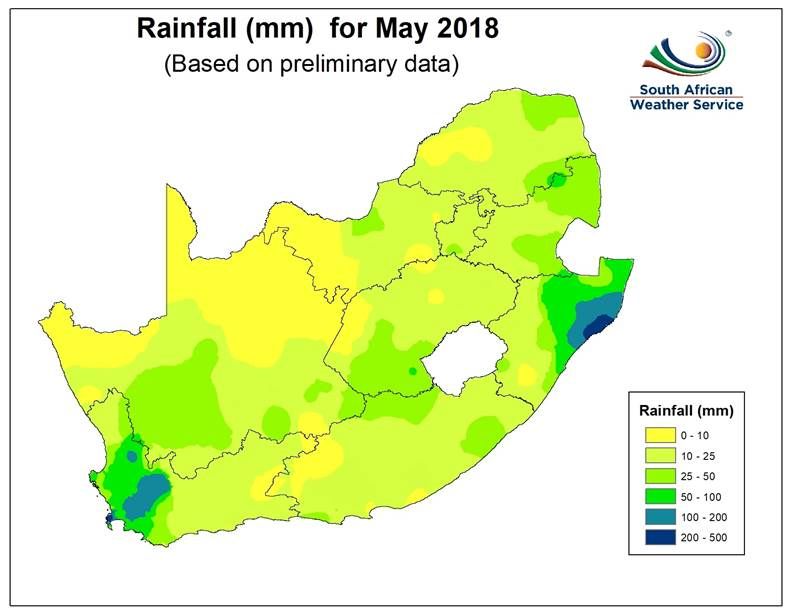
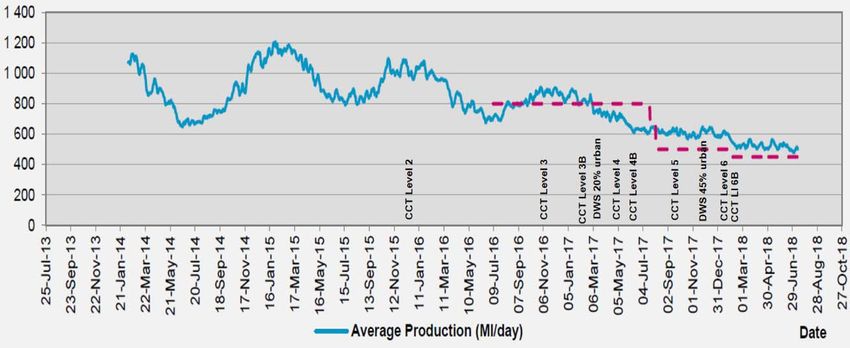
DEMAND
APPROACH HAS MOVED FROM DISASTER TO LONG-TERM RESILIENCE                                                    SIDE

But DWS restrictions are in place and need to be met. Agricultural releases were limited to ensure 60% saving.
Urban requires 45% saving; the city has achieved 41% to date and can thus not reduce water restrictions despite
recovering dam levels.
For Cape Town, this means that demand must still be managed                                               DEMAND
                                                                                                            SIDE
to get below 450 Ml/day
While Cape Town has significantly reduced its demand (measured here as production from the treatment works),
from a peak of 1200 Ml/day in 2015 down to nearly 500 Ml/day, a further reduction in demand is needed to below
450 Ml/day to meet the 45% saving required by DWS restrictions.

                                                   Demand reduction is saving >400 Ml/day
                                                          Feb 2017 = 900 Ml/day
                                                          July 2018 = 500 Ml/day

Main demand reduction interventions include:
•  punitive drought tariffs
•  water management devices & flow restrictors
•  aggressive pressure management
Demand management actions DEMAND
SIDE
60 000 3000
No Water WMD notifications Weekly Contravention actions
• Contraventions introduced in Oct 2017 – WMDs installed
Cumulative Contravention actions
Number of contravention actions
50 000 2500 where use >20kl/mth per household;
WMD "no water" notifications
• From 1 Jan 2018, this changed to installations at
40 000 2000 households using >10.5kl/mth;
• Average household size in Cape Town is 3.2, at 50lcd =>
30 000 1500
4.8kl/mth per household
• Spike in WMD “no-water” notifications;
20 000 1000
• Approximately 15% of notifications result in orders – that
10 000 500 means that the majority of calls logged are due to
undetected leaks and households depleting the daily
0 0 allocation and are not due to installation or meter issues;
05-Nov
19-Nov
03-Dec
17-Dec
31-Dec
14-Jan
28-Jan
11-Feb
25-Feb
06-May
20-May
03-Jun
17-Jun
08-Oct
22-Oct
11-Mar
25-Mar
08-Apr
22-Apr
• Saving as at 10 July 66 MLD as at 6 July 2018.
• pressure reduction 61 MLD
• leak repair from reticulation repairs 3.5 MLD
• leak repair from internal household leaks 0.3 MLD
• Leak repair
• Pressure reduction on 163 zones across the City.
• The breakdown of pressure management is as follows:
• Total length of reticulation across the 10 600km
• Total length of current pressure managed reticulation: 4 800km (45,3%)
• Total length of reticulation that will be managed on completion of contract
(includes all new zones currently being designed and constructed): 6 200km
(58,6%)Cape Town has done really well, but further reduction is unlikely DEMAND
SIDE
(diminishing returns)
400
350
Average urban metros
300
in South Africa: Buffalo City
~270 litre pp pd Nelson Mandela Bay
250
Mangaung
Ekurhuleni Metro
200
City Of Johannesburg
City Of Tshwane
150 eThekwini
Cape Town
Cape Town ~125 litre pp pd
100 (All metros)
50
(based on litres per person per day, population in service area – Cape Town population ~ 4 million)
‐
2005 2006 2007 2008 2009 2010 2011 2012 2013 2014 2015 2016 2017 2018Cape Town’s water is part of an integrated system SUPPLY
SIDE
Cape Town gets its water from a system of dams heavily dependent
on rainfall that supply agriculture and other urban areas. This complex
system is managed by the national Department of Water and
Sanitation in cooperation with the City, based on rules that:
Minimize spillage : COCT demand can be shifted to dams most likely
to spill to maximize system yield
Minimize Wastage : WC/WDM Strategies to be implemented by all
users
Water Restrictions : DWS are responsible for determining and
managing water restrictions
About a third of the water in this system is used by agriculture and 7% by
other urban areas (smaller towns), with the City using 64% (unrestricted).SUPPLY
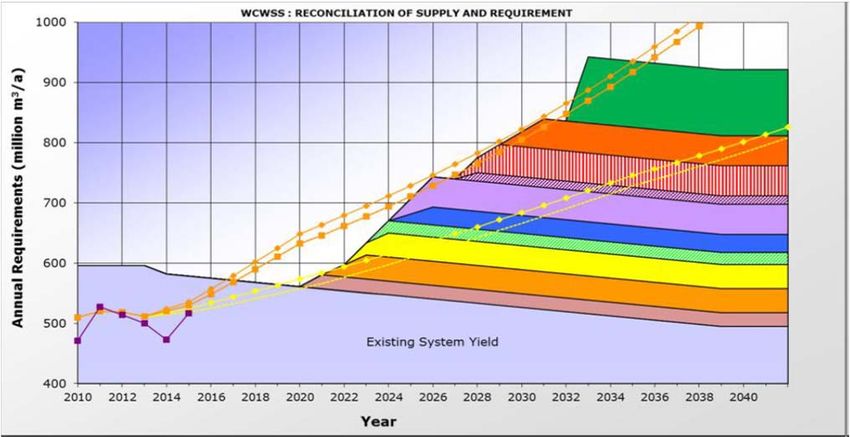
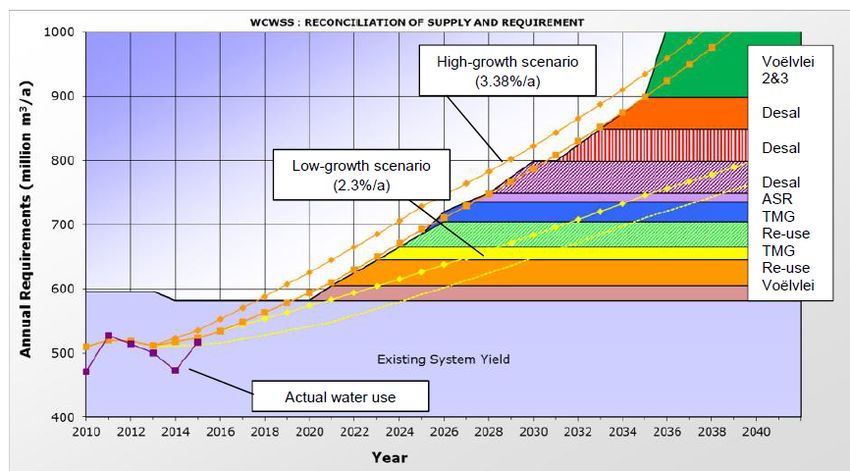
RECONCILIATION STRATEGY APPROACH SIDE
(2016 update/review)SUPPLY
WCWSS RECONCILIATION STRATEGY - SCENARIO PLANNING SIDE
Scenario 1: optimised system operation, 100% Scenario 2: optimised system operation, 50%
success of WDM, no climate change impacts success of WDM, no climate change impacts
Scenario 3: optimised system operation, 50% success
of WDM, projected climate change impacts
(2016 update/review)SUPPLY HISTORICAL INFLOW – informs volume of augmentation SIDE • From 2001-2017, dams >100% for 7 years out of 17 • Is this a step change? Insufficient evidence to determine
Augmentation - considerations
SUPPLY
SIDE
800 Augmentation schemes are a far more expensive
Equivalent annual inflow (millions of m3) source of water than runoff from rainfall. The
600 equivalent volume of runoff cannot be augmented in
short time periods and is dependent on rainfall
patterns. Even under poor rainfall conditions like 2017
400 we would require augmentation of ~770 MLD to
match the volume of runoff. Despite all augmentation
200 efforts, the supply scheme is vulnerable to poor
rainfall. This is clear from the impact of May rainfall on
0 dam volume change compared to 100MLD water
plant operating for a month: such plant would need
Average runoff
500MLD
2018 Planned
2019 Planned
2015 runoff
2016 runoff
2017 runoff
Wet winter runoff
augmentation
augmentation
to operate for 3 months to add 1% to dam levels.
As can be seen the cost per kl of water from other
sources vary considerably. The cost of bulk water,
50 000 216.3 May 2018 Rainfall impact at 3 major dams 250 waste water and reticulation is common so the costs
can be compared to the cost of runoff which is
200 ~R5.20/kl vs temporary desalination at >R40/kl.
Volume change (ML)
40 000
Rainfall (mm)
150
30 000 92
100 treated surface water- historical Estimated cost ranges for
20 000 37.3 groundwater - sandy aquifer treated water by source (R/kl)
50
permanent re-use
10 000 0 permanent desalination
groundwater - TMG
- -50
temporary water re-use
Wemmershoek Voelvlei TWK All dams
temporary desalination
Vol change 100MLD 16MLD Rainfall 0 5 10 15 20 25 30 35 40 45 50Reviewing Augmentation programme – learnings from drought SUPPLY
SIDE
Original program features: PROVIDING ASSURANCE FOR WATER SECURITY IN THE WCWSS:
• Temporary desalination prioritised (104 MLD) 16 • Embed WCWSS rules for restriction levels linked to dam levels;
small plants (desal and reuse) logistically complex & • Continue WC&WDM efforts both urban and in agriculture through
poor economy of scale adaptation for resilience;
• Ships and barges hugely expensive (200 MLD) • Define governance responsibilities in the WCWSS reconciliation strategy;
• Groundwater (90 MLD) not part of immediate • Confirm system yield in light of updated hydrology and formalise
response allocations to system users to provide certainty;
• Focussed only on the city (not the wider system) • Update WCWSS reconciliation strategy.
• Lack of sufficient attention to water demand
management Specifically in pursuit of Cape Town as a Water Sensitive City:
• Develop an integrated water strategy for Cape Town;
• Ensure the development of enabling water management solutions
Expert review pursuant to progressive realization of;
1. Assuming it will not rain again is not realistic • Value water and appreciate the importance of water availability to the
regional economy and City growth;
2. Prioritise ground water (Cape Flats Aquifer and • Ensure a flexible and adaptive management approach to deal with an
Table Mountain Group Aquifer) uncertain water future brought about by emerging climatic variability
and regulatory uncertainty. Plan for excess and scarcity;
3. Do not pursue temporary desalination and reuse
• Reduce vulnerability associated with present over reliance on surface
4. Plan and execute permanent desalination & re- water sources comprising the WCWSS by seeking to diversify and
use at an optimum scale integrate water sources at multiple scales;
• Manage entire urban water cycle and maximize reuse of wastewater.Reviewing Augmentation - Yield, cost, timing inform priorities SUPPLY
SIDE
• Surface water is least costly, but not resilient to drought;
• Groundwater can provide relatively quick additional water into the system. Groundwater extraction
can also be matched to requirement – over-extracting in times of drought while reducing volumes
when augmentation is not required;
• Permanent Desalination is very costly and cannot be implemented quickly BUT it is the only unlimited
new source of water into the system completely independent of rainfall;
• Re-used water is less costly than desalination, and is necessary to maximize value from the diversified
supply mix which is considerably more expensive than single source surface water.
Indicative target time‐frames to implement Target Unit Costs and uncertainty (Rand per thousand liters)
20
Surface
300 (60)
Yield (million liters per day)
15 +50%
Desalination
(120)
200
10 +33%
Reuse +25%
(70) Desalination
100 +20%
5 Re‐use
Ground +120
Ground Surface
+70
(100) +100
+60
0 0
0 12 24 36 48 0 100 200 300 400
Time to implement (months from a firm commitment to proceed) Additional supply ‐ Million liters per day (MLD)Reviewing Augmentation – focus on long-term resilience SUPPLY
SIDE
DWS is responsible for implementing surface water schemes which form part of the reconciliation strategy. Responsibility for non-
surface water schemes has not been conclusively defined. Where groundwater enters the municipal reticulation system, it
appears logical to be a municipal responsibility. Similarly, treating municipal wastewater to potable standard would be a
municipal responsibility.
Cape Town has committed to augmentation to improve the City’s water security:
• Groundwater: the combined yield in the first phase provides ~100MLD. The cost of operating schemes will determine the speed of roll-out,
and once the Phase 1 schemes are operational, the development of further phases and schemes will be easier;
• Re-use: Water re-use schemes include both recharge of CFA as well as treating wastewater to drinking water standard at Faure treatment
plant to provide 70MLD. Depending on the growth required, this could be extended to other wastewater treatment works around the
metro;
• Desalination: Given the cost and complexity of desalination projects, the city is considering initiating a project at the right time providing
for expansion, probably in increments of ~50MLD.
AUGMENTATION DELIVERING WATER IN THE CURRENT HYDROLOGICAL
YEAR INCLUDES:
• Springs & rivers – consistent yield of 7.5MLD increasing during rainy
season;
• Atlantis aquifer – sustained yield of 12 MLD;
• Temporary desalination – maximum yield of 16MLD. To date this has
peaked at ~8MLD with Monwabisi 7MLD to come into system in July;
• Temporary transfers – Groenland transfer provided 7MCM (million
cubic meters) in the first quarter of 2018.Reviewing Augmentation – focus on long-term resilience SUPPLY
SIDE
AUGMENTATION PROJECTS COMMITTED TO AND IN PROGRESS:
• Cape Flats Aquifer: License conditions provide for extraction of 20MCM/year in Phase 1, 25MCM/yr in Phase 2 and 30MCM in Phase 3. this
translates to a sustainable yield of 55 – 83MLD and a peak yield of between 83 – 124MLD. Conditions have been such that progress has been
slower than planned, but the yields specified within the license conditions are the ultimate target for permanent augmentation. The license
conditions further require artificial recharge of between 12 – 25MCM for the three phases, for which the projects are in design;
• Table Mountain Group aquifer: License conditions cover three phases at a number of locations providing for a yields of between 42 & 130
MCM/yr translating to 115 – 355MLD sustainable yield. As with CFA, it may take considerably longer than originally planned to realise the yield
but work will continue until the licensed yields are achieved. Due to environmental sensitivities, initial work will be confined to Steenbras which
license provides for 12-35MCM translating to 33-96MLD over the three phases;
• Atlantis & Silwerstroom aquifer: potential for an additional 20MLD – injection into the system in design;
• Berg River Voelvlei augmentation scheme (BRVAS) in progress by DWS to yield 60MLD by 2021;
• Zandvliet temporary re-use scheme was part of the section 29 projects funded in Dec 2017, and will be complete towards the end of 2018;
• Faure permanent re-use: This project is in design to provide 70MLD (expandable to 90MLD) of re-use water from Zandvliet & potentially
Macassar into the water supply from Steenbras at Faure water treatment plant;
• Alien vegetation clearing: The impact of unmanaged aliens on the system yield has been calculated to be in the region of 20MCM. The city
has accelerated programs in its own catchment areas and will work with other spheres of government and stakeholders to cover all relevant
catchments.
AUGMENTATION STILL TO BE TRIGGERED:
• Permanent desalination: procurement of a permanent desalination plant has not commenced. a project is in progress to enable water
quality sampling over an extended period to feed into the site selection process for permanent desal. While the immediate requirement to
augment supply has not been agreed, undertaking an updated feasibility study is seen as a no-regret endeavor.
• Further augmentation through WCWSS reconciliation strategy: The reconciliation strategy is currently being updated by the WCWSS,
incorporating the updated hydrology and the impact of the three-year drought. For Cape Town alone, accounting for anticipated growth
will require an additional 30MLD every year. Additional water schemes will thus be a requirement into the future.Summary
DEMAND
& SUPPLY
1. Collaborate with DWS to lower restrictions responsibly before end of hydrological year (31 October) to provide
relief to customers, while continuing to manage and monitor dam behaviour and rainfall;
2. Develop an integrated Cape Town Water Strategy which will crystallise the financial impact and governance
issues surrounding the of level of assurance, optimal augmentation volume, timing and water sources;
3. Continue demand management initiatives (in line with NDWS restriction of 45% saving required);
4. Continue work on augmentation projects, focus shifted to sustainability and cost efficiency:
• Decisions under consideration by the City on optimal augmentation types, volumes, methods;
• Groundwater projects (Atlantis, Cape Flats and TMG Aquifers) have been prioritised including Aquifer
recharge projects from treated wastewater;
• Long-term Permanent Re-use project under development;
• Long-term Permanent Desalination under evaluation in terms of siting, optimum yield & procurement
method;
4. Continue managing financial impacts through appropriate adjustments to the tariff structure and level. Monitor
tariff revenues as a result of significant shifts in demand patterns and a steeply inclining block tariff;
5. Continue efforts to improve coordination and leadership within and between spheres of government;
6. Continue to improve information flows and consistency of messaging; actively engage citizens and stakeholders
to encourage active citizenry and stakeholder partnerships to jointly solve problems.Thank You http://www.capetown.gov.za/thinkwater
You can also read