The Relation of Nitrate and Phosphate to Phytoplankton Abundance in the Upstream Citarum River, West Java, Indonesia
←
→
Page content transcription
If your browser does not render page correctly, please read the page content below
Asian Journal of Fisheries and Aquatic Research

                             11(5): 21-31, 2021; Article no.AJFAR.65512
                             ISSN: 2582-3760

            The Relation of Nitrate and Phosphate to
  Phytoplankton Abundance in the Upstream Citarum
                         River, West Java, Indonesia
                  Kristina Marsela1*, Herman Hamdani1, Zuzy Anna1 and Heti Herawati1
              1
               Faculty of Fisheries and Marine Science, Universitas Padjadjaran, Jatinangor, Indonesia.

                                                                                              Authors’ contributions

        This work was carried out in collaboration among all authors. Author KM designed the study,
performed the statistical analysis, wrote the protocol and wrote the first draft of the manuscript. Author
      HH and ZA managed the analyses of the study. Author HH managed the literature searches. All
                                                        authors read and approved the final manuscript.

                                                                                                   Article Information

                                                                                    DOI: 10.9734/AJFAR/2021/v11i530216
                                                                                                                  Editor(s):
     (1) Dr. Emmanuel Tetteh-Doku Mensah, CSIR-Water Research Institute Aquaculture Research and Development Centre,
                                                                                                                    Ghana.
                                                                  (2) Dr. Pınar Oguzhan Yildiz, Ataturk University, Turkey.
                                           (3) Dr. Ahmed KARMAOUI, Southern Center for Culture and Sciences, Morocco.
                                                                                                                Reviewers:
                              (1) Renata Dondajewska-Pielka, Uniwersytet im. Adama Mickiewicza Wydział Biologii, Poland.
                                                                (2) Nita Rukminasari, Universitas Hasanuddin, Indonesia.
                                             Complete Peer review History: http://www.sdiarticle4.com/review-history/65512

                                                                                         Received 03 January 2021
  Original Research Article                                                               Accepted 06 March 2021
                                                                                          Published 17 March 2021

ABSTRACT

 Citarum River is the longest river in West Java Province, it is utilized for various anthropogenic
 activities that will affect the water quality, ecological state, and parameters of nitrates and
 phosphates in the waters of Citarum River. Nitrate and phosphate content can affect Phytoplankton
 abundance. Phytoplankton is a bioindicator to determine water quality. The purpose of this study is
 to determine the association of nitrates and phosphates with the abundance of phytoplankton and
 determine the quality of water in the Citarum River. The study began in August 2020 until
 September 2020. The research uses a survey method with a purposive sampling technique.
 Sampling was carried out at 5 stations with 5 times repetitions every 7 days. The water parameter
                                                                             2-     -
 analyzed are transparency, temperature, current, pH, DO, BOD, PO4 ,NO3 , Phytoplankton
 abundance, diversity index, and dominance index. Results showed that phytoplankton in the
 citarum river there were 24 genera divided into 4 phylum. Diversity index during the study reached
 between 0,91 – 0,99 and dominance index was in the range 0,01 – 0,2. Phytoplankton abundance
_____________________________________________________________________________________________________

*Corresponding author: Email: Kristina17001@mail.unpad.ac.id;
Marsela et al.; AJFAR, 11(5): 21-31, 2021; Article no.AJFAR.65512
ranges from 11 to 1292 ind/L. The highest genera phytoplankton composition at each station was
found is Synedra as much as 1087 ind/ L. Nitrate content ranges from 0.13 - 0.33 mg/l and
phosphate content range from 0.13 - 0.29 mg/l. The acquisition of R square value based on the
simultaneous analysis of the relationship between nitrate and phosphate and the abundance of
phytoplankton was 43,9% and 56,1% was influenced by other several factor namely temperature,
water transparency, nutrient, and water flow.
Keywords: Citarum river; nitrate; phosphate; phytoplankton.
1. INTRODUCTION includes temperature measurement, pH, DO,
water flow, and light transparency, whereas ex-
Citarum River is the longest river in West Java situ research includes measurement of nitrate,
Province, sourced from Mount Wayang, Kertasari phosphate, BOD, and plankton identification. The
District, Bandung Regency [1]. Utilization of research was conducted in August-September
Citarum River to support various activities and 2020. Samples were taken from 5 stations with 5
human lives as a source of water, transportation samplings. Research location:
facilities, power plant, irrigation, industrial needs,
tourism, and fishery development [2]. Citarum Station 1: Cisanti Spring, the foot of Mount
River now is one of the river with the worst Wayang – South Bandung covers the condition
pollution levels in the world [3]. of the natural waters. The use of the surrounding
land is the primary forest.
The problems in the upstream Citarum River is
that the river is polluted by domestic waste, Station 2: Situ Cisanti, the outlet where the
agricultural waste, and industrial waste. The surrounding land use is the primary forest.
waste discharge into the river flow without prior
treatment so the water river becomes polluted Station 3: Wangisagara, is a part of the river
and affects the water quality [1]. The continuous indicated by agricultural waste such as fertilizers,
influx of waste will have an impact on the ecology pesticides, livestock manure. The use of
of the river. Disposal of agricultural and domestic surrounding land is a residential area and
waste can affect the chemical parameters of the agricultural land.
waters namely nitrates and phosphates [4].
Station 4: Majalaya, the surrounding land use is
a residential and industrial area.
Nitrates and phosphates in the water are utilized
by phytoplankton for growth and development Station 5: Sapan, covering the area after the
[5]. Plankton is one of the Phytoplankton is the meeting of 3 rivers namely Citarum River, Citarik
first organisms affected due to the input load river and Cikerus river. The use of surrounding
received by the waters. Phytoplankton is aquatic land is a residential area, agriculture, and various
organisms that can be used as bioindicators to industrial activities.
determine the quality and fertility rate of the
waters because phytoplankton have a high The location of the research station can be seen
sensitivity to environmental changes and a short in Fig. 1.
life cycle [6]. Therefore, it is necessary to
research nitrate and phosphate content in the 2.2 Sampling and Measurement
water to know the abundance of phytoplankton
as an indicator of the quality of citarum river A sampling of water and phytoplankton was
waters. carried out every seven days with five sampling
times at five stations. Physical-chemical
2. MATERIALS AND METHODS parameters of water analyzed in-situ and ex-situ.
In- situ analysis consisted of five parameters
2.1 Research Time and Place include temperature, pH, DO, Water
Transparency, and Current. Ex-situ analysis
The research was conducted in citarum consisted four parameters BOD, Nitrate, and
watershed. The method used in the research is Phosphate. Physical-chemical parameters
the survey method and the sampling technique is analyzed in-situ and ex-situ. Ex-situ analysis
purposive sampling. The research activities were conducted at the Laboratory of Water Resource
conducted in situ and ex-situ. Insitu research Management FPIK UNPAD.
22Marsela et al.; AJFAR, 11(5): 21-31, 2021; Article no.AJFAR.65512
Fig. 1. Map of research location
2.3 Sample Analysis D = ∑(
2
)
Plankton data analysis was carried out using a Description:
comparative descriptive method at each station
with the following observations. D = Simpson Domination Index
2.3.1 Plankton abundance ni = Number of individuals on the 1st type
N = Total number of individuals
Plankton abundance is calculated using the
formula [7]: 2.3.4 Relation analysis
The relationship between nitrates and
N=nx x phosphates to phytoplankton abundance was
analyzed using multiple linear regression with
Description: SPSS application version 26. The formula of
multiple linear regression is as follows [9]:
N = Abundance of plankton (ind/L)
n =Number of plankton identified Y= a+b1X1 ± b2X2
Vr =Filtered plankton volume
Vo =Observed volume of plankton Description:
Vs = Volume of filtered water (L)
Y = Abundance of Phytoplankton
2.3.2 Diversity Index a = Constant
b1, b2 = intercept
Diversity index formula according to Simpsons X1, X2 = independent variable (nitrate and
[8]: phosphate)
2
H' = 1-∑( ) 3. RESULTS AND DISCUSSIONS
Description: 3.1 Parameters of Waters Quality
H' = Diversity Index The physical and chemical parameters of the
ni = Number of individuals on the 1st type water during the study can be seen in Table 1.
N = Total number of individuals Citarum river temperatures measured during
observation ranged from 20,8°C -29.4°C. Based
2.3.3 Domination index on research conducted by [10] temperature
measurements during the observation show that
Calculating uniformity used simpson domination the temperature in the Upper Citarum River
index as follows[9]: ranges from 19.7°C-27.9°C. This shows that the
23Marsela et al.; AJFAR, 11(5): 21-31, 2021; Article no.AJFAR.65512
temperature in the Upstream Citarum River has m/s), moderate (0,25-0,50 m/s), fast (0,50-1
not changed significantly. Citarum river m/s)and very fast (more than 1 m/s) [16]. High
temperature is optimal for phytoplankton growth. current speed in the water can cause plankton
The optimum temperature range for abundance to be small [17]. Plankton movement
phytoplankton growth in the water is 20°C - 30°C is very limited and is heavily influenced by
[11]. There is a difference in temperature in currents [7].
citarum river, the lowest temperature is at station
o
1 which is 23,3±1.9 C because around the Measurement of acidity degree (pH) in Citarum
sampling location there is vegetation covering River ranges from 5.95-6.82. Based on the
the sampling location so that the sunlight is less observations of [10], the pH in the upstream
than maximum, while the top temperature is at Citarum River ranged from 7.19 to 8.53 indicating
station 5 which is 26.4±1.6oC. Water temperature an insignificant difference in pH values. Station 1
is influenced by sunlight intensity, geographical has the highest pH value which is 6.48±0.35,
height and tree cover (canopy) factors from the while the lowest pH is found in Station 5 and 4
surrounding vegetation [9]. The higher the which are 6.35 ±0.18 and 6.35±0.09. Factors that
intensity of solar radiation that hits the body of influence changes in pH values include biological
water, it will cause the higher the water activity, namely photosynthesis and respiration of
temperature of the river [12]. organisms, temperature, and the presence of
ions in the water [18]. PH value is based on
The depth of each station is different so there are government regulation no 82 of 2001 which is
differences in light transparency. Measurements between 6,00 – 9,00, therefore the pH value is
of light transparency in the waters of the citarum still below the quality standard limit. Aquatic
river during the study ranged from 9 to 155 cm. organisms, especially plankton can live ideally in
Based on the results of research conducted by a smaller pH range slightly larger than a pH
[10], there are differences in light transparency, value of 7 [19].
the transparency value ranges from 17.6 cm -
96.3 cm. The difference in the value of light Dissolved oxygen parameters can determine the
transparency is due to the decrease in quality of water because it plays a role in the
suspended solids in the observed waters. Station oxidation process of organic and inorganic
5 has the lowest light transparency which is 29.1 materials [20]. The measurement of dissolved
± 14.6 cm because influenced by the pollutant oxygen value during observation in Upstream
loads that enter the water so that it blocks the Citarum River ranged from 6.2-9.4 mgO2/L.
penetration of light into the water. Station 5 has a Based on the observation of [10] the value of
brownish cloudy watercolor due to indicated dissolved oxygen ranged from 0,72–6,22 mgO2/L
industrial and household waste disposal. Station show a significant change in the value of DO.
1 has the highest light transparency during the Dissolved oxygen content to five stations varied,
measurement is at Station I which is 151.5 ± 3.3 Station 1 had the highest dissolved oxygen
cm, the location of the water is still natural. content of 7.52±0.8 mgO2/L. The lowest
Suspended solids concentration in water can dissolved oxygen value was found at Station 5 of
affect the intensity of incoming sunlight [11]. 7.08±0.51 mg/l. Station 5 is indicated by
Optimum light intensity for plankton is 30–50 cm household, industrial and agricultural waste.
[13]. Waters that have too high light transparency Station 5 has the highest BOD content among
will decrease phytoplankton abundance, due to the other 4 stations, the high organic matter
reduced food and plankton properties that move content in the waters will reduce the oxygen
away from light [14]. The intensity of sunlight that content. Human activities such as agriculture and
is too high will cause the inhibition of waste disposal can lead to a decrease in
photosynthesis or is called photoinhibition [15]. dissolved oxygen concentration [21]. Dissolved
oxygen in the waters is used by organisms for
The current speed range during a measurement the process of respiration and breaks down
is between 0.02-0.38 m/s. The highest current organic substances into inorganic substances.
speed is found in station 5 which is 0.33 ± 0.09 Oxygen levels are lower along with the increased
m/s and the lowest current speed is found in activity of microorganisms to decompose organic
station 2 which is 0.03 ± 0.01 m/s. The average substances into inorganic substances using
flow in the waters of the Upstream Citarum River dissolved oxygen [22]. According to the criteria of
is still categorized as very slow flow. There are government regulation no 82 of 2001 the range
five categories of currents, namely very slow of value appropriate for fisheries which range
currents (less than 0,10 m/s), slow (0,10-0,25 from > 3 – 4 mgO2/L. Furthermore, DO
24Marsela et al.; AJFAR, 11(5): 21-31, 2021; Article no.AJFAR.65512
2-
concentration in Upstream Citarum River still mgPO4 /L while the lowest phosphate value is at
supported the growth of phytoplankton. Station 4 is 0.21±0.05 mgPO42- / L. The content
Phytoplankton generally lived well because of phosphate in water is influenced by the
oxygen concentration at each station were more disposal of industrial waste and domestic waste
than 3 mgO2/L [23]. from the environment around the river [27]. The
optimal phosphate content for phytoplankton
BOD5 values in the waters indicate the level of growth ranges from more than 0.2 mgPO42- / L.
pollution and can affect the dissolved oxygen [28]. According to the criteria of government
concentration in the waters so that dissolved regulation, no 82 of 2001 for Phosphate is 0,2
oxygen is reduced [20]. Measurement of BOD5 mgPO42- / L, so the measurement results show
value in Citarum River waters has a value that the phosphate content in Upstream Citarum
between 0.3 mg / l to 6,5 mg / l. Based on the River is in accordance with the established
observation of [10] the BOD5 value during quality standards.
observation in Upstream Citarum River ranged
from 4,04–20,88 mgBOD5/L, this indicates a 3.2 Phytoplankton Abundance, Diversity
significant decrease in the BOD5 value in the Index, and Domination Index
upstream Citarum river. The highest BOD value
is at Station 5 which is 4.7±1.8 mgBOD5 /L while Based on observation and identification of
the lowest BOD5 value is at Station 1 which is phytoplankton in Citarum River, phytoplankton.
1.4±0.8 mg / l. High BOD5 values can be The identification of phytoplankton in citarum
influenced by the disposal of organic materials river is 24 genera divided into 4 Phylum namely
derived from domestic waste and other waste Cyanophyta, Chlorophyta, Euglenophyta, and
into the river [24]. According to the criteria of Chrysophyta as shown in Table1. The total
government regulation, no 82 of 2001 for BOD is abundance of phytoplankton at each station
3 mgBOD5/L. The measurement result show that varies, which ranges from 11 to 1292 ind/L
the BOD content of 3 river points namely stations across the observation stations. This difference
2, 4, and 5 Citarum Rivers exceeds the specified in abundance was possible because of the
quality standard. difference in the water quality between those
station. The distribution of phytoplankton across
Measurement of nitrate content in citarum river the station is influenced by variation in physical
waters ranges from 0.13 mgNO3-/L to 0.33 and chemical factors in the waters such as
-
mgNO3 /l. The highest nitrate content is at Station temperature, current, pH, DO, and nutrient
5 which is 0.27±0.06 mgNO3-/l while the lowest content [29].
nitrate content is at Station 2 which is 0.20±0.05
-
mgNO3 /l. The nitrate content in the Citarum river Based on the table above, it can be seen that the
is below the optimum rate for phytoplankton highest abundance of phytoplankton at station 1
-
growth, which ranges from 0.13 - 0.33 mgNO3 / is the Crysophyta phylum, while the lowest
L, while the optimum nitrate content for plankton abundance is Euglenophyta phylum. The
-
growth is 0.9 - 3.5 mgNO3 / L [25]. Nitrate highest total abundance was found in the 5th
content in the waters of citarum river shows observation wich is equal to 15 ind/L.
oligotrophic waters, the concentration of nitrate in
waters range between 0 to 1 mg / l is indicated Based on the table above, it can be seen that the
oligotrophic water [26]. Nitrate in water is highest abundance of phytoplankton at station 2
produced from the nitrogen oxidation process is the Crysophyta phylum, while the lowest
that is stable and easily soluble [11]. Based on abundance is Euglenophyta phylum. The highest
th
Government Regulation No. 82 of 2001 total abundance was found in the 4 observation
concerning Water Quality Management and wich is equal to 76 ind/L.
Pollution Control in connection with the Based on the table above, it can be seen that the
classification and criteria for class II wastewater highest abundance of phytoplankton at station 3
quality standards, the threshold value for nitrate is the Crysophyta phylum, while the lowest
-
in waters is 10 mgNO3 / L, meaning that the abundance is Euglenophyta phylum. The
results obtained are far below the specified highest total abundance was found in the 4th
threshold. observation wich is equal to 1292 ind/L.
The content of phosphate watered based on Based on the table above, it can be seen that the
observations in Citarum River has a range highest abundance of phytoplankton at station 4
2-
between 0.13-0.29 mgPO4 / L. The highest is the Crysophyta phylum, while the lowest
phosphate value is in Station 2 is 0.242±0.04 abundance is Euglenophyta phylum. The highest
25Marsela et al.; AJFAR, 11(5): 21-31, 2021; Article no.AJFAR.65512
th
total abundance was found in the 5 observation phosphate to phytoplankton abundance in the
wich is equal to 179 ind/L. Upstream Citarum River through multiple linier
regression analysis shows positive regression
Based on the table above, it can be seen that the with linier equations:
highest abundance of phytoplankton at station 5
is the Crysophyta phylum, while the lowest Y = - 4515,065–16907,441nitrat + 35902,517
abundance is Euglenophyta phylum. The highest fosfat
th
total abundance was found in the 4 observation
which is equal to 379 ind/L. The five tables above The correlation coefficient (r) obtained based on
show that the highest abundance of the analysis was 0,662. The value variable one
th with another variable has a strong correlation
phytoplankton is at the 4 observation station 3,
which is 1292 ind/L. While the lowest abundance value, it is because 0,662 is found in the interval
is at station 1, the second observation. Genus of correlation coefficient (r) between
with the highest abundance was Synedra at 1087 interpretations 0,60 – 0,799 show a strong
th influence [33]. Research on the relationship of
ind / L at the 4 observation at station 3. Station
3 is indicated by agricultural waste such as nitrate and phosphate with phytoplankton
fertilizers, pesticides, livestock manure, and also abundance was also conducted by [32] in the
household waste, while Station 1 is natural water waters of Bremi River. The coefficient correlation
with clear watercolor. High nutrient content can (r) 0,60 – 0,799 means that the variable have a
affect phytoplankton abundance [6]. The diversity strong correlation with each other. This indicates
of Bacillariophycea in waters can used as a that nitrate, phosphate, and phytoplankton have
bioindicator in monitoring water quality. If in water a strong relationship in the waters of Bremi River.
dominated by species from class
Bacillariophyceae, then aquatic can indicated According to the results of the calculation of the
contamination [27]. Synedra is a phytoplankton individual parameter test (t statistic test), the
class Bacillaryophyceae, Synedra can be used value of t hit nitrate < t table is -3,562 < 2,07387,
as an indication of declining water quality [30]. so there is no effect of variable nitrate on
Synedra able to live with low DO conditions and phytoplankton abundance partially. Nitrate in
found in waters in lightly polluted conditions [31]. water is produced from the nitrogen oxidation
The diversity index shows the relationship process which is stable and soluble [11]. Nitrates
between the number of species and the number and phosphates in the waters are used by
of individuals who make up a community [32]. phytoplankton for photosynthesis [34]. The
nitrate content in Upstream Citarum River is
Based on observational data Simpson diversity below the optimum rate for phytoplankton
index during the study ranged from 0.94 to 0.98. growth, which ranges frow 0,13 – 0,33 mgNO3-/L
Simpson's index value during observations while the optimum nitrate content for plankton
showed that diversity to the five stations was growth is 0,9 – 3,5 mgNO3-/L [25].
high. Index values approaching 0 indicate low
diversity and when the index value is close to 1. The t test for the phosphate parameters showed
that the phosphate t hit > t table was 4.129 >
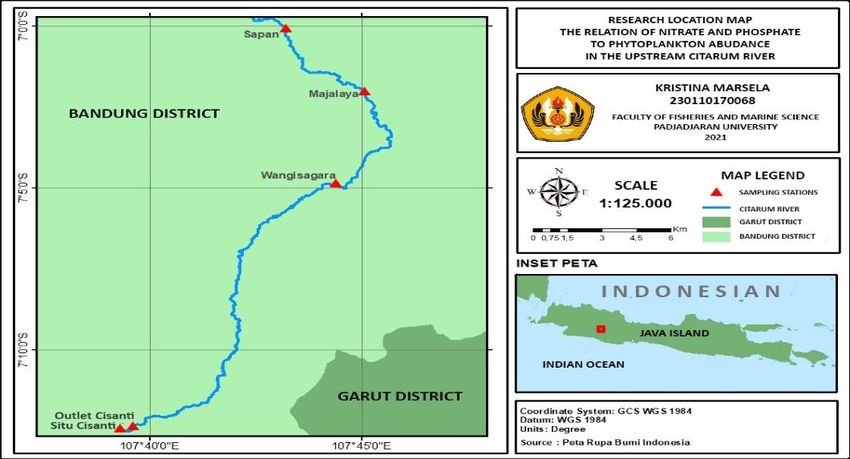
Based on the observation data to the five 2,07387, so there was an effect of the phosphate
stations there are no individuals who dominate in variable on the abundance of phytoplankton. The
the waters. The domination index range from 0 to phosphate content measured during observation
1, the smaller the velue of the domination index 3-
in the Citarum River was 0,13 – 0,29 mgPO4 /L.
then indicates that no species dominate, while This shows the optimum number for
the greater the value of the domination index phytoplankton growth ranges from more than 0,2
then indicates the presence of certain species 3-
mgPO4 /L [17].
that dominate [9].
Coefficient of determination (R2) = 0,439. The
3.3 The Relationship of Nitrate and results showed that the abundance of
Phosphates to the Abundance of phytoplankton simultaneously influenced by
Phytoplankton nitrate and phosphate content of 43,9% and
56,1% was influenced by other factors. Factor
The abundance of phytoplankton in the waters supporting the phytoplankton growth are very
affected by several environmental parameters. complex and interacting between physical and
Nitrate and phosphate is the most relevan chemical factors, such as dissolve oxygen,
macronutrients are needed for phytoplankton temperature, availability of nutrients such as
growth [15]. The relationship of nitrate and nitrate and phosphate [25].
26Marsela et al.; AJFAR, 11(5): 21-31, 2021; Article no.AJFAR.65512
Table 1. Water quality at the sampling station
Water Parametes Station
I II III IV V
Temperature(oC) Range 20,8-25,2 22-28,1 23,5-29,4 21,6-27,7 23,6-27,6
Average 23,3±1,9 25,8±2,4 25,9±2,2 26±2,6 26,4±1,6
Water transparancy Range 152-155 42-59,2 11,7-61 9-43,5 15,2-49,5
(cm)
Average 151,5±3,3 55,6±7,4 48,2±20,2 29,1±12,5 29±14,6
Current (m/s) Range 0,02-0,09 0,02-0,05 0,03-0,25 0,12-0,46 0,23-0,46
Average 0,06±0,03 0,03±0,01 0,17±0,09 0,2±0,15 0,33±0,09
pH Range 5,95-6,75 6,08-6,82 6,21-6,81 6,07-6,52 6,25-6,45
Average 6,48±0,35 6,37±0,28 6,41±0,24 6,35±0,18 6,35±0,09
DO Range 6,3-8,5 6,2-9,4 6,7-8 5,6-8,7 6,5-7,8
Average 7,52±0,8 7,38±1,25 7,26±0,53 7,12±1,14 7,08±0,51
BOD Range 0,3-2,3 2,3-4,9 0,3-2,6 2,9-4,2 2,0-6,5
Average 1,4±0,8 3,4±0,9 1,8±1,0 3,6±0,5 4,7±1,8
Nitrate Range 0,17-0,27 0,13-0,25 0,20-0,33 0,22-0,29 0,17-0,32
Average 0,23±0,04 0,20±0,04 0,24±0,05 0,25±0,03 0,27±0,06
Phosphate Range 0,21-0,28 0,19-0,28 0,16-0,28 0,12-0,25 0,20-0,26
Average 0,24±0,03 0,24±0,04 0,24±0,04 0,2±0,05 0,24±0,02
Table 2. Phytoplankton abundance at station 1
Spesies Abundance (ind/L)
st nd rd th th
1 2 3 4 5
Cyanophyta Oscillatoria 1 1 1 2 1
Chlorophyta Crucigeniea 0 0 2 0 0
Pediastrum 1 2 2 0 1
Scenedesmus 1 1 0 0 3
Closterium 0 1 1 1 0
Penium 0 0 0 1 1
Chrysophyta Surirella 2 2 1 1 1
Synedra 2 2 1 3 5
Navicula 0 1 1 1 0
Melosira 0 0 0 1 1
NItzschia 3 0 5 2 0
Bacillaria 1 1 1 2 1
Euglenophyta Euglena 1 0 0 0 1
Abundance 12 11 13 14 15
1.2 0.94 0.97 0.98
0.97
Simpson Diversity Index
0.98
1
0.8
0.6
0.4
0.2
0
I II III IV V
Station
Fig. 2. Simpson diversity index
27Marsela et al.; AJFAR, 11(5): 21-31, 2021; Article no.AJFAR.65512
Table 3. Phytoplankton abundance at station 2
Filum Spesies Abundance (ind/L)
st nd
1 2 3rd 4th 5th
Cyanophyta Oscillatoria 1 4 1 5 0
Phormidium 1 0 0 0 0
Chrysophyta Bacillaria 4 8 0 16 0
Tabellaria 1 0 1 4 1
Cyctotella 2 2 2 1 4
Cymbella 0 0 1 0 0
Surirella 3 3 0 1 4
Ephitema 0 0 1 0 0
Synedra 4 5 3 16 3
Navicula 7 1 19 7 5
Nitzschia 10 10 32 5 2
Chlorophyta Pediastrum 3 3 5 3 13
Scenedesmus 1 1 2 16 13
Closterium 1 2 0 1 0
Penium 0 0 2 0 1
Euglenophyta Euglena 0 0 0 0 1
Abundance 38 39 68 76 48
Table 4. Phytoplankton abundance at station 3
Filum Spesies Abundance (ind/L)
st nd rd th th
1 2 3 4 5
Cyanophyta Anabaena 2 0 0 5 0
Spirulina 0 0 0 0 0
Oscillatoria 1 0 2 1 2
Phormidium 1 1 7 2 4
Chrysophyta Bacillaria 14 8 26 22 5
Cyctotella 0 0 1 0 0
Tabelaria 1 0 25 1 0
Leptocylindrus 0 0 1 0 0
Cymbellia 0 0 0 1 0
Surirella 0 2 1 3 2
Synedra 365 419 492 1087 820
Asterionella 0 0 8 10 0
Navicula 7 1 7 13 10
Melosira 3 0 1 1 0
Nitzschia 57 56 68 144 32
Chlorophyta Ulothrix 0 0 0 0 0
Closterium 2 0 1 1 3
Penium 0 2 1 2 5
Euglenophyta Euglena 0 0 0 0 1
Abundance 453 489 640 1292 884
28Marsela et al.; AJFAR, 11(5): 21-31, 2021; Article no.AJFAR.65512
Table 5. Phytoplankton abundance at station 4
Abundance (ind/L)
Filum Spesies st nd rd th th
1 2 3 4 5
Cyanophyta Oscillatoria 7 6 2 17 1
Anabaena 1 2 0 0 0
Spirulina 0 1 0 4 4
Chrysophyta Bacillaria 6 6 0 3 6
Cyctotella 2 6 0 2 2
Leptocylindrus 3 4 1 5 0
Cymbellia 0 0 0 6 0
Surirella 1 0 1 1 2
Synedra 14 31 19 11 79
Navicula 37 5 48 1 3
Nitzschia 14 27 48 1 78
Chlorophyta Scenedesmus 0 1 0 0 1
Ulothrix 0 2 0 12 1
Closterium 0 1 0 9 2
Penium 0 1 1 0 0
Euglenophyta Euglena. 1 2 1 9 0
Abundance 86 90 122 81 179
Table 6. Phytoplankton abundance at station 5
Filum Spesies Abundance (ind/L)
st nd
1 2 3rd 4th 5th
Cyanophyta Spirulina 17 0 0 4 8
Oscillatoria 26 45 65 216 99
Chrysophyta Bacillaria 3 57 37 37 23
Cyctotella 7 2 1 5 5
Leptocylindrus 0 1 1 1 1
Surirella 3 0 0 4 9
Synedra 32 6 25 218 73
Navicula 7 0 0 4 6
Melosira 2 4 7 7 3
Nitschia 37 18 23 16 10
Chlorophyta Pediastrum 0 3 0 0 0
Ulothrix 3 5 1 0 2
Closterium 1 0 0 3 9
Penium 0 0 0 0 3
Hyalotheca 1 0 0 0 0
Euglenophyta Euglena 0 8 0 8 7
Abundance 139 149 160 379 206
29Marsela et al.; AJFAR, 11(5): 21-31, 2021; Article no.AJFAR.65512
0.4
0.3
Dominance Index 0.2
0.09
0.1
0.02 0.03 0.02
0.01
0
I II III IV V
-0.1
-0.2
Station
Fig. 3. Dominance index
4. CONCLUSION 4. Patricia C, Astono W, Hendrawan DI.
Nitrate and phosphate content in Ciliwung
River. Jur Tech. It's a curve. Fak. Arsit.
Landscape and Teknol. It's a curve. Univ.
Phytoplankton identified during the study were 24 Trisakti. 2018;4(1):179–185.
genera from 4 phyllum. Diversity index and index 5. Mustofa A. Nitrate and pospat content as a
of dominance during research respectively factor in the fertility rate of coastal waters.
ranged from 0,94 to 0,98 and 0,01 to 0,09. J Dispotek. 2015;6(1):13–19.
Synedra has the highest abundance of 1087 6. Maresi SRP, Yunita E, Priyanti.
ind/L. Synedra is one of the plankton class Phytoplankton as bioindicators of the
Cyanophyceae, the dominance of the Synedra it waters there Bulakan Tangerang City.
can be used as an indication of declining water 2015;8(2):113–122.
quality. 7. Sachlan M. Planktonology. Semarang:
Faculty of Fisheries and Marine Sciences.
COMPETING INTERESTS Diponegoro University; 1982.
8. Zahidah. Phytoplankton community in the
Authors have declared that no competing floating net Karamba Zone (Kja) and Non
interests exist. Kja In Cirata Reservoir. J Akuatika; 2004.
9. Odum EP. Ecological Fundamentals.
REFERENCES Yogyakarta: Gajah Mada Press University;
1998.
1. Director General of Health Efforts. Action 10. Putra Zahidah AW, Lili W. Plankton
Plan. Sekr Action Plan. Directorate community structure in Citarum River Hulu
General of Health Efforts. Ministry. West Java. J Perikan and Kelaut. 2012;
Healthy. 2015–2019; 2016. 3(4):313–325.
2. Hendratta L, Sumarauw JSF. Analysis of 11. Effendi H. Water quality study for resource
discharge and water level of Tondano management and aquatic environment.
River at Kuwil Village Bridge Kalawat Jakarta: Kanisius; 2003.
Subdistrict. J Sipil Statik. 2017;5(4): 12. Marlian N. Analysis of variations in
175-185. concentrations of Nitrogen, Phosphate and
3. Imansyah MF. General Study of das Silicate Nutrients (N, P And Si) in the
citarum problems and solutions and waters of Meulaboh Bay, West Aceh.
government policy analysis. J Aquat Sci A. 2016;1:1–6.
Sociotechnology. 2012;25(11):18–33,
30Marsela et al.; AJFAR, 11(5): 21-31, 2021; Article no.AJFAR.65512
13. Boyd C. Water quality and water quality 24. Rahayu S, Tontowi. Research on water
management in aquaculture. Aquaculture. quality of bengawan solo during the dry
1985;1–20, season. J Sumberd It. 2009;5(2):127–136.
14. Goldman, Horne AS. Study state growth of 25. Wardoyo STH. Water quality management
phytoplankton in continous culture: center for environmental resource
Comparison of internal and external management studies. Bogor: Ipb Press;
nutrien equation. CR J Phycol. 1983;13(3): 1982.
251–258. 26. Iswanto C, Hutabarat S, Purnomo PW.
15. Zahidah, Marine productivity. Bandung: Analysis of aquatic fertility based on
Unpad Press; 2020. diversity of Plankton, Nitrates and
16. Welch E, Lindell T. Ecological effect of Phosphates in Jali River and Slope River
waste water. Cambridge University Press; of Keburuhan Village, Purworejo. J
1980. Maquares. 2015;4(3):84-90.
17. Nugroho A. Water quality bioindicator. 27. Isti'anah D, Huda MF, Laily AN. Synedra
Jakarta: Trisakti University; 2006. Sp. As Microalgae Found In Besuki Porong
18. Pescod MD. Investigation of rational Sidoarjo River, East Java. Bioeducation.
effluen and stream standards for tropical 2015;8(1):57-59.
countries. Bangkok: U.S. Army Research 28. Heddy S, Kurniati M. Basic principles of
and Development Group; 1973. ecology. Jakarta: Pt King Grapindo
19. Sahidin A, Nurruhwati I, Riyanti I, Triandi Persada; 1996.
M. Structure plankton communities in 29. Cui L, et al. Relationship between
Cijulang River Pangan-Daran District, phytoplankton community succession and
West Java Province, Indonesia. World environmental parameters in Qinhuangdao
News Nat Sci An Int Sci J. 2019;128–141. Coastal areas, China: A region with
20. Asrini NK, Adnyana IWS. Rai IN. Study of recurrent brown tide outbreaks; 2018.
water quality analysis in pakerisan 30. Rangpan V. Effects of water quality on
watershed of Bali Province. J Ecotrophic. periphyton in The Pattani River, Yala
2017;11(2):101–107. Municipality, Thailand. Universitas Sains
21. Blume KK, Macedo JC, Meneguzzi A, Silva Malaysia; 2008.
LB, Quevedo DM, Rodrigues MAS. Water 31. Sugiyono. Qualitative quantitative research
quality assessment of the Sinos River, method and R&D. Bandung: Alfabeta;
Southern Brazil. Brazilian J Biol. 2010; 2007.
70(4):1185–1193. 32. Rumanti M, Rudiyanti S, Suparjo MN. The
DOI: 10.1590/S1519-69842010000600008 relationship between nitrate and phosphate
22. Patty SI, Arfah H, Abdul MS. Nutrients content with phytoplankton abundance in
(Phosphates, Nitrates), dissolved oxygen Bremi River, Pekalongan Regency. J
and Ph are related to fertility in Jikumerasa Maquares. 2014;3:168-176.
Waters, Buru Island. J. Coastal and Marine 33. Sudjana. Statistical method. Jakarta:
Trop. 2015;3(1):43. Rineka Cipta; 2006.
DOI: 10.35800/Jplt.3.1.2015.9575 34. Mackentum K. The practice of water
23. Yazwar. Plankton diversity and its relation pollution biology. Washington, D.C: United
to water quality in Parapat Lake Toba. States Departemen of interior. Federal
University of North Sumatra Medan; 2008. Water Pollution Control Administration,
Division of Technical Support; 1969.
© 2021 Marsela et al.; This is an Open Access article distributed under the terms of the Creative Commons Attribution License
(http://creativecommons.org/licenses/by/4.0), which permits unrestricted use, distribution, and reproduction in any medium,
provided the original work is properly cited.
Peer-review history:
The peer review history for this paper can be accessed here:
http://www.sdiarticle4.com/review-history/65512
31You can also read