Spatial evaluation of physicochemical properties of River Benue concerning the habitat requirements of Manatee
←
→
Page content transcription
If your browser does not render page correctly, please read the page content below
Scientific Reports in Life Sciences 2021, 2(1): 29-39
                                  DOI: http://dx.doi.org/10.22034/srls.2020.520829.1007
                                                                                                                                Research Article

Spatial evaluation of physicochemical properties of River Benue
concerning the habitat requirements of Manatee

Michael Iwar*, P.O. Egwumah1 and S.O. Olufeagba2
1
  Department of Wildlife and Range Management, Federal University of Agriculture, Makurdi, Nigeria
2
  Department of Fisheries and Aquaculture, Federal University of Agriculture, Makurdi, Nigeria.
*
  Corresponding email: michaeliwar@gmail.com; igbatimiwar@yahoo.com

Received: 21 November 2020 / Revised: 26 January 2021 / Accepted: 30 January 2021 / Published online: 4 February 2021.
How to cite: Iwar, M., Egwumah, P.O., Olufeagba, S.O. (2021). Spatial evaluation of physicochemical properties of River Benue concerning the habitat
requirements of Manatee, Scientific Reports in Life Sciences 2(1), 40-51. http://dx.doi.org/10.22034/srls.2020.520829.1007

Abstract
Spatial evaluation of the physicochemical parameters of River Benue in relation to the habitat
requirements of west African Manatee was conducted. The River was divided into four segments;
Makurdi, Abinsi, Gbajimba, and Gbaji. In each segment, ten (10) sample points were randomly selected
and the following parameters; Temperature, Dissolved Oxygen (DO), pH, Total dissolved solids, (TDS),
Electrical conductivity (EC), and Biological oxygen demand (BOD) were measured. Data collected were
subjected to statistical analysis. The result indicated that there were significant differences in the pH,
Electrical conductivity, and Biological oxygen demand (BOD) among the four study areas. The result
also indicated significant differences between the rainy season and dry season conditions of the water
body. The result indicated that Manatees were highly adaptable to the physicochemical differences
between the rainy season and the dry season.

Keywords: Habitat, Manatee, physicochemical properties, River Benue, spatial modeling

Introduction
Habitat quality has been defined as the resources and conditions present in an area that produce
occupancy- including survival and reproduction by a given organism (Verma et al. 2012). Smitha and
Shivashankar (2013) described water quality parameters to include temperature, pH, Turbidity,
Iwar et al. 2021 Scientific Reports in Life Sciences 2 (1): 29-39
conductivity, dissolved oxygen, nitrates, and phosphates. The physicochemical properties of aquatic
habitats are known to affect the biotic component of the environment in various ways (Yadav et al,
2013). An organism’s capacity and ability to survive and reproduce successfully in any habitat is a
function of how healthy its environment is. In related work, Okayi et al. (2013) reported that the record
of the Physico-chemical characteristics of Manatees in French Guiana was important in establishing the
preferred condition for the species, and therefore inference on their areas of distribution. Furthermore,
this allows us to evaluate the conservation status of the ecosystem.
According to Patil et al. (2015) EC correlates with ten other parameters such pH value, alkalinity, total
hardness, calcium, Total dissolved solids, chemical oxygen demand, chloride, and iron concentration in
water. Human activities can affect the amount of DO through the introduction of phosphates, nitrates,
ammonia, nitrates as runoff from farm fertilizers and industrial effluents. (Qureshimatva et al. 2015).
Premlata (2009) reported that dissolved oxygen gives direct and indirect information on water activities
such as microbial activities, photosynthesis, available nutrients, and stratification. Patel et al., (2012)
reported that as summer progress, DO decreases due to an increase in temperature and an increase in
microbial activities. But that at the height of summer, Do increases due to the prolonged period of
sunlight and hence temperature. Tiwari (2015) reported that DO is essential to aquatic life and that a low
DO of less than 2Mg/L would indicate a poor water quality unable to sustain life. Gorde et al., (2013)
also report that excessive algal growth can oversaturate the water with DO when the photosynthesis rate
is greater than the rate at which oxygen dissolves in the water. pH describes the water's acidity or
alkalinity and represents the balance between hydrogen ions (H+) and hydroxyl ions (OH–) in water. The
higher or low PH will adversely affect the availability of certain chemicals or nutrients on the water for
use by plants. (Qureshimatva et al. 2015). Patil et al. (2012) reported that the reduced rate of
photosynthetic activity and assimilation of carbon dioxide and bicarbonates are ultimately related to an
increase in pH. They also said higher pH values suggest that carbon, carbonate-bicarbonate equilibrium is
affected due to physicochemical conditions.Tiwari(2015) reported that pH is an indication of biological
life as most of them strive under a narrow range of pH values.Gordi et al(2013) also reported that pH
directly affects organisms and the toxicity of other pollutants in the water and that the buffering capacity
is of importance to the water quality. Water temperature is important because it affects the rates of
biological processes and chemical processes. Temperature is measured in degrees Fahrenheit (1800
between the freezing and boiling point of water) or degrees Celsius 1000 between the freezing and boiling
points of water. The optimal health of aquatic organisms from microbes to larger organisms depends on
temperature. If temperatures are outside the optimal range for a prolonged period, organisms are stressed
and can die. For fishes, the reproductive stage (including sprawling and embryo development) is the most
temperature-sensitive period. Macro-invertebrate such as crayfish, worms, clams, and snails will move
about in the stream's bed to find their optimal temperature. Water temperature is also affected by the
amount of dissolved oxygen (DO). The water’s ability to contain oxygen decreases as the water
temperature rises, the form of ammonia/harmful or harmless to aquatic life, the rate of photosynthesis by
aquatic plants, metabolic rates of marine organisms, and the sensitivity of the organism to pollution.
Water temperature is affected by the seasons and can also be affected by weather, removal or shading
streams, bank vegetation, building dams on rivers, discharging cooling water, discharging stormwater
and groundwater influx. The distribution and abundance of manatees are affected by water temperature
30Iwar et al. 2021 Scientific Reports in Life Sciences 2 (1): 29-39
and aquatic vegetation availability (Deustch et al, 2003). Antonio et al. (2003) reported that manatees are
restricted to rivers and estuaries with a temperature of 240 C while Perrin et al. (2001) reported that the
African manatees are limited to the water of 180 C and 270 C. Furthermore, Deustch et al. (2003) also
reported that increase in salinity greatly influence the distribution of manatees and also reproduction,
feeding and calving Lefebvre et al. (2000) also reported that Manatee limited to water temperature value
of 270 C will eat properly increase in weight and become nourished and mature fast. Esenowo et al.
(2014) reported that the PH range for the African Manatee tended towards alkalinity and that dissolved
oxygen value was high, attributing to aquatic macrophytes' exposure to enough sunlight and atmosphere
air. According to Tiwari (2015) Total Dissolved Solids (TDS) consist of inorganic salts and dissolved
materials. In natural waters, salts are chemical compounds comprised of anions such as carbonates,
chlorides, sulfates, and nitrates (primarily in groundwater), and cations such as potassium (K),
magnesium (Mg), calcium (Ca), and sodium (Na). In ambient conditions, these compounds are present in
proportions that create a balanced solution. If there are additional inputs of dissolved solids to the system,
the balance is altered, and detrimental effects may be seen. Inputs include both natural and anthropogenic
sources.
Materials and methods
Study Area
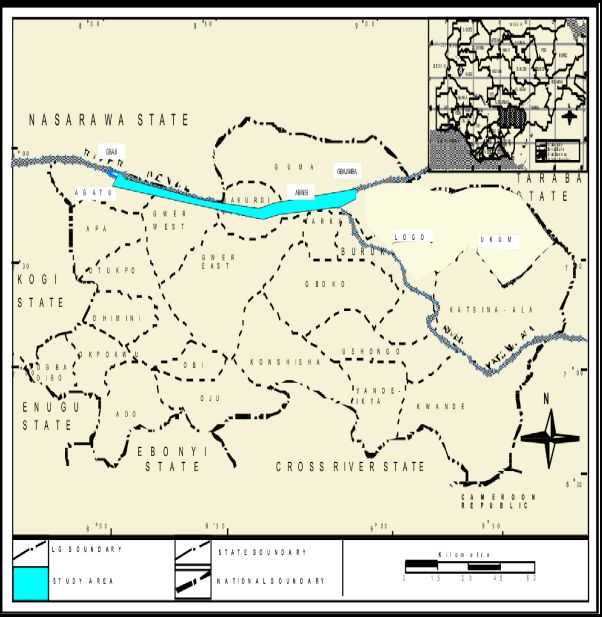
The study covers a section of the River Benue system stretching 462km in length from Gbajimba town in
Guma Local Government Area of Benue State to Lokoja in Kogi State Nigeria. (Fig. 2). The area lies
within latitude 070 491N and 070 521N and longitude 080 361E and 080 401E. The River Benue's major
tributaries along this area include Rivers Guma, Katsina-Ala, Mu, and Gwer. Several settlements are
found all along this area, the major ones being, Gbajimba, Makurdi Abinsi.
The River Benue takes its origin from the Adamawa highlands in the Western Cameron, and it is the
largest tributary to the River Niger, which its confluences with at Lokoja, Kogi State. River Benue enters
Nigerian a few kilometers East of Yola in Adamawa State, flowing westwards for about 780km before
joining River Niger at Lokoja. It flows through Adamawa, Taraba, Benue, and Kogi State and has several
tributaries. Unlike other major African Rivers, the River Benue flows free of rapids and waterfalls (Udoh
1981).
Climate
The study area has distinct dry and wet seasons of the tropical climate. The Tropical maritime air mass
blows across the Atlantic brings rain to the area. The rainy season lasts from April to October and is
between 1,250m-1440m. The tropical Continental air mass blows through the Sahara Desert brings dry
harm tan winds. The dry season is from November to March of the next year. The monthly temperature is
between 28.50C to 360C and may rise to as high as 380 from March to April.
Topography
The area generally lies at about 100 above sea level and experiences annual flooding (Udoh 1981). The
banks of the Benue River is thus filled with rich alluvial soils, which is now utilized for dry season
farming of vegetables, fruits and rice.
31Iwar et al. 2021 Scientific Reports in Life Sciences 2 (1): 29-39
Figure 1: Map showing River Benue, Nigeria
Source : Geological survey office Makurdi (2017)
Data Collection
During the two years of the survey, 40 transects were laid in the 120Km stretch of the River Benue. To
facilitate the selection of suitable sites for laying the transects, the sampled area was divided into four
zones of similar length viz: Gbajimba, Abinsi, Makurdi, and Gbaji. The selected sites gave a wide spatial
coverage and reflected the range of habitats in each zone.
32Iwar et al. 2021 Scientific Reports in Life Sciences 2 (1): 29-39
To determine the water quality parameters along the River, a total of 400 water samples were drawn in a
plastic water container. In each of the four zones, ten (10) transects measuring 500metres each were
drawn. And in each transect, Ten (10) stations were randomly selected and water samples collected. The
following water parameters were measured; pH, Dissolved O2(DO). Total dissolved solids (TDS)s,
Electrical conductivity(EC), and temperature using electronic water testing kits Lutron DO5509 and
electronic Oxygen meter. (plates15&16) This measurement was carried out once every month for twelve
months covering both wet season and dry season.
Result
The variation of water quality analysis in the four sampling stations shows significant differences in the
values of pH, Electrical conductivity, and Total dissolved solid. At the same time, Dissolved Oxygen and
Temperature did not indicate any significant differences.
Table 1: Variation in Water Quality Parameter in sampling stations along River Benue
Sampling Stations Water Quality Parameters
pH EC (µS/cm) DO (Mg/L) Temp (oC) TDS (Mg/L)
Abinsi 6.79±0.05ab 37.16±1.82b 8.97±0.29 28.10±0.25 39.59±1.11a
a
Gbaji 6.89±0.03 43.20±0.98a 9.62±0.32 27.57±0.24 35.84±1.52b
Gbajimba 6.76±0.05ab 43.92±0.83a 9.19±0.28 28.04±0.31 40.55±0.83a
Makurdi 6.67±0.05b 39.28±1.63b 9.09±0.35 27.42±0.27 35.30±1.06b
ns
P-Value 0.02 0.01 0.48 0.21nsIwar et al. 2021 Scientific Reports in Life Sciences 2 (1): 29-39
Table 3: Seasonal Variation in water quality parameters in sampling stations
Water Quality Season Df T-Value P-Value
Parameters Dry Rainy
pH 6.49±0.03 7.06±0.02 386 -12.99Iwar et al. 2021 Scientific Reports in Life Sciences 2 (1): 29-39
70
Abinsi Gbajimba Gbaji Makurdi
Electrical Conductivity (µS/cm)
60
50
40
30
20
10
0
July
October
August
September
November
April
May
June
January
March
December
February
Rainy Season Months/Season Dry Season
Figure3. The trend of Electrical conductivity along the River Benue during the study period
The four sampled stations' electrical conductivity values rose sharply from May, remained relatively
constant during the rainy season, and then gradually dropped during the dry season.
16
Abinsi Gbajimba Gbaji Makurdi
Dissolved Oxygen (Mg/L)
14
12
10
8
6
4
July
January
June
October
February
March
May
August
November
December
April
September
Months/Season
Rainy Season
Dry Season
Figure4. Trend in Dissolved oxygen(DO) along River Benue during the study period
35Iwar et al. 2021 Scientific Reports in Life Sciences 2 (1): 29-39
The trend in the values for dissolved Oxygen values in the four sampling stations indicate wide
fluctuations, generally higher during the rainy season and drops during the dry season.
Abinsi Gbajimba Gbaji Makurdi
33
31
29
Temperature (˚C)
27
25
23
21
19
17
15
July
August
November
October
April
May
September
January
June
December
February
March
Rainy Season Months/Season Dry Season
Figure5. Trend in Temperature along River Benue during the study period
The Temperature trend fluctuates between 29-30C during the rainy season and then dropped to between
23-29C during the dry season.
36Iwar et al. 2021 Scientific Reports in Life Sciences 2 (1): 29-39
70
Abinsi Gbajimba Gbaji Makurdi
60
Total Dissolved Solids (Mg/L) 50
40
30
20
10
0
February
June
May
July
October
August
September
November
March
January
April
December
Rainy Season Months/Season Dry Season
Figure 6. Trend in Total dissolved solids(TDS) along River Benue during the study period
The Total dissolved solid trend in the four sampling stations indicate higher values during the rainy
season and a drop during the dry season.
Discussion
Water quality is a term used to express the suitability of water to sustain various uses or processes. It will
have specific values for the physical, chemical or biological characteristics of water. This agrees with the
report of Megan (2016). Water quality is usually affected by a wide range of natural and human
influences. The pH (Hydrogen ion concentration) along the River Benue in the four (4) sampling stations
indicates significant differences. The pH value in Gbaji was 6.89, which was significantly different from
those of makurdi at 6.67 while those of Abinsi (6.79) and Gbajimba (6.76) were lies between those of
Gbaji and Makurdi. These values closely agree with those of Esenowo et al. (2018) in their studies of
West African Manatee. Spiegelgerber and Gangslosser (2005) also reported a pH value of between 5.6 to
6.8 for the Antillean Manatee in French Guiana. The pH in manatee water habitats tended towards
alkalinity. The result indicated that pH did not correlate with any other Physico-chemical properties of
the water. The pH revealed significant differences between the dry (4.49) and rainy (7.06) seasons. This
wide margin in pH indicates that Manatees are highly adaptable to variation in pH.
The values of the electrical conductivity indicated significant differences among the four sampling
stations. The values for Abinsi (37.16µs/cm) and Gbajimba (43.92µs/cm). Electrical Conductivity is a
measurement of water's ability to conduct an electrical current and is related to Total dissolved solids
(TDS) in the water. The electrical conductivity positively correlated with the pH, which indicates that the
higher the pH, the more water's ability to conduct electrical current and verse visa. There were also
significant differences in the electrical conductivity between dry (29.70µs/cm) and rainy (52.06µs/cm)
37Iwar et al. 2021 Scientific Reports in Life Sciences 2 (1): 29-39
season. During the dry season, the number of solid particles is far less and hence the low conductivity
value, while the water has higher solid particles during the rainy season.
The Dissolved Oxygen (DO) in the four sampling stations did not indicate any significant differences.
However, there exists a positive correlation between dissolved oxygen with pH and Electrical
conductivity. The value of dissolved oxygen (8.10) during the dry season also indicates a significant
difference with those of the rainy season (10.34) as shown in Table 4. Temperature values in the four
sampling stations did not indicate any significant differences (Table 1). It ranged from 27.4260C in
Makurdi to 28.100 C in Abinsi. According to Lefebvre et al. (2000), manatees are limited to a water
temperature value of 270C to eat properly, increase weight, and become nourished and mature fast. The
result agrees with those of Spiegelberger and Ganslosser (2005), who reported a temperature range f
28.40C to 300C, and Egwali et al. (2018) reported a temperature range of 260C - 270C for the West
African Manatee. The water temperature positively correlated with the pH, electrical conductivity, and
dissolved oxygen. The result also indicates significant differences in temperature values between the dry
season and the rainy season. While the mean temperature during the dry season was 26 0C, the rainy
season's value was 29.420C. The trend in water temperature in the four sampling stations is shown in Fig.
5. Between May and October, the temperature fluctuated within 290C - 300C for all the stations except
270C in July. From November (dry season), there was a sharp drop in temperature value in all the
sampling stations.
The total dissolved solids in the four sampling stations are reflected in table1. This indicated significant
differences among the four stations. The value for Abinsi (39.59Mg/L) and Gbajimba (40.55Mg/L) were
significantly different from those of Gbaji (35.84Mg/L) and Makurdi (35.30Mg/L). Total dissolved solid
is positively correlated with pH, Electrical Conductivity, Dissolved Oxygen, and Temperature (Table 3).
The Total dissolved solid is also significantly different between the dry season and the rainy season.
While the dry season's value is 28.80 mg/L, the value for the rainy season was 46.83/Mg/L.
The trend in the value of Total dissolved solids in the four sampling stations fluctuated between the dry
season and the rainy seasons. The value was as high as 60Mg/L in Gbaji in May, while Gbajimba,
Makurdi, and Abinsi were at 45Mg/L. It remained relatively stable from June to October during the rainy
season. However, as the dry season commenced in November to April of the following year, the values
fluctuated downwards in all the four stations between 20Mg/L in Abinsi, Makurdi and Gbaji to 44Mg/L
in Gbajimba.
Conclusion
Much of the information concerning the ecological component of west African Manatee was gathered to
identify the threat to their population better. This research tries to provide an overview of existing
scientific knowledge on the water health of the Manatee. It is baseline information. It is suggested that
continuous monitoring of water parameters be sustained to evaluate changes that may negatively affect
the species and other aquatic species along the River Benue.
Acknowledgments
38Iwar et al. 2021 Scientific Reports in Life Sciences 2 (1): 29-39
This research was funded by a grant from Padi Foundation U.S.A.
References
Antonio O. A., Mignucci- Giannoni R., Montoya Ospina, A., Mario, V. 2003. Status of Semi-Captive
Manatee in Jamaica. LAJAM 2:7-12.
Deustch C.J., Reid J.P., Bonde R.K., Easton I.E., Kochman H.I. 2003. Winter Movement and Use of
Warm Water Refuge by Radio-Tagged West Indian Manatee along the Atlantic Coast of the United
States. Final Report: Florida Power and light Co and US Geological Survey. Gainsville USA.
Esenowo I.K., Akpan U. A., Egwali E.C. 2014. The Behaviour and Morphometric Features of West
African Manatee (Trichechus senegalensis) in a Semi-Wild Environment. J. Biodiversity and Endangered
Species 2:229.
Gorde S.P., Jadhav M.V. 2013. Assessment of Water Quality Parameters. A Review. Journal of
Engineering Research and Applications 3:6 2029-2035.
Lefebvre W., Reid J.P, Kenworthy W.J, Powe, J.A. 2000. Characterizing Manatee Habitat Use of
Seagrass in Florida and Pueto Rico: Implication for Conservation and Management. Conservation
Biology. 5:289-295.
Okayi R.G., Daku Y., Mbata F.U. 2013 Some Aquatic Macrophytes and Water Quality Parameters of
River Guma, Benue State. Nigerian Journal of Fisheries and Aquaculture. 1: 25-30.
Patil P.N., Savant D.V., Deshmukh R.N. 2015 Physico-Chemical parameters for testing water –A Review.
International Journal of Environmental Sciences 3 :1194 – 1207.
Perrin W.F. 2001. Conservation status of West African Manatee Sirenews 36:34-40.
Premlata V. 2012 Multi-variant Analysis of Drinking Water Quality of Lake Pichhola in Udapur, India.
Biological Forum. An International Journal 2: 97 -102.
Qureshimatv U.M, Maurya R.R, Gamit S.B., Solanki H.A. 2015 Determination of Physico-Chemical
Parameters and Water Quality Index of Chandlodia Lake, Ahmedabab Gujarat, India. Environmental and
Analytic Toxicology 5:4. 288
Smithan S., Shivashankar P. 2013. Physico-Chemical Analysis of the Freshwater at River Kapila,
Nanjangud Industrial Area, India. International Research Journal of Environmental Sciences 2 :8: 59-65.
Spielgelberger T., Ganslosser U. 2013 Habitat Analysis and Exclusive Bank Feeding of the Antillean
Manatee (Trichechus manatus manatus) in the Coswine Swamps of the French Guiana, South America.
Tropical Zoology 18:11-12.
Tiwari S. 2015. water quality parameters – A Review. International Journal of Engineering Science
Invention Research. Vol. 1:9.
Verma P.U., Purohit A.R Patil, N.J. 2012 Pollution Status of Chandiodia Lake Located in Ahmedabab
Gujarat. International Journal of Engineering Research and Applications 2: 1600- 1610.
Yadav P., Yadav A.K., Khare P.K. 2013 Physico-Chemical Characteristics of Freshwater Pond of Orai
Central India. Journal of Biosciences 1:177-184.
39You can also read