Effect of Temperature on Physical and Electrochemical Properties of the Monolithic Carbon-Based Bamboo Leaf to Enhanced Surface Area and Specific ...
←
→
Page content transcription
If your browser does not render page correctly, please read the page content below
Int. J. Electrochem. Sci., 14 (2019) 7076 – 7087, doi: 10.20964/2019.08.59

                                                                        International Journal of
                                                                        ELECTROCHEMICAL
                                                                                SCIENCE
                                                                               www.electrochemsci.org

Effect of Temperature on Physical and Electrochemical
Properties of the Monolithic Carbon-Based Bamboo Leaf to
Enhanced Surface Area and Specific Capacitance of the
Supercapacitor
B. Armynah1,2, E. Taer3, Z. Djafar1, Wahyu H. Piarah1, D. Tahir2,*,
1
  Departement of Mechanical Engineering, Hasanuddin University, Bantumarannu Goa 92171
Indonesia
2
  Departement of Physics, Hasanuddin University, Tamalanrea Makassar 90245 Indonesia
3
  Department of Physics, University of Riau, 28293 Simpang Baru, Riau, Indonesia
*
 E-mail: dtahir@fmipa.unhas.ac.id

Received: 2 April 2019 / Accepted: 25 May 2019 / Published: 30 June 2019

Several analysis have been conducted on the physical and electrochemical properties of monolithic
carbon-based bamboo leaf for supercapacitor application. Therefore, the main focus of this study was
to analyze the relationship between pore diameter, surface area, and specific capacitance. The
variations of pore diameter were found using the activation temperature in the range of 750 °C, 800 °C,
850 °C, and 900 °C. The carbon electrode was prepared in the monolithic form to ensure there is no
disturbance with the natural pore of the electrode in the presence of adhesives. The physical properties
analyzed include (i) thermal properties, (ii) surface morphology, (iii) elemental content (iv)
crystallinity properties and (v) N2 gas adsorption-desorption isotherm. Furthermore, the specific
capacitance was determined through the use of Cyclic Voltammetry (CV) as the electrochemical
characteristic. It was discovered that the specific capacitance varies with average pore diameter such
that a higher specific capacitance was found with pore diameters smaller than 1.5 nm and the value
increased with the size. This research was supported by analysis of surface morphology, elemental
content, thermal resistance, and degree of crystallinity.

Keywords: bamboo leaf; activated carbon; biomass

1. INTRODUCTION

       The electrochemical double layer capacitor (EDLC) model is a family of electrode storage
devices known as supercapacitors. The energy storage process in these devices occurs through the
formation of different charge layers at the interface of the electrode and electrolytes in the micropores
Int. J. Electrochem. Sci., Vol. 14, 2019 7077
of the carbon electrode [1]. The energy stored in the electric field of the devices is simply formulated
to be proportional to the capacitance and potential square such that the capacitance is directly
proportional to the charge stored and inversely proportional to the potential. From this, it can be
ascertained that the formation of more layers of charge leads to higher capacitance and energy to be
stored. Geometrically, the capacitance is said to be directly proportional to the surface area of the
electrode and inversely proportional to the distance between the two layers of charge formed.
However, research on electrodes supercapacitor from carbon materials is still evaluating the
relationship between surface area and the distance between two layers of charge to get the optimum
combination [2,3,4]. Huang, et. al in 2008 examined the relationship of capacitance with pore size for
pore distribution varying from 0.7 nm to 50 nm to replace the EDLC model [5]. The results obtained
show pores smaller than 1 nm tends to lead to an electric wire-in-cylinder capacitor (EWCC) model,
the capacitance increases significantly with the reduction in pore diameter and for those in range of 2-5
nm, the value increases slowly following the electric double-cylinder capacitor (EDCC) model. The 1-
2 nm pore range did not display any specific model and was not discussed in detail. Therefore, this
study was conducted to show the relationship between surface area and average pore diameter in the
range of 1.29-1.66 nm. The variations in pore distribution and surface area were conducted with
different physical activation temperature. Furthermore, carbon electrodes were produced from bamboo
leaves without the addition of adhesive materials to eliminate the interference with the natural pores.
However, physical and electrochemical characterization is explained in the next section.
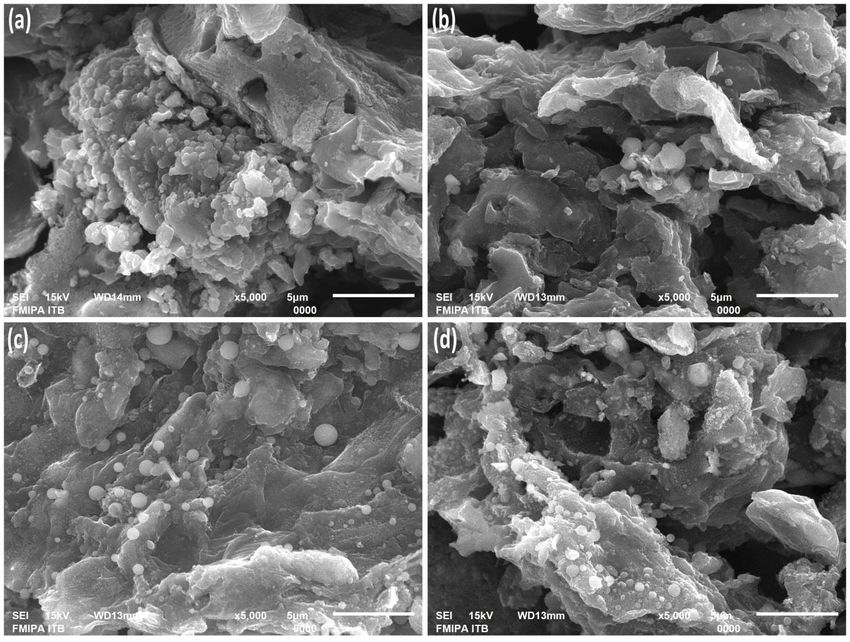
2. EXPERIMENTAL METHOD
2.1. Preparation of bamboo leaf activated carbon electrodes
Bamboo leaf waste was collected from the Wajo Regency, South Sulawesi. It was washed,
dried, cut, and separated from the leaf stalks. Fine pieces samples were pre-carbonized using the low-
temperature furnace for 2 hours at a temperature of 200 °C. The pre-carbonized samples were ground
using a blender and sieved using a 170-sized mesh. The resulting powder was chemically activated
through the use of 0.5 M KOH and washed repeatedly by copious of distilled water until the washing
water becomes neutral (pH = 7). The neutral samples were dried at a temperature of 110 °C for 2 days.
After this, they were used to form pellets by using the hydraulic press with a compression pressure of 8
tons. This was followed by a single step carbonization-physical activation process through the use of
Payun Tech Er-5.2L furnace at a temperature of 600 °C in the N2 gas environment [6]. A physical
activation process was conducted through the use of CO2 gas at temperatures of 750 °C, 800 °C, 850
°C and 900 °C for 2.5 hours and the samples were labeled BL750, BL800, BL850, and BL900,
respectively. The detail preparation of the sample is as shown in Figure 1.
2.2. Physical characterization
The physical properties characterization for carbon electrodes from bamboo leaf waste includes
(i) thermal properties, (ii) surface morphology, (iii) elemental content (iv) crystallinity properties and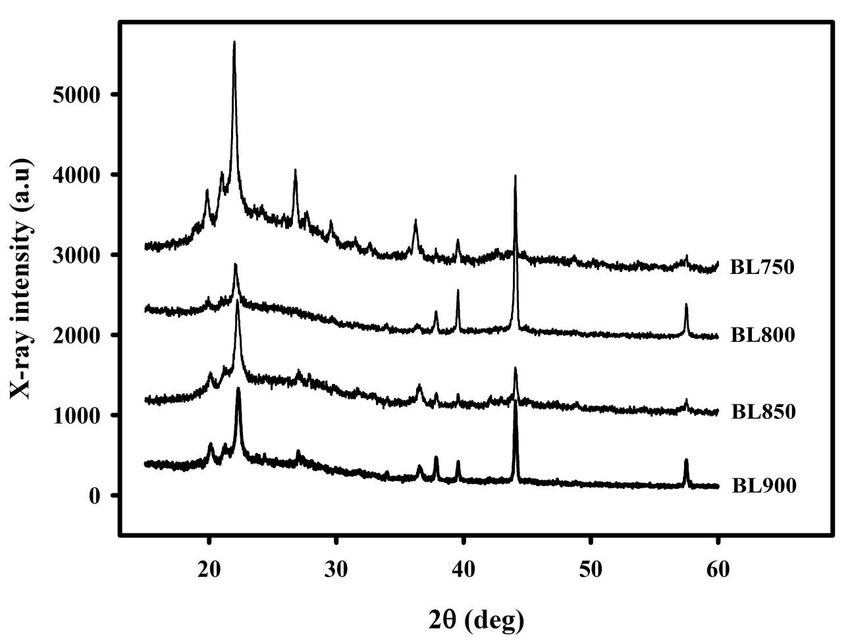
Int. J. Electrochem. Sci., Vol. 14, 2019                                                              7078

(v) N2 gas adsorption-desorption isotherm. The thermal properties characterization was conducted
through the use of Thermogravimetry Analysis (TGA) method at a temperature of 600 °C and a gas
flow rate of 10 °C min-1. The N2 gas adsorption-desorption isotherm was conducted by using the
Quantachrome TouchWin v.1.2 instrument.
       Furthermore, the specific surface area was evaluated by BET method while the BJH (Barrett-
Joyner-Halenda) method was used for pore size distribution. Surface morphology and elemental
content were characterized by using Scanning Electron Microscopy and Energy Dispersive X-ray with
the Jeoul JSM 6510 LA instrument. Moreover, the crystallinity properties were investigated through
the use of X-ray diffraction method with the Shimadzu 7000 instrument (source of CuKα with λ =
0.154 nm) at the scattering angles (2θ) of 10-60˚.

2.3. Electrochemical properties

        The electrochemical properties of carbon electrodes were characterized using the Cyclic
Voltammetry method with a two-electrode system. They were measured through the use of a CV UR
Rad-Er 5841 instrument at 1, 2, 5 and 10 mV s -1 scan rate variations with a potential window of 0-1 V
in 1 M H2SO4 electrolyte solution and the use of eggshell membrane as separator [7]. However, the
specific capacitance was calculated using the following equation [8,9]:
              I − Id
        C sp = c                                                      (1)
                sxm
        Where Ic is the charge current (A), Id is the discharge current (A), s is the scan rate and m is the
electrode mass.

                    Figure 1. Preparation of the activated carbon from bamboo leaf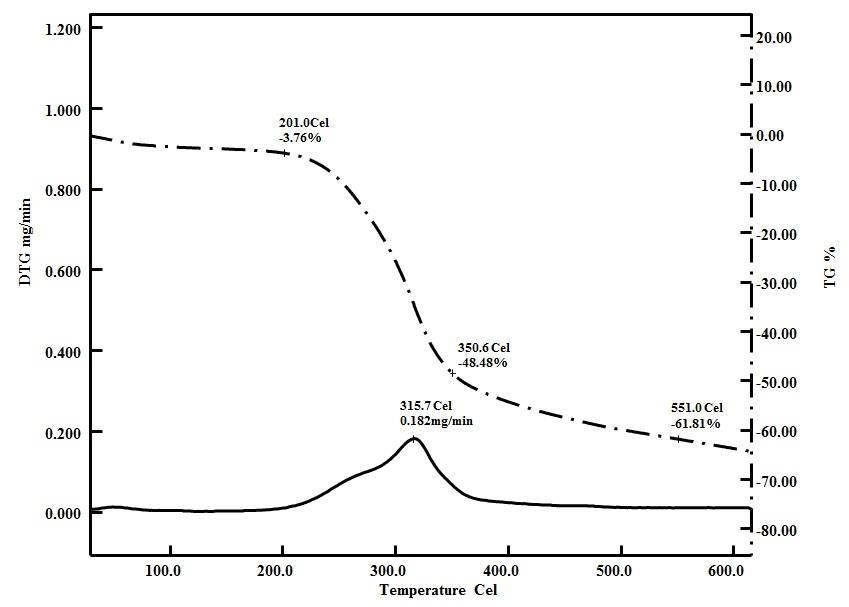
Int. J. Electrochem. Sci., Vol. 14, 2019                                                          7079

3. RESULTS AND DISCUSSION

3.1. Thermogravimetry analysis

                        Figure 2. TG and DTG profile for bamboo leaf samples

         The thermal stability for the pre-carbonized bamboo leaf is shown by the TG and DTG profile
in Figure 2. TG and DTG analyses were conducted in the N2 gas atmosphere at a temperature of 30-
600 °C with an initial sample mass of 2.80 mg. TG profile shows the mass percentage reduction vs
temperature while the DTG profile determines the reduction of mass per time vs temperature. The TG
profile reveals the Pre-carbonized sample lost about 61.81% of mass before it reached 600 °C through
3 decomposition stages. The first stage occurred at a temperature of 100-200 °C with a mass decrease
of 3.76% through the evaporation of moisture content [10]. The pyrolysis effect on the sample showed
the highest mass loss of 44.72% in the second stage at a temperature of 250-400 °C. At this stage, there
was a decomposition of complex compounds such as cellulose, hemicellulose, and lignin, as reported
in the literature [11]. Furthermore, the samples decreased by 13.33% in the final stage at a temperature
of 400-600 °C where the lignin compound decomposed as mentioned in the literature [12]. The highest
decomposition rate on the DTG profile was 0.182 mg min -1 as observed at about 315.7 °C indicating a
broad peak. This is compatible with what was observed at the second stage of the TG profile and it can
be said that 315.7 °C is the thermal resistance temperature for the bamboo leaf. However, it is
important to point out that the analysis was simultaneously influenced by the reduction of complex
Int. J. Electrochem. Sci., Vol. 14, 2019 7080
compounds. Therefore, the observed temperature is the standard for mass decomposition for carbon
made from biomass material, as seen in rubber seed [13], date palm [14] and durian shell [12].
3.2. Crystallinity analysis
Figure 3. XRD pattern for all samples
Table 1. Diffraction peaks, interlayer spacing (d002 and d100) and microcrystallite dimensions (Lc and
La)
Sample 2θ 2θ d002 d100 La Lc
code (002) (100) (Å) (Å) (Å) (Å) Lc/La
BL750 21.9686 44.0425 4.0427 2.0544 12.6434 8.6185 0.6817
BL800 22.1476 44.0516 4.0105 2.0540 27.0333 12.9778 0.4801
BL850 22.2377 44.0551 3.9944 2.0538 10.5099 6.7457 0.6418
BL900 22.2802 44.0592 3.9869 2.0537 14.3462 8.7162 0.6076
The structures and surface chemistry of the Activated carbon made from bamboo leaf were
analyzed by using X-ray diffraction (XRD) as shown in Figure 2 and two broad peaks were observed
at 22˚ and 44˚ to represent the amorphous character of the carbon [15]. The broad peak at 22˚ was
apparent in all samples, indicating the characteristic peak of graphite (002) plane attributed to the
parallel stacking of flake graphite layers. The small peak observed at 44˚ indicates the (100) plane inInt. J. Electrochem. Sci., Vol. 14, 2019 7081
the hexagonal structure of pyrolytic carbon [16, 17]. The real diffraction peaks, interlayer spacing (d 002
and d100) and microcrystallite dimensions (Lc and La) are shown in Table 1. The interlayer spacing was
calculated by using Bragg’s equation [18] while the microcrystallite dimensions (Lc and La) were
evaluated through the use of Debye-Scherrer equation [19, 20]. The interlayer spacing revealed the
systematic trend to be correlated with while varying activation temperature. This is important because
increasing the activation temperatures causes a decrease in interlayer spacing but do not show any
systematic change in microcrystallite dimensions. The L c and La observed in this study were similar to
the those reported in previous research, for example, the activated carbon from oil palm empty fruit
bunch [21]. However, the relationships between these two characteristics can be used to determine the
specific surface area of XRD [22, 23]. SSAxrd = 2/(ρxrd Lc) where ρxrd was evaluated by using ρxrd =
(d002(graphite)/d002) ρ(graphite) and d002(graphite) and ρ(graphite) were 0.33354 nm and 2.268 g cm-3, respectively
[23]. Based on this relationship, BL850 has the largest surface area and this affects the electrochemical
performance of supercapacitors. In agreement to this, there are many reports on the interrelation
between interlayer spacing and microcrystallite dimension when evaluating the surface area and
performance of super-capacitating cell [24, 25]. Moreover, Lc/La ratio represents the relative density of
edge and basal planes in the microcrystallites and it was found to be regularly decreasing for all
samples, except BL800.
3.3. Morphology area analysis
The effect of activation temperature on the surface morphology was analyzed by using
Scanning Electron Microscopy method. The images of the BL750, BL800, BL850 and BL900 samples
at a 5000x magnification are shown in Figures 4a, b, c, and d, respectively. The samples were
discovered to exhibit a highly irregular shape and rough surface. Furthermore, the dark-bright
morphology showed the presence of pores between the carbon particles while a bright pattern indicates
the presence of particles on the surface of the sample. In Figure 4a, the particle sizes 0.248 to 0.401 µm
for the sample was found to exhibit pores between 0.320-0,910 µm. Moreover, the increasing
activation temperature in BL800 and BL850 samples as shown in Figures 4b and c caused the particle
size to increase up to 0.348-1.068 µm and 0.350-1.50 µm, respectively. This is because higher
activation temperatures leave more pores on the surface, resulting in less rigidity, and slightly increase
particle size. The phenomenon can also be associated with the washing away of small-sized particles
while the larger ones were left in the higher activation temperature of the sample. Moreover, the loss of
small particles also allows increased pore size between particles in the BL900 sample to range from
0.63 to 4.03 µm as shown in figure 4d. Figures 2a, b, and d showed surface morphology samples with
dominant macropores to be between 0.63 and 4.03 µm. However, the BL850 sample has a slightly
different surface morphology compared to others because it looks denser. This sample has a relatively
smaller pore size and this was further supported by data from N2 adsorption-desorption gas which
showed the similar result as well as the cyclic voltammetry measurement where the sample has the
highest specific capacitance.Int. J. Electrochem. Sci., Vol. 14, 2019 7082
Figure 4. The SEM image with 5000x of magnification for a) BL750; b) BL800; c) BL850 and d)
BL900 samples
3.4. Chemical content analysis
Table 2. The chemical content for carbon electrode samples
Chemical BL750 BL800 BL850 BL900
content Mass Atom Mass atom Mass atom Mass Atom
Carbon 66.14 75.31 77.30 83.83 77.75 84.90 69.94 78.84
Oxygen 23.01 19.67 16.65 13.55 14.44 11.84 19.47 16.48
Magnesium 0.30 0.17 0.20 0.11 0.34 0.19 0.31 0.17
Almuminium 0.31 0.15 - - - - - -
Silicon 8.15 3.97 4.36 2.02 4.45 2.08 7.04 3.39
The chemical composition of the activated carbon made from the bamboo leaf is as shown in
Table 2. It was discovered that the samples are made of carbon, oxygen, magnesium, aluminum, silica,
chlorine, potassium and calcium with the carbon element dominating followed by oxygen. The oxygen
is present because of the effects of the physical activation process while other elements such as silica,
potassium, and calcium are the original elements of bamboo leaf. The activation temperature has an
effect on the percentage of carbon in each sample by regularly increasing the content by 75-84%. In
addition, other impurity elements were also degraded to produce high carbon purity as seen in theInt. J. Electrochem. Sci., Vol. 14, 2019 7083
BL850 sample which has the highest carbon content and the least chemical composition among the
samples. This is in agreement with the reports of other pieces of literature [26, 27]. BL850 was found
to have shown good physical properties of an electrode and also exhibited the highest specific
capacitance.
3.5. The nitrogen adsorption isotherm analysis
The isothermal adsorption-desorption nitrogen gas and pore size distribution analysis of all
samples are as shown in Figure 5. The method is popular for the evaluation of the porous nature and
surface area of activated carbon.
Figure 5. a) Nitrogen adsorption-desorption isotherms; b) Pore size distribution curves for all samples
Figure 5a showed the samples exhibited loop hysteresis with similarity to the type-IV based
IUPAC classification which indicates the presence of the combination of micro and mesoporous in the
samples [28, 29]. At a relatively low temperature of 0-0.4, micropore formation naturally occurs and
when the pressure P/P0> 0.4 mesopores is exhibited by a hysteresis loop. Furthermore, the use of CO 2
activation agents allows the pores to develop well with the mesopores occurring in a higher percentage
than micropores [30]. However, the addition of activation temperature shows a systematic increase in
specific surface area of the sample to be 104.355 m2 g-1, 83.246 m2 g-1, 287.848 m2 g-1, and 328.814 m2
g-1 for BL750, BL800, BL850, and BL900, respectively. Moreover, the pore size distribution as shown
in Figure 5b to concentrate on the diameter of 1-2 nm. Nevertheless, the real values were evaluated by
Barret-Joyner-Halenda (BJH) to be 1.56 nm, 1.66 nm, 1.29 and 1.39 nm for BL750, BL800, BL850,
and BL900, respectively.Int. J. Electrochem. Sci., Vol. 14, 2019 7084
3.6. Electrochemical performance analysis
The cyclic voltammetry measurement was used to test the electrochemical performance level of
the supercapacitor. It generated the current charge and discharge data against certain potentials in order
to evaluate the electrode specific capacitance. The CV curve of the constant scan rate (1 mV s -1) is as
revealed in Figure 6a. All the samples were shown to have a rectangular shape, which is the ideal
shape of carbon material electrodes and this reflected the capacitance characteristic for supercapacitor
cell [31]. However, the largest rectangular shape means the highest current charge while the lowest
discharges and when this is connected to equation 1, the highest specific capacitance is achieved.
Therefore, Figure 5a shows BL850 sample to have the highest specific capacitance.
Figure 6. a) The CV curve for all samples; b) the variation of scan rate for BL850 sample; c) the
relationship between specific capacitance with activation temperature; and d) The relationship
between specific capacitance with an average pore diameter
Furthermore, the activation temperature was discovered to have effects on the electrode
specific capacitance. Figure 6b shows the CV curve of BL850 sample at a different scan rate from 1
mV s-1 to 10 mV s-1 and it was observed to change frequently as the scan rate increases from a
rectangular to a quasi-rectangular shape. The second shape indicates the surface has a well-developedInt. J. Electrochem. Sci., Vol. 14, 2019 7085
combination of micro and mesopores structure as found in the N 2 gas absorption analysis. Moreover,
the specific capacities of different activation temperature from all samples are shown in Figure 6c and
they were found to be frequently increasing from 750 °C to 850 °C and decreased afterward. The
values were 20 F g-1, 24 F g-1, 60 F g-1, and 37 F g-1 for BL750, BL800, BL850, and BL900 samples,
respectively. Therefore, the BL850 sample with an activation temperature of 850 °C possessed the
maximum specific capacitance. This specific capacitance is almost the same as the other electrodes
with similar materials for supercapacitors which shown in Table 3. An increasing activation
temperature allows the electrode to have a lot of pores resulting in a high surface area as observed in
the value of 104-380 m2 g-1 obtained for 750-900 °C respectively. However, the average pore diameter
changed irregularly with BL850 having the smallest at 1.29 nm. This electrode showed the highest
specific capacitance with low surface area and this means the capacitance characteristic was optimum
in the pores. Therefore, it can be concluded that the activation temperature of 850 °C is the optimum
temperature to prepare supercapacitor cells from bamboo leaf-based electrodes. In general, the
relationship between specific capacitance and average pore sizes in the supercapacitor device is as
shown in Figure 6d. It has been revealed that the electrode with pore sizes smaller than 1.5 nm tend to
follow the EWCC model while those higher than 1.5 nm follow the EDCC model and limitation of
each has been stated in Figure 6d.
Table 3. The comparison of specific capacitance for different biomass material as electrodes for
supercapacitor
Biomass Specific capacitance (F g-1) References
Bamboo 60 32
Pandanus leave 56 33
Terminalia Catappa leaf (TCL) 54 34
Banana fiber 74 35
Sawdust 80 36
4. CONCLUSION
It can be concluded that several average pore diameters between 1.29 nm and 1.66 nm have
been produced based on different characterizations and analyses conducted. The specific capacitance
supercapacitor cell was also found to be closely related to the surface area and the average pore
diameter size. Furthermore, the surface area is directly proportional to the activation temperature but
the specific capacitance showed a slightly different trend at temperatures higher than 850 °C where
irregularity was observed with the average pore size. Moreover, for electrodes with pore sizes smaller
than 1.5 nm, the specific capacitance is inversely proportional to the average pore size while for those
higher than 1.5 nm, it is directly proportional. Finally, a turning point (the validity limits of the EWCC
and EDCC models) was found between specific capacitances and average pore size of carbon electrode
in a supercapacitor device.Int. J. Electrochem. Sci., Vol. 14, 2019 7086
ACKNOWLEDGEMENTS
The author would like to thank the DRPM Kemenristek-Dikti through the doctor dissertation program
of 2018 with the title “characteristics of activated carbon as a dielectric material for application of
supercapacitor”. The author also thanks the SEM FMIPA ITB Laboratory, which has assisted in
obtaining the SEM and EDX data.
References
1. M. Inagaki, H. Konno, O. Tanaike, J. Power Sources, 195 (2010) 7880
2. C-C Huang, Y-Z Chen, J. the Taiwan Institute of Chemical Engineers, 44 (2013) 611
3. L. Yin, Y. Chen, D. Li, X. Zhao, B. Hou, B. Cao, Materials and Design, 111 (2016) 44
4. E. Taer, R. Taslim, W. S. Mustika, B. Kurniasih, Agustino, A. Afrianda, Apriwandi, Int. J.
Electrochem. Sci., 13 (2018) 8428
5. J. Huang, B. G. Sumpter, V. Meunier, Chem. Eur. J., 14 (2008) 6614 – 6626
6. E. Taer, Apriwandi, Yusriwandi, W.S. Mustika, Zulkifli, R. Taslim, Sugianto, B. Kurniasih,
Agustino, P. Dewi, AIP Conf. Proc., 1927 (2018) 030036-1
7. E. Taer, Sugianto, M.A. Sumantre, R. Taslim, Iwantono, D. Dahlan, M. Deraman, Adv. Materials
Research, 896 (2014) 66.
8. E. Taer, R. Taslim, Z. Aini, S. D. Hartati, W. S. Mustika, AIP Conf. Proc., 1801 (2017) 040004-1
9. E. Taer, P. Dewi, Sugianto, R. Syech, R. Taslim, Salomo, Y. Susanti, A. Purnama, Apriwandi,
Agustino, R. N. Setiadi, AIP Conf. Proc., 1927 (2018) 030026-1
10. L. L. Zhang, S. X. Zhao, Chemical Society Reviews, 38 (2009) 2520.
11. M. Brebu, C. Vasile, Cellulose Chemistry Technology, 49 (2010) 353.
12. E. Taer, A. Apriwandi, R. Taslim, U. Malik, Z. Usman, Int. J. Electrochem. Sci., 14 (2019) 1318.
13. Kang, J. Jianchun, Biomass and bioenergy, 34 (2010) 539.
14. M. Shoaib, H. M. Al-Swaidan, Biomass and bioenergy, 73 (2015) 124
15. Wenxin Cao, Fuqian Yang, Materials Today Energy, 9 (2018) 406.
16. M. Liu, L. Gan, W. Xiong, F. Zhao, X. Fan, D. Zhu, Z. Xu, Z. Hao, L. Chen, Energy Fuel, 27
(2013) 1168.
17. Y. J. Hwang, S.K. Jeong, J. S. Shin, K. S. Nahm, A. M. Stephan, J. Alloys Compd., 448 (2008)
141.
18. F. Li, W. Chi, Z. Shen, Y. Wu, Y. Liu, H. Liu, Fuel Process Technol., 91 (2010) 17.
19. B. D. Cullity, Elements of X-Ray Diffraction, Ed. 3, (2001) Amazon Prentice Hall.
20. P. J. M. Carrott, J. M. V. Nabais, M. M. L. R. Carrott, J. A. Pajares, Carbon, 39 (2001) 1543.
21. R. Farma, M. Deraman, Awitdrus, I. A. Talib, R. Omar, J. G. Manjunatha, N. H. Basri, B. N. M.
Dolah, Int. J. Electrochem. Sci., 8 (2013) 257.
22. K. Kumar, R. K. Saxena, R. D. Kothari, K. Suri, N. K. Kaushik, J. N. Bohra, Carbon, 35 (1997)
1842.
23. M. Deraman, R. Daik, S. Soltaninejad, N. S. M. Nor, Awitdrus, R. Farma, N. F. Mamat, N. H.
Basri, M. A. R. Othman, Adv. Materials Research, 1108 (2015) 1.
24. D. Qu, J. Power Sources, 109 (2002) 403.
25. Ch. Emmenegger, Ph. Mauron, P. Sudan, P. Wenger, V. Herman, R. Gallay and A. Zuttel, J. Power
Sources, 124 (2003) 321.
26. M. Yu, Y. Y. Han, J. Li, L. J. Wang, Chemical Engineering Journal, 317 (2017) 493
27. M. Shoaib, H. M. Al-Swaidan, Biomass and bioenergy, 73 (2015) 124
28. W. S. K. Sing, H. D. Everett, W. A. R. Haul, L. Moscou, A. R. Pierotti, J. Rouquerol, T.
Siemieniewska, Pure & App. Chem., 57 (1985) 603.
29. K. Yu, H. Zhu, H. Qi, C. Liang, Diamond & Related Materials, 88 (2018) 18.
30. C-H. Ooi, T. Lee, S-Y. Pung, F-Y. Yeoh, ASEAN Engineering Journal Part B, 4 (2013) 40.Int. J. Electrochem. Sci., Vol. 14, 2019 7087
31. H. Chen, Y-c. Guo, F. Wang, G. Wang, P-r. Qi, X-h. Guo, F. Yu, B. Dai, New Carbon Materials,
32 (2017) 592.
32. C. Kim, J. W. Lee, J. H. Kim, K. S. Yang, Korean J. Chem. Eng. 23 (2006) 592.
33. E. Taer, A. Apriwandi, Krisman, Minarni,R. Taslim, A. Agustino, A. Afrianda, J. Phys.: Conf. Ser.
1120 (2018) 012006.
34. E Taer, A Afrianda, R Taslim, Krisman, Minarni, A Agustino, A Apriwandi, U Malik, J. Phys.:
Conf. Ser. 1120 (2018) 012007.
35. Subramanian, C. Luo, A.M. Stephan, K.S Nahm, S. Thomas B. Wei, J. Phys. Chem. C., 111 (2007)
7527.
36. W-J. Liu, K. Tian, Y-R. He, H. Jiang, H-Q. Yu, Environ. Sci. Technol., 48 (2014) 13951.
© 2019 The Authors. Published by ESG (www.electrochemsci.org). This article is an open access
article distributed under the terms and conditions of the Creative Commons Attribution license
(http://creativecommons.org/licenses/by/4.0/).You can also read