Liquid Force and Rupture Distance between Two Particles
←
→
Page content transcription
If your browser does not render page correctly, please read the page content below
Hindawi
Advances in Materials Science and Engineering
Volume 2021, Article ID 3542686, 9 pages
https://doi.org/10.1155/2021/3542686

Research Article
Liquid Force and Rupture Distance between Two Particles

 Cheng Pu , Fengyin Liu, and Shaohan Wang
 Dept. of Geotechnical Engineering, Xi’an University of Technology, Xi’an, China

 Correspondence should be addressed to Cheng Pu; 1909488416@qq.com

 Received 3 June 2021; Revised 3 August 2021; Accepted 6 August 2021; Published 19 August 2021

 Academic Editor: Tetsu Yonezawa

 Copyright © 2021 Cheng Pu et al. This is an open access article distributed under the Creative Commons Attribution License,
 which permits unrestricted use, distribution, and reproduction in any medium, provided the original work is properly cited.
 The study of liquid force has a special meaning to industrial manufacturing. By taking the liquid bridges between equal and
 unequal particles as objects, the liquid force-displacement curves were measured and recorded by using a novel Nano UTM T150
 tensile system. The influences of diameter, diameter ratio, liquid volume, and the surface tension on the liquid force-distance
 curve, the maximum liquid force, and rupture distance were compared and sorted. The results show that the maximum liquid
 force and rupture distance both increase with the increase in liquid volume, particle diameter, diameter ratio, and surface tension.
 The diameter plays a decisive role in determining the value of the maximum liquid force compared with surface tension and liquid
 volume, which only influence the force value in a local range. The rupture distance shows a positive correlation with liquid volume
 and surface tension and a negative correlation with the diameter or diameter ratio. The maximum liquid force between unequal
 particles is about half of the sum of the force between the equal spheres of larger and smaller size in that system.

1. Introduction variation of liquid force between two smooth spheres during
 stretching. Mathewson [7] and Washino et al. [8] investi-
Liquid force, which is commonly encountered in nature, has gated the effect of viscous forces during the separation of a
been widely applied in industries such as crystallization and sphere and plate and the wet granular flowing process, re-
agglomeration, deinking of recycled paper, and removal of spectively. Molenkamp and Nazemi [9] used a dimen-
heavy metals from wastewater since the late 1960s. The study sionless method to investigate the relationship between the
to quantify and estimate the liquid force has a positive effect value of force and the solid-liquid angle, sphere radius, and
on industrial manufacturing. surface roughness. Pirooz et al. [10] established a model to
 The pioneering study of liquid force can be traced back to study the force and rupture distance of liquid bridges be-
the field of surface science, which was started by Hanines tween two unequal spheres. Chen et al. [11] analyzed the
and Fishers [1], who studied the liquid bridge formed be- development of liquid force between two spheres and a
tween two equal-sized spheres. Afterward, researchers sphere-plate system. Rossetti and Simons [12] studied the
studied the liquid force mainly via numerical simulation and rupture energy during the spherical stretching process.
experimental investigation. In the field of numerical sim- When the volume of a liquid bridge is large, the effect of
ulation, Gillespie and Settineri [2] and Clark et al. [3] as- gravity cannot be neglected; Mazzone et al. [13] and Farmer
sumed the profile of liquid to be circular to find a simple and and Bird [14] studied the influence of gravity on liquid force
effective numerical computation. Mehrotra and Sastry [4] and liquid profile while analyzing the condition of non-
conducted a comprehensive review of the pendular liquid axisymmetric bridge occurrence when gravity is considered
bridges research up to 1980. Assuming the particles with from the view of theoretical derivation and numerical
thermodynamic equilibrium and the bridge maintain a simulation. Zhang et al. [15] instigated the influences such as
constant mean-curvature and contact angle, De Bisschop mineral type, water volume, and initial distance on the
and Rigole [5] and Lian et al. [6] theoretically studied the mechanical behavior of the liquid bridge between clay
2 Advances in Materials Science and Engineering

particles in Nanoscale. Pitois et al. [16, 17] proposed a were connected to a computer and placed perpendicular to
common model that expresses liquid force as the sum of each other in front and to the left of the testing machine to
capillary force and viscous force. make sure the upper and lower particles were on the same
 In terms of the experimental study, early researchers axis.
measured liquid force mainly by differential balance and
high-precision cantilever. Willett et al. [18] measured the
liquid force between two equal and unequal synthetic sap- 2.2. Material. Glycerol and ethylene glycol were used to
phire particles by using a differential balance. Rossetti et al. form the liquid bridge between two sphere particles due to
[19] indirectly measured liquid force between a pair of equal their low evaporation and different surface tension. The
particles by the deformation of a high-precision cantilever. physical parameters of these two kinds of liquid at 20°C are
With the improvement of testing methods, rigid testing shown in Table 2. According to the results of Bozkurt et al.
machines have been widely used in liquid bridge tensile tests. [21], the viscous force has a considerable effect on the force
Considering the evolution of the liquid bridge during the value only when the separation rate is higher than
evaporation cannot be ignored [20], and nonvolatile liquids, 4 × 10³ m/s. The experiment in this study was conducted
such as glycerol, were used to conform to the constant under static conditions; thus, the difference of viscosity
volume condition. Bozkurt et al. [21] studied the influence of coefficient can be neglected. Three different sizes of spheres
invasive angle on pendular liquid bridges between equal as 2.5 mm, 4 mm, and 5 mm in diameter and two kinds of
spheres. Pu et al. [22] measured the capillary force of liquids liquid were selected for the experiment.
and the rupture distance between two moving spheres Spheres made of silicon dioxide with a smooth surface
through separation. For systems more than two particles, the (roughness Ra � 60 nm) are selected for the experiment, and
effective packing fraction of the particles has a significant all particles in this article are supported by Xi’an Northwest
impact on the force required to rupture such a bridge [23]. Photoelectric Instruments Plant. The silanol groups on the
Lievano et al. [23] and Wang et al. [24] measured the de- surface of particles can be divided into isolated silicon hy-
velopment of liquid force within three particles. Working droxyl groups, adjacent silicon hydroxyl groups, and aux-
with small liquid volumes between two minimal glass iliary silicon hydroxyl groups. The concentration of silicon
spheres of 20–50 μm in diameter, the liquid force was hydroxyl groups equals 4.12 OH/nm2. Measuring the critical
measured using a digital instrument AFM, and the exper- surface tensions of the particles through the Zisman method,
imental results were found to agree well with the theoretical the critical surface tensions of the particles equal
results [25]. 43.6 dyn/cm. The contact angles of liquid on the particle
 Research on the liquid force has made great progress, surfaces are shown in Table 3.
and the former results show that the value of liquid force is
closely related to the liquid volume, spheres radius, the
distance between particles, the surface tension of the liquid, 2.3. Test Procedure. The particles were rinsed with ethyl
and the contact angle. However, the magnitude of these alcohol and deionized water to remove dust and eliminate
effecting factors has not been compared yet. In this article, electrostatic forces on the particle surface before experiment.
the influences of particle size, liquid volume, and surface Two particles were glued with a low-temperature melting
tension on the value of liquid force and rupture distance glue. The upper particle was glued to the rigid steel, which
were compared and sorted. could be moved up and down at a constant rate, and the
 lower was glued to the NMAT extension head. Then, the
2. Experimental chosen liquid was placed on the top of the bottom particle by
 means of a microsyringe to create a bridge of known volume
2.1. Testing Instrument. The Nano UTM T150 tensile system, between the spheres pairs while the particles were separated.
which is a novel apparatus manufactured by the American Several accommodation cycles of approach and separation
Keysight Company, was used for testing. The T150 system were performed before starting the measurements to obtain
has been designed to be a universal testing system, which a perfect axisymmetric bridge. Finally, the upper particle was
contains a rigid shell, vibration reduction table, data ac- moved upwards at a constant speed of 100 μm/s while the
quisition control (DAC) unit, and micropositioner. The rigid lower remained immobile.
shell can minimize the fluctuation caused by the sudden The glycerol was used to form the liquid bridge firstly,
release of stress when the liquid bridge breaks. The vibration and the liquid bridge tensile tests between equal particles
reduction table can eliminate the influence of noise and were conducted by measuring the liquid force between two
vibration on experimental results. The data acquisition unit, 2.5 mm particles, two 4 mm particles, and two 5 mm par-
which connects to the computer as the interface between the ticles. After that, maintaining the lower particle size constant
software and the T150 system, is housed in the electronics at 5 mm, the upper particle was successively replaced with
cabinet. The micropositioner, which is located at the bottom 2.5 mm and 4 mm particles. Finally, the glycerol was
of the crosshead, allows the proper alignment of samples by replaced with ethylene glycol to form the liquid bridge
moving grip in the plane. The main mechanical parameters between two 2.5 mm particles. The ratio of the upper particle
of the Nano UTM T150 tensile system are shown in Table 1. diameter to the lower particle diameter was defined as the
 The schematic diagram of the testing structure is shown diameter ratio n. The test conditions are shown in Table 4.
in Figure 1. Two high-precision microscopic CCD cameras The liquid volume was set as 0.1, 0.2, 0.5, 1.0, and 1.5 μL.
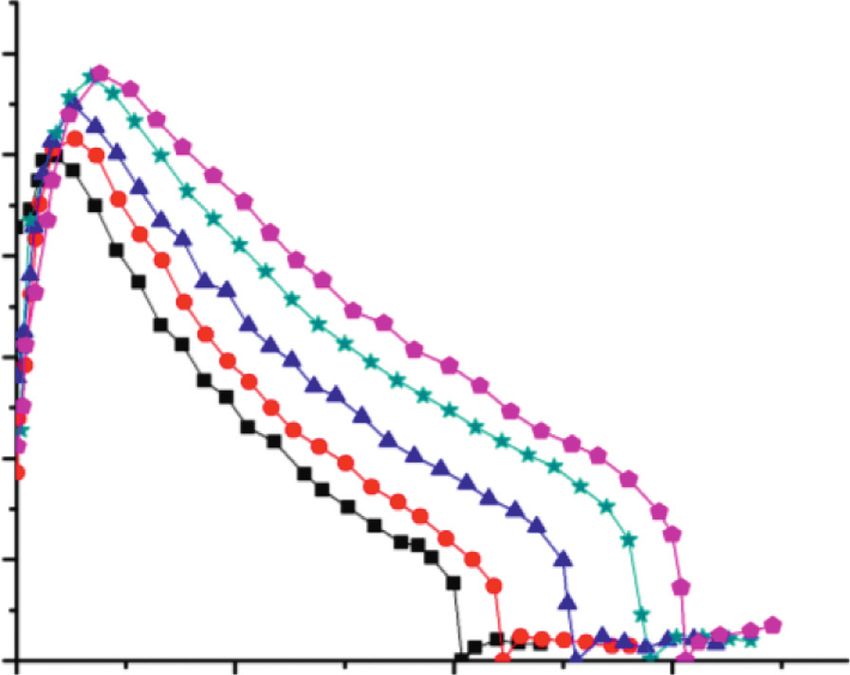
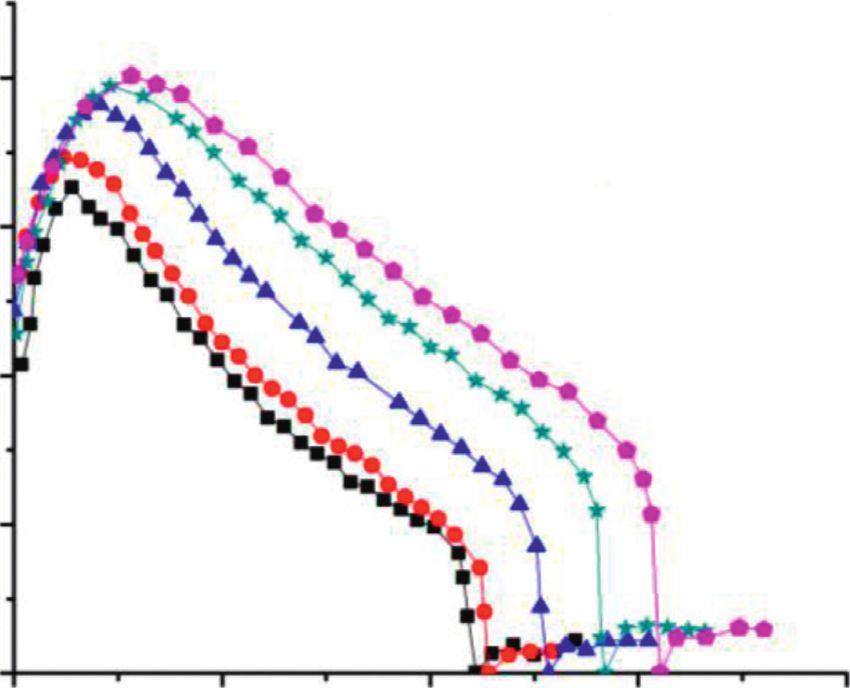
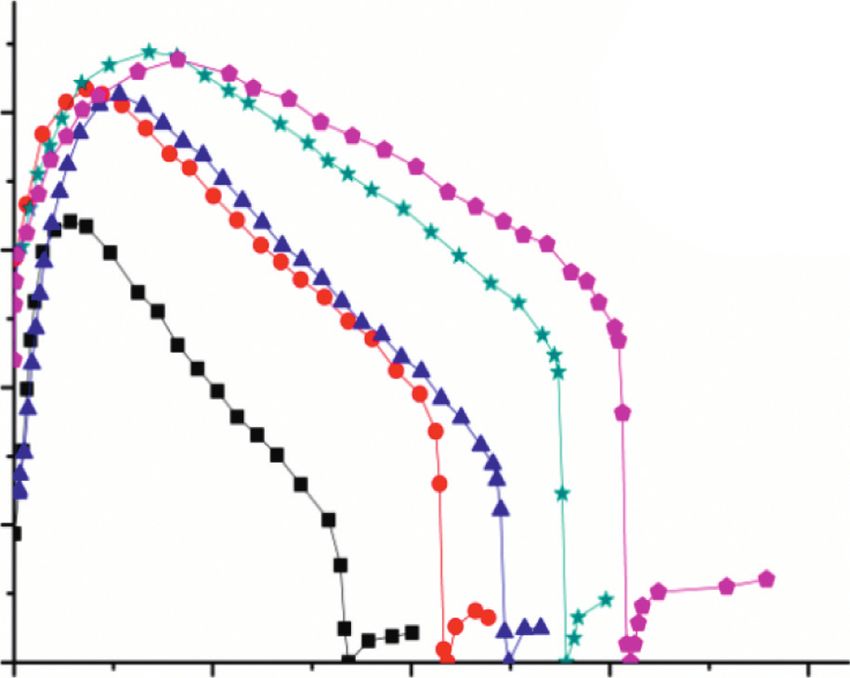
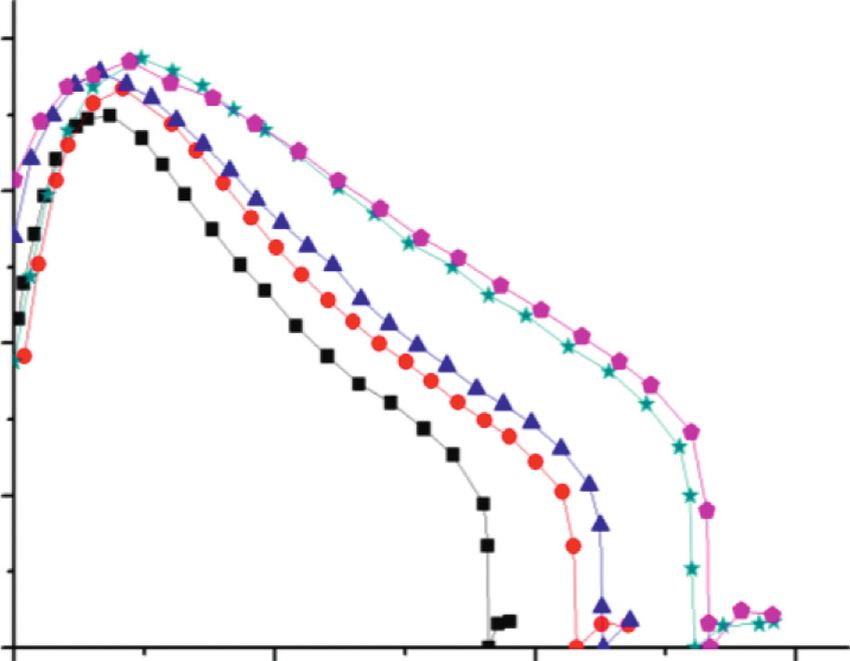
Advances in Materials Science and Engineering 3

 Table 1: The main mechanical parameters of the Nano UTM T150.
Maximum load (mN) Load resolution (nN) Maximum displacement (mm) Displacement resolution (nm) Stretching rate
500 50 200 35 0.5 μm/s–5 mm/s

 Rigid frame
 Adjust
 thumbscrew
 Crosshead on the
 micropositioner

 Rigid steel
 Particles

 Shielded shaft Liquid bridge
 extension on the
 NMAT head
 Force sensor

 Fastening bolt
 Vibration
 isolation table
 Date
 acquisition and
 control unit

 Camera

 Figure 1: Schematic of the UTM T150 system experimental apparatus.

3. Results and Discussion During the stretching process, the neck radius of the
 bridge and the solid-liquid contact angle decreased con-
3.1. Correlation Theory. Figure 2 shows the stress state in the tinuously, while the height of the liquid bridge and the outer
neck of the liquid bridge. As shown, there exists force Fψ radius increased continuously. Thus, Fσ is always positive
produced by matric suction within the liquid bridge and and can be regarded as an attractive force. Fψ is positive
force Fσ produced by surface tension at the liquid-gas in- when r1 is smaller than r2 and negative when r1 comes to
terface [26]. The liquid force can be regarded as a sum of the larger than r2 and can be regarded as attractive force and
Fψ and Fσ , as shown in equation (1), and Fψ and Fσ were repulsive force, respectively.
calculated as equations (2) and (3).
 Fliq � Fσ + Fψ , (1)
 3.2. Liquid Force-Displacement Curve. The results of the
 tensile tests are presented in Figure 3. It can be seen from
 Fψ � πr22 ψ, (2) Figure 3 that the liquid force increases with the increasing
 separation distance at first until it reaches a peak, at which
 Fσ � 2πr2 σ. (3) point the force decreases with the increasing distance until it
 finally drops to zero. According to this, the curves can be
 The matric suction Ψ at the gas-liquid interface can be divided into an ascent stage, a descent stage, and a rupture
expressed as equation (4) according to the Young–Laplace stage. It should be noted that, in the first stage, the maximum
equation. force appears to occur at a small but nonzero-separation
 1 1 distance [13, 21, 25, 27], while some previous research
 ψ � σ − , (4) studies have shown that the maximum force occurs in the
 r 1 r2
 zero-separation distance [16–18].
in which r1 is the outer radius of the liquid bridge, r2 is the Although this discrepancy was observed by many
radius of the neck of the liquid bridge, as shown in Figure 2, researchers, no one has discussed this phenomenon
and σ is the surface tension. systematically. From the point of our view, this
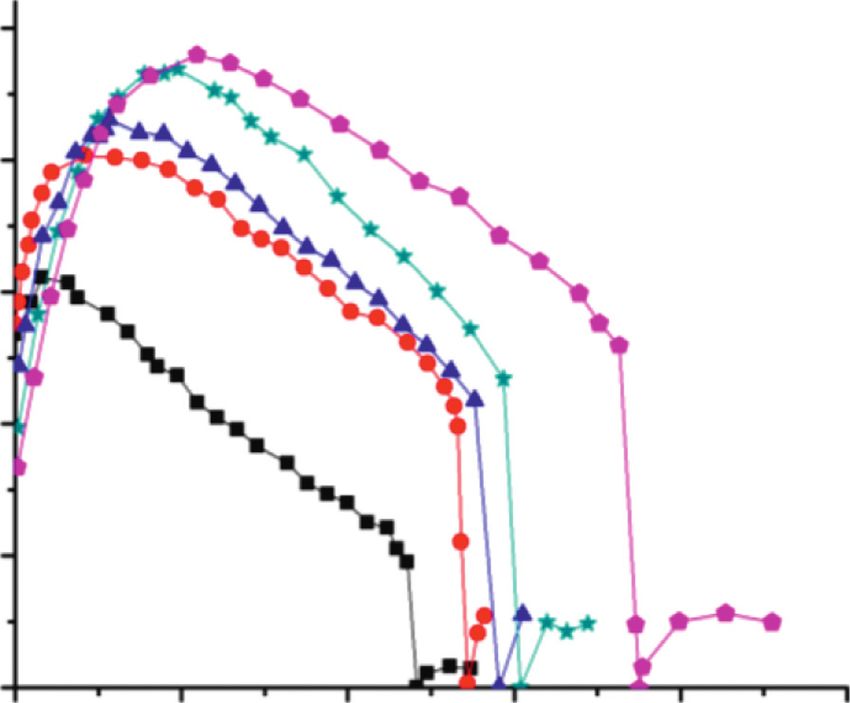
4 Advances in Materials Science and Engineering

 Table 2: Physical and mechanical parameters of glycerol and ethylene glycol (20°C).
Liquid Density (g/cm3) Surface tension (N/m) Viscosity (Pa s)
Glycerol 1.26 0.063 0.15
Ethylene glycol 1.11 0.048 0.015

 Table 3: Contact angle of liquid on the particle surfaces (20°C).
Liquid Static (°) Advancing Receding
Glycerol 32.1 38.0 28.5
Ethylene glycol 25.8 29.4 21.8

 Table 4: Test conditions.
Particle diameter (mm) Types of liquid
Equal particles 4 : 4, 5 : 5
 Glycerol
Unequal particles 2.5 : 5 (n � 0.5), 4 : 5 (n � 0.8)
Equal particles 2.5 : 2.5 Glycerol and ethylene glycol

discrepancy may be attributed to the difference of the elongation, and it breaks abruptly. The remaining part of the
initial conditions for different liquid tensile testing curve represents the weight of the droplets remaining on the
methods. Traditionally, there are two main methods used lower ball.
to conduct a liquid bridge tensile test. The method uti-
lizing the high-precision cantilever, for example, starts at
a critical state, where no compressive stress is produced 3.3. Maximum Liquid Force. The maximum liquid forces
in the deflection. Under this circumstance, the experi- under different test conditions are shown in Figure 4 in
ment starts at equilibrium though the separation distance which Figures 4(a) and 4(b) show the maximum liquid force
may not be zero. With the stiff-testing machines that are between equal and unequal particles, respectively.
widely used in this type of test, however, the experiment It can be seen from Figures 4(a) and 4(b) that the liquid
starts at a state in which the separation distance is ab- force increases with the increase in particle diameter, diameter
solute zero although there may be compressive stress at ratio, liquid volume, and surface tension. When the liquid
the top of the bottom particles. In the descent stage, the volume increases from 0.1 μL to 0.5 μL, the liquid force has a
force Fσ decreases continually, and the force Fψ firstly relatively high growth rate. When the volume changes from
reduced in a positive direction then increased in a neg- 0.5 μL to 1.5 μL, the rate begins to decrease. The volume at
ative direction. In this stage, r1 is always larger than r2, which the liquid force growth rate transitions from high to low
and there exist both a repulsive force and an attractive is defined as the critical volume. When the liquid volume is
force in the liquid bridge. Based on the theory in the under this volume, the liquid force increases significantly with
former section, by substituting equation (4) back into increasing volume; when the liquid volume is higher than this
equation (3), equation (5) is obtained, where volume, the liquid force increases slowly with increasing
 volume. It can be inferred that the liquid force will not always
 r22 increase with the liquid volume; once the liquid volume reaches
 Fψ � π − r2 σ. (5) a certain value, the maximum force will remain stable.
 r1
 Surface tension also has an effect on the maximum liquid
 For equation (5), given r1 > r2, π (r22 /r1 − r2 ) < 0. The force. When the liquid volume between particles is the same,
absolute values of equations (2) and (5) were compared, as the larger the surface tension is, the higher the maximum
shown in equation (6); because of r1 > r2, the ratio of liquid force will gain.
equation (2) to equation (5) is greater than 1. Moreover, the diameter and diameter ratio have a much
 bigger impact than the liquid volume and surface tension on the
 2πr2 2r1 liquid force, and the liquid force in different sized particles

 π r2 /r − r � r2 − r1 > 1. (6)
 distributes in various regions and shows a zonal distribution
 2 1 2
 trend. When the diameter is 2.5 mm, the liquid force is between
 Therefore, although in this stage, the attractive force 0.18 mN and 0.24 mN; when the diameter is 4 mm, the liquid
decreases rapidly, and the repulsive force increases, the force is between 0.33 mN and 0.40 mN; and when the diameter
attractive force is always higher than the repulsive force, and is 5 mm, the liquid force is between 0.49 mN and 0.58 mN. For
the attractive force is still predominant in the bridge. the unequal systems, when n � 0.5, the liquid force is between
 When the neck of the bridge becomes the narrowest, the 0.35 mN and 0.38 mN; when n � 0.8, the liquid force is between
attractive force decreases to a minimum, the repulsive force 0.42 mN and 0.47 mN; and when n � 1 (equal particles with a
reaches its maximum, and the curve reaches the third stage. In diameter of 5 mm), the liquid force is between 0.49 mN and
this stage, the bridge can no longer withstand any additional 0.58 mN.
Advances in Materials Science and Engineering 5

 R1

 r1 r2

 R2

 Fσ
 Fψ
 Figure 2: The force in the neck of a liquid bridge.

 0.25
 0.4

 0.20
 0.3
 Liquid force/mN

 Liquid force/mN

 0.15

 0.2
 0.10

 0.1
 0.05

 0.00 0.0
 0.0 0.5 1.0 1.5 2.0 2.5 0.0 0.5 1.0 1.5 2.0
 Separation distance (mm) Separation distance (mm)
 0.1uL 1.0uL 0.1uL 1.0uL
 0.2uL 1.5uL 0.2uL 1.5uL
 0.5uL 0.5uL

 (a) (b)
 Figure 3: Continued.

6 Advances in Materials Science and Engineering

 0.6 0.4

 0.5
 0.3
 Liquid force/mN

 Liquid force/mN
 0.4

 0.3 0.2

 0.2
 0.1
 0.1

 0.0 0.0
 0.0 0.5 1.0 1.5 0.0 0.5 1.0 1.5
 Separation distance (mm) Separation distance (mm)
 0.1uL 1.0uL 0.1uL 1.0uL
 0.2uL 1.5uL 0.2uL 1.5uL
 0.5uL 0.5uL
 (c) (d)

 0.5
 0.20
 0.4
 Liquid force/mN

 Liquid force/mN

 0.15
 0.3

 0.10
 0.2

 0.1 0.05

 0.0 0.00
 0.0 0.5 1.0 1.5 0.0 0.5 1.0 1.5 2.0
 Separation distance (mm) Separation distance (mm)
 0.1uL 1.0uL 0.1uL 1.0uL
 0.2uL 1.5uL 0.2uL 1.5uL
 0.5uL 0.5uL
 (e) (f )

Figure 3: The liquid force-separation distance curve under different test conditions: (a) 2.5 mm : 2.5 mm made by glycerol; (b) 4 mm : 4 mm
made by glycerol; (c) 5 mm : 5 mm made by glycerol; (d) 2.5 mm : 5 mm made by glycerol; (e) 4 mm : 5 mm made by glycerol; (f ) 2.5 mm :
5 mm made by ethylene glycol.

 In conclusion, the diameter and diameter ratio play a 2.5 mm particles, respectively, made by glycerol and
decisive role in determining the value of the liquid force, while ethylene glycol shown in Figure 5. It is obvious that the
the liquid volume and surface tension only influence the force rupture distance rises up with the increase in liquid
value within a local range. For a two-particle system, when the volume while falls down with the increase in diameter or
diameter of the upper (lower) particles is the same, a larger diameter ratio. For equal particles, the bridge in two
diameter ratio will result in a higher liquid force value. 2.5 mm equal particles gained the longest rupture distance
 under the same liquid volume condition. For equal par-
3.4. Rupture Distance. As two particles move, the liquid ticles, the bridge in 2.5 mm : 5 mm particles has the largest
bridge elongates continuously until it ruptures, and the rupture distance value. Meanwhile, the rupture distance
distance where the bridge breaks is called rupture distance. in equal particles is much longer than it in unequal
The results obtained under different experimental condi- particles.
tions are presented in Figure 5. It can be concluded that different from the maximum
 The bridge made by a larger surface tension liquid liquid force, the liquid volume, surface tension, and diameter
gains a higher value for rupture distance as the equal or diameter ratio all play roles in determining the value of
Advances in Materials Science and Engineering 7

 0.6
 0.6

 Maximum liquid force/mN
 Maximum liquid force/mN

 0.5
 0.5
 0.4

 0.3
 0.4

 0.2

 0.1 0.3
 0.0 0.5 1.0 1.5 0.0 0.5 1.0 1.5
 Liquid volume/uL Liquid volume/uL

 D=2.5mm D=5.0mm D=2.5mm:5mm
 D=4.0mm D=2.5mm,Ethylene glycol D=4mm:5mm
 D=5mm:5mm
 (a) (b)

 Figure 4: The maximum liquid force-liquid volume curves. (a) equal particles; (b) unequal particles.

 1.8
 Rupture distance (mm)

 1.6

 1.4

 1.2

 1.0

 0.8

 0.0 0.4 0.8 1.2 1.6
 Liquid volume/uL
 2.5mm:2.5mm 2.5mm:5mm
 4mm:4mm 4mm:5mm
 5mm:5mm 2.5mm:2.5mm ethylene
 glycol
 Figure 5: Curve of rupture distance-liquid volume.

rupture distance. The rupture shows a positive correlation particles system when the diameter of upper particle equals
with liquid volume and surface tension and a negative 2.5 mm and Figure 6(b) shows the diameter of upper particle
correlation with the diameter or diameter ratio. equals 5 mm.
 The red dots with the solid line represent the maximum
 force between two unequal particles, the blue triangles
3.5. Comparison of Liquid Force between Equal and Unequal represent the maximum force between two equal particles
Spheres. Plotting the maximum liquid force between equal whose size is equal to that of the upper particles in the
particles and unequal particles in the same graph, Figure 6(a) unequal particle system, the black squares represent the
shows the maximum liquid force of equal and unequal maximum force between two equal particles whose size is
8 Advances in Materials Science and Engineering

 0.6 0.6

 0.5 0.5
 Maximum liquid force/mN

 Maximum liquid force/mN
 0.4 0.4

 0.3 0.3

 0.2 0.2

 0.1 0.1
 0.0 0.5 1.0 1.5 0.0 0.5 1.0 1.5
 Liquid volume/uL Liquid volume/uL

 D=2.5mm:2.5mm Mean value D=4mm:4mm Mean value
 D=2.5mm:5mm D=5mm:5mm D=4mm:5mm D=5mm:5mm
 (a) (b)

 Figure 6: The maximum liquid force-liquid volume curves: (a) the upper sphere equals 2.5 mm; (b) the upper sphere equals 4 mm.

equal to that of the lower particles, and the red dots with the liquid volume and surface tension and a negative
dashed line represent the mean values of the blue triangles correlation with the diameter or diameter ratio.
and black squares. It can be seen that, for a system of two (3) For a system of unequal spheres, the maximum
unequal particles, the maximum liquid force is lower than liquid force is lower than the force between equal
the force between equal particles of a larger size and higher particles with a size that equals that of the larger
than the force in a system of equal particles of a smaller size, particle in the unequal system and higher than the
and it is about half of the sum of those two forces. force between equal particles that equals in size to the
 smaller particle in the unequal system. The maxi-
4. Conclusion mum liquid force between unequal particles is about
 half of the sum of the force between the equal spheres
Using the Nano UTM T150 tension instrument to measure of larger and smaller size in that system.
the liquid force between equal and unequal spheres, the
influence of sphere diameter, liquid volume, and surface Data Availability
tension on the liquid force and rupture distance was
compared. The following conclusions can be made: The datasets used and/or analyzed during the current study
 are available from the corresponding author on reasonable
 (1) The liquid force-displacement curve can be divided
 request.
 into ascent stage, descent stage, and rupture stage,
 respectively. The difference between the two types of
 curves is due to the discrepancies between the initial
 Conflicts of Interest
 conditions of different test methods. When the The authors declare that they have no conflicts of interest.
 maximum force occurred in the zero-separation
 distance, the experiment starts at a force equilibrium Acknowledgments
 point, though the separation distance may not be
 zero. When the maximum force appeared at a small This study was funded by the National Natural Science
 but nonzero-separation distance, the experiment Foundation of China (Nos. 51679198 and 12072260) and the
 starts at a displacement equilibrium point, in which Institute of Geotechnical Engineering in Xi’an University of
 the separation distance is absolute zero, but may exist Technology.
 compressive stress at the top of the bottom particles.
 (2) The maximum liquid force and rupture distance both References
 increase with the increase in liquid volume, particle
 [1] R. A. Fisher, “On the capillary forces in an ideal soil; cor-
 diameter, diameter ratio, and surface tension. The
 rection of formulae given by W. B. Haines,” The Journal of
 diameter plays a decisive role in determining the Agricultural Science, vol. 16, no. 3, pp. 492–505, 1926.
 value of the maximum liquid force compared with [2] T. Gillespie and W. J. Settineri, “The effect of capillary liquid
 the liquid volume and surface tension, which only on the force of adhesion between spherical solid particles,”
 influences the force value within a local range. The Journal of Colloid and Interface Science, vol. 24, no. 2,
 rupture distance shows a positive correlation with pp. 199–202, 1967.
Advances in Materials Science and Engineering 9

 [3] W. C. Clark, J. M. Haynes, and G. Mason, “Liquid bridges [22] C. Pu, F. Y. Liu, and Z. Zhang, “Liquid force and profile
 between a sphere and a plane,” Chemical Engineering Science, between two moving sphere particles under different liquid
 vol. 23, no. 7, pp. 810–812, 1968. content condition: an experiment study,” Shuili Xuebao,
 [4] V. P. Mehrotra and K. V. S. Sastry, “Pendular bond strength vol. 51, pp. 81–91, 2020, in Chinese.
 between unequal-sized spherical particles,” Powder Technol- [23] D. Lievano, S. Velankar, and J. J. McCarthy, “The rupture
 ogy, vol. 25, no. 2, pp. 203–214, 1980. force of liquid bridges in two and three particle systems,”
 [5] F. R. E. De Bisschop and W. J. L. Rigole, “A physical model for Powder Technology, vol. 313, pp. 18–26, 2017.
 liquid capillary bridges between adsorptive solid spheres: the [24] J. P. Wang, E. Gallo, and B. Francois, “Capillary force and
 nodoid of plateau,” Journal of Colloid and Interface Science, rupture of funicular liquid bridges between three spherical
 vol. 88, no. 1, pp. 117–128, 1982. bodies,” Powder Technology, vol. 305, pp. 89–98, 2016.
 [6] G. Lian, C. Thornton, and M. J. Adams, “A theoretical study of [25] Y. I. Rabinovich, M. S. Esayanur, and B. M. Moudgil,
 the liquid bridge forces between two rigid spherical bodies,” “Capillary forces between two spheres with a fixed volume
 Journal of Colloid and Interface Science, vol. 161, no. 1, liquid bridge: theory and experiment,” Langmuir, vol. 21,
 pp. 138–147, 1993. no. 24, pp. 10992–10997, 2005.
 [7] M. J. Matthewson, “Adhesion of spheres by thin liquid films,” [26] H. Kazuyuki, T. Kazuo, and I. Koichi, “The capillary binding
 Philosophical Magazine A, vol. 57, no. 2, pp. 207–216, 1988. force of a liquid bridge,” Powder Technology, vol. 10,
 [8] K. Washino, E. L. Chan, H. Midou, T. Tsuji, and T. Tanaka, pp. 231–242, 1974.
 “Tangential viscous force models for pendular liquid bridge of [27] F. Soulié, F. Cherblanc, M. S. El Youssoufi, and C. Saix,
 Newtonian fluid between moving particles,” Chemical Engi- “Influence of liquid bridges on the mechanical behaviour of
 neering Science, vol. 174, pp. 365–373, 2017. polydisperse granular materials,” International Journal for
 [9] F. Molenkamp and A. H. Nazemi, “Interactions between two Numerical and Analytical Methods in Geomechanics, vol. 30,
 rough spheres, water bridge and water vapour,” Géotechnique, no. 3, pp. 213–228, 2006.
 vol. 53, pp. 255–264, 2013.
[10] D. Pirooz, T. W. Li, K. Pougatch, M. Salcudean, and
 D. Grecov, “Modeling the evolution and rupture of stretching
 pendular liquid bridges,” Chemical Engineering Science,
 vol. 65, pp. 4472–4483, 2010.
[11] Y. Chen, Y. Zhao, H. Gao, and J. Zheng, “Liquid bridge force
 between two unequal-sized spheres or a sphere and a plane,”
 Particuology, vol. 9, no. 4, pp. 374–380, 2011.
[12] D. Rossetti and S. J. R. Simons, “A microscale investigation of
 liquid bridges in the spherical agglomeration process,” Powder
 Technology, vol. 130, pp. 49–55, 2013.
[13] D. N. Mazzone, G. I. Tardos, and R. Pfeffer, “The effect of
 gravity on the shape and strength of a liquid bridge between
 two spheres,” Journal of Colloid and Interface Science, vol. 113,
 no. 2, pp. 544–556, 1986.
[14] T. P. Farmer and J. C. Bird, “Asymmetric capillary bridges
 between contacting spheres,” Journal of Colloid and Interface
 Science, vol. 454, pp. 192–199, 2015.
[15] C. Zhang, Z. Liu, and Y. Dong, “Effects of adsorptive water on
 the rupture of nanoscale liquid bridges,” Applied Clay Science,
 vol. 146, pp. 487–494, 2017.
[16] O. Pitois, P. Moucheront, and X. Chateau, “Rupture energy of
 a pendular liquid bridge,” The European Physical Journal B,
 vol. 23, no. 1, pp. 79–86, 2001.
[17] O. Pitois, P. Moucheront, and X. Chateau, “Liquid bridge
 between two moving spheres: an experimental study of vis-
 cosity effects,” Journal of Colloid and Interface Science,
 vol. 231, no. 1, pp. 26–31, 2000.
[18] C. D. Willett, M. J. Adams, S. A. Johnson, and J. P. K. Seville,
 “Capillary bridges between two spherical bodies,” Langmuir,
 vol. 16, no. 24, pp. 9396–9405, 2000.
[19] D. Rossetti, X. Pepin, and S. J. R. Simons, “Rupture energy and
 wetting behavior of pendular liquid bridges in relation to the
 spherical agglomeration process,” Journal of Colloid and In-
 terface Science, vol. 261, no. 1, pp. 161–169, 2003.
[20] B. Mielniczuk, T. Hueckel, and M. S. E. Youssoufi, “Evapo-
 ration-induced evolution of the capillary force between two
 grains,” Granular Matter, vol. 16, no. 5, pp. 815–828, 2014.
[21] M. G. Bozkurt, D. Fratta, and W. J. Likos, “Capillary forces
 between equally sized moving glass beads: an experimental
 study,” Canadian Geotechnical Journal, vol. 54, no. 9,
 pp. 1300–1309, 2017.
You can also read