Dust Dry Deposition over Israel - Article
←
→
Page content transcription
If your browser does not render page correctly, please read the page content below
Article

Dust Dry Deposition over Israel
Pavel Kishcha 1,*, Evgeni Volpov 2, Boris Starobinets 1, Pinhas Alpert 1 and Slobodan Nickovic 3
 1 Department of Geophysics, Tel Aviv University, Tel Aviv 69978, Israel; bstarobin@gmail.com (B.S.);
   pinhas@tauex.tau.ac.il (P.A.)
 2 Israel Electric Corporation Ltd., Haifa 3100001, Israel; evgeni.volpov@gmail.com

 3 Republic Hydrometeorological Service of Serbia, 11030 Belgrade, Serbia; nickovic@gmail.com

 * Correspondence: pavel@cyclone.tau.ac.il

 Received: 7 January 2020; Accepted: 10 February 2020; Published: 13 February 2020

 Abstract: Similar quasiperiodic year‐to‐year variations of dust dry deposition (DDD) with a two–
 three‐year period were found over Israel and north‐east Africa. This phenomenon of quasiperiodic
 interannual variations of DDD has not been discussed in previous publications. Moreover, similar
 seasonal variations of DDD were found over both Israel and north‐east Africa, characterized by
 significant dust deposition in spring and a decrease in DDD from spring to autumn. These findings
 indicate the existence of the same causal factors for interannual and seasonal variations of DDD
 over the two regions, such as similar surface winds created by Mediterranean cyclones. Daily runs
 of the Dust REgional Atmospheric Model (DREAM) at Tel Aviv University from 2006 to 2019 were
 used to investigate the main features of the spatio‐temporal distribution of dust dry deposition in
 the eastern Mediterranean, with a focus on Israel. DREAM showed that, on average, during the
 14‐year study period, in the winter, spring, and summer months, the spatial distribution of
 monthly‐accumulated DDD over Israel was non‐uniform with the maximum of DDD over
 southern Israel. In the autumn months, DREAM showed an increase in DDD over northern Israel,
 resulting in an almost uniform DDD pattern. The knowledge of DDD spatio‐temporal distribution
 is helpful for understanding the negative effects of DDD on the performance of solar panels and on
 insulator flashover in the Israel power electric network.

 Keywords: desert dust; dust dry deposition; quasiperiodic interannual variations; regional
 modeling; eastern Mediterranean

1. Introduction
     Satellite and ground‐based measurements show that the eastern Mediterranean is a crossroad
for various species of air pollution [1]. These species include desert dust from the Sahara Desert as
well as from deserts in the Middle East, anthropogenic aerosols from Europe, and marine sea‐salt
aerosols generated by winds at the Mediterranean Sea surface. Large amounts of air pollutants
create a severely polluted environment over coastal areas of the eastern Mediterranean.
     Desert dust is the major pollutant over Israel and surrounding areas, influencing air quality and
visibility [2–4]. Semi‐arid and desert regions, characterized by low cloudiness, are the most attractive
locations for solar energy production. Dust deposition on solar panels deteriorates the performance
of such panels leading to significant losses in the generated power [5,6]. In addition, dust dry
deposition on insulators could cause insulator flashover leading to electricity outages. Such insulator
flashovers in the Israel power electric network are discussed by Volpov and Kishcha [7]. Because of
the above‐mentioned dust‐related problems, the investigation of interannual and seasonal
variations, as well as spatial distribution of dust dry deposition, is important. Dust dry deposition
also has beneficial effects on soil properties as it is a source of nutrients, such as potassium,
phosphorous, iron, sulfur, ammonia, and organic matter [8].
Atmosphere 2020, 11, 197; doi:10.3390/atmos11020197                         www.mdpi.com/journal/atmosphere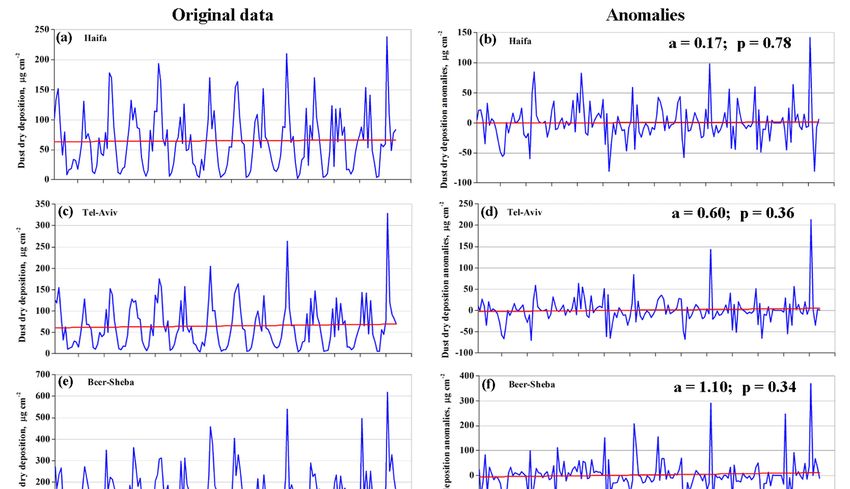
Atmosphere 2020, 11, 197                                                                                  2 of 17

     However, little is known about the specific features of spatio‐temporal distribution of dust dry
deposition (DDD) over Israel and surrounding areas. Ganor and Foner [9] measured dust dry
deposition over Israel and the Sinai Desert, from 1970 to 1973. They found significant dust dry
deposition over the Negev Desert, located in southern Israel [9]. Dust modeling and forecasts by the
Tel‐Aviv University (TAU) dust prediction system [10–12] have been carried out from 2006 to 2019.
This provides us with the opportunity to estimate spatio‐temporal distribution of dust dry
deposition over the model domain. Our study was aimed at investigating spatial patterns of
annually‐, seasonally‐, and monthly‐accumulated dust dry deposition over the study region,
including Israel and surrounding areas (Figure 1C). In addition, we investigated long‐term trends in
dust dry deposition during the 14‐year study period (2006–2019).
     This knowledge will advance the general understanding of the above‐mentioned dust‐related
problems in the south‐eastern Mediterranean and in Israel in particular.

      Figure 1. Maps of (A) the whole Dust REgional Atmospheric Model (DREAM) domain (15° N–50° N;
      20° W–45° E) including (B) north‐east Africa (29° N–31.5° N; 28° E–33.5° E) and (C) the study region
      (Israel and surrounding areas) (29° N–34° N; 33.5° E–36° E). The colors designate the distribution of
      the potential dust source parameter α, which is specified by the global vegetation data [13]. α ranges
      from 0 (no dust emissions) to 1.

2. Data and Methodology
      Daily model runs of the TAU aerosol prediction system from 2006 to 2019 provide us with
consistent model data of dust dry deposition during the 14‐year study period. The TAU dust
prediction system is based on the Dust Regional Atmospheric Model (DREAM) [13]. A brief outline
of the DREAM model is given in the following section.
      Our focus was on investigating characteristic features of spatio‐temporal distribution of DDD
over the study region. As known, Saharan dust intrusions are a common phenomenon over Israel
[14]. During these intrusions, dust is transported across north‐east Africa, located in proximity to the
region under study. In order to understand the relationship between the dust over North Africa and
that over the study region, we made a comparison of year‐to‐year variations, as well as seasonal
variations of DDD between north‐east Africa and Israel. Accordingly, we made a comparison of
year‐to‐year variations as well as seasonal variations of surface wind speed between north‐east
Africa and Israel. This was carried out using surface wind M2IMNXLFO [15] at the surface layer
height (approximately 60 m) from the NASA MERRA‐2 reanalysis including data assimilation [16].
In the process of data assimilation, observations, collected from all available sources, were combined
with forecast output from a weather prediction model. The resulting reanalysis is considered to be
the ‘best’ estimate of the state of the atmosphere at a particular time [17].

2.1. The DREAM Model
     As illustrated by the flowchart (Figure 2), the DREAM model simulates all major processes of
the atmospheric dust cycle, such as dust generation, transport, and dry and wet deposition [13]. The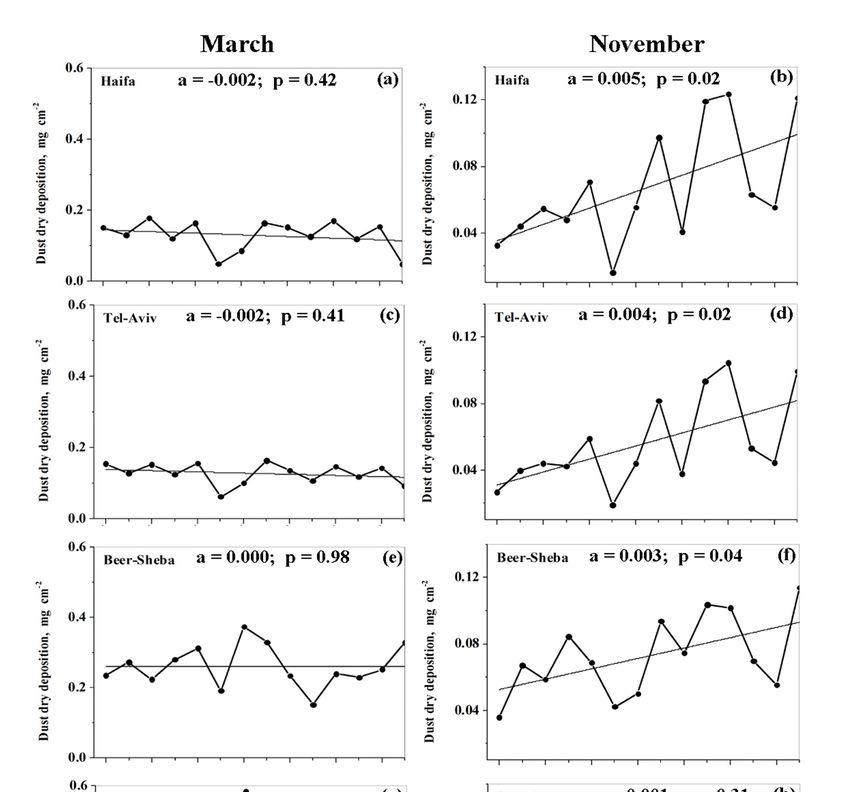
Atmosphere 2020, 11, 197                                                                          3 of 17

NCEP/Eta (National Centre of Environmental Prediction) regional meteorological model is the
driver for the DREAM dust model [13]. At the preprocessing step (Figure 2), the NCEP/Eta model is
initialized with the NCEP analysis, and the lateral boundary data are updated every six hours by the
Global Forecast System (GFS) model of NCEP. The DREAM dust module (Figure 2) calculates a 3D
distribution of dust pollution over the model domain (20° W–45° E; 15° N–50° N) with 0.3°
horizontal grid spacing and 24 vertical levels up to 15 km in height (Figure 1A). Eight particle size
classes are used in the model with the particle size (diameter) between 0.2–0.36; 0.36–0.6; 0.6–1.2; 1.2–
2; 2–3.6; 3.6–6; 6–12; 12–20 μm [18]. The dust module is initialized with 3D dust distributions
obtained from previous dust module runs (from previous days). DREAM includes dust sources
located in the western, central, and eastern Sahara, as well as in the Arabian Peninsula (Figure 1A).
This is based on the United States Geological Survey (USGS) data of vegetation cover [13]. Dust
emissions depend on soil moisture, soil texture, friction velocity, and surface conditions [13].
DREAM calculates wind friction velocity based on surface roughness and soil moisture. The
DREAM dry deposition scheme follows Giorgi [19]. To calculate dry deposition velocity, this scheme
takes into account processes of turbulent diffusion, Brownian diffusion, gravitational settling, and
processes of interception and impaction on surface roughness elements [13,19]. A possible effect of
sea‐breeze on dust dry deposition over Israel was not investigated. This is because a model of higher
horizontal resolution than DREAM is needed.

      Figure 2. Flowchart of the Tel‐Aviv University (TAU)/DREAM dust model system used for daily
      operational dust forecasts over the Mediterranean region from 2006 to 2019.

2.2. Validation of Modeled Monthly‐Accumulated Dust Dry Deposition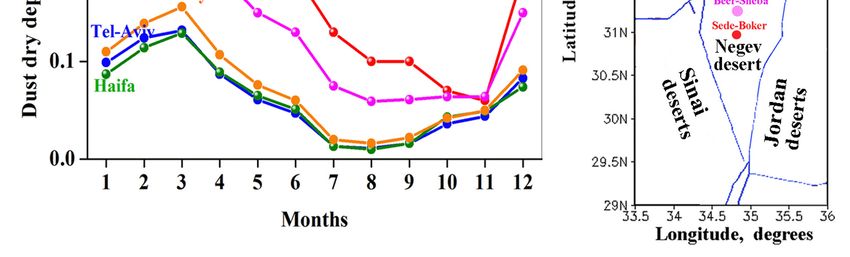
Atmosphere 2020, 11, 197                                                                                     4 of 17

     Daily runs of the DREAM dust prediction system, from 2006 to 2019, were used in the current
study to obtain spatial distributions of monthly‐accumulated dust dry deposition over Israel and
surrounding areas, averaged over the 14‐year study period. Monthly‐accumulated dust deposition
model data were validated by Volpov and Kishcha [7] using a comparison with available direct
measurements of total air pollution deposited on electric insulators, in the Israel power supply
network. This comparison was carried out for different geographic locations and various exposure
periods. A good correspondence was obtained between modeled dust deposition data and
measurements, characterized by the correlation coefficient of 0.8 [7, their Figure 9].
     In the current study, spatial distribution of modeled annually‐accumulated dust deposition,
averaged over the 14‐year study period, was compared with that based on the only available
measurements of dust dry deposition over Israel and the Sinai Peninsula [9]. The latter
measurements were conducted during the period from 1970 to 1973 by Ganor and Foner [9]. They
measured deposition produced by total suspended dust particles of size (diameter) up to 100 μm.
However, DREAM only took into account dust particles of size less than 20 μm. For the purpose of
verifying spatial distribution of model data, we used annually‐accumulated dust deposition values
normalized on dust deposition in Sede‐Boker (30.855° N, 34.782° E), located in the middle of the
Negev Desert. (This comparison is discussed in Section 3.2).

3. Results
     We investigated specific features of spatio‐temporal distribution of monthly‐accumulated,
seasonally‐accumulated, and annually‐accumulated dust dry deposition over the region under
study, based on daily runs of the DREAM dust prediction system from 2006 to 2019.

3.1. Year‐to‐Year Variations of Annually‐Accumulated Dust Deposition over Israel
     We analyzed year‐to‐year variations of DREAM‐based annually‐accumulated dust dry
deposition (DDD) over specified sites located in the northern, central, and southern parts of the
study region (Figure 3a). One can see noticeable quasiperiodic year‐to‐year variations with a 2–3
year period, which are highly correlated over all parts of the study region (Table 1).

      Figure 3. (a) Year‐to‐year variations of DREAM‐based annually‐accumulated dust dry deposition at
      the specified sites, located in the northern, central, and southern parts of Israel, and over north‐east
      Africa (29° N–31.5° N; 28° E–33.5° E), located in close proximity to the region under study. (b)
      Geographic locations of the specified sites: Haifa (32.79° N; 34.99° E), Tel‐Aviv (32.085° N; 34.781° E),
      and Sede‐Boker (30.855° N, 34.782° E).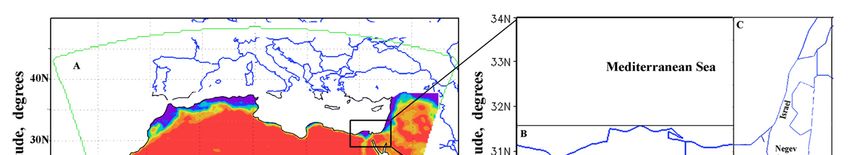
Atmosphere 2020, 11, 197                                                                                       5 of 17

      Table 1. Correlation matrix for year‐to‐year variations of annually‐accumulated dust dry deposition
      (DDD) in Haifa, Tel‐Aviv, Sede‐Boker, and over north‐east Africa during the study period (2006–
      2019). The numbers represent correlation coefficients (R) together with their standard errors [20].
      These correlation coefficients are statistically significant at the 95% confidence level (p‐values ≤ 0.05).

                               Haifa                 Tel‐Aviv                Sede‐Boker           North‐East Africa
      Haifa                     1.00                 0.92 ± 0.10              0.77 ± 0.20            0.87 ± 0.10
     Tel‐Aviv                0.92 ± 0.10                1.00                  0.92 ± 0.10            0.97 ± 0.10
   Sede‐Boker                0.77 ± 0.20             0.92 ± 0.10                 1.00                0.94 ± 0.10
 north‐east Africa           0.87 ± 0.10             0.97 ± 0.10              0.94 ± 0.10               1.00

     As mentioned in Section 2.2, we also analyzed year‐to‐year variations of DREAM‐based
annually‐accumulated DDD over north‐east Africa (Figure 1B), located in proximity to the region
under study. DREAM showed a strong correlation between the year‐to‐year variations over
north‐east Africa and those at the specified sites (Figure 3 and Table 1). This indicates that the
quasiperiodic year‐to‐year variations of annually‐accumulated dust dry deposition over both Israel
and north‐east Africa were caused by the same factors. To specify these factors, we compared the
year‐to‐year variations of surface wind speed averaged over north‐east Africa with those averaged
over the southern part of the study region (Figure 4). As mentioned in Section 2, this was carried out
using surface wind at the surface layer height (approximately 60 m) from the NASA MERRA‐2
reanalysis including data assimilation. One can see similar quasiperiodic year‐to‐year variations of
surface wind speed over the two regions (Figure 4). These quasiperiodic interannual variations of
surface wind speed are highly correlated (with the statistically significant correlation coefficient of
0.84 ± 0.15), especially in the last decade. Moreover, the quasiperiodic interannual variations of
surface wind speed over the two regions correlated with quasiperiodic interannual variations of
DDD over those regions (Figures 3 and 4).

      Figure 4. Year‐to‐year variations of the 14‐year mean surface wind speed over the southern part of
      the study region (29.5° N–31.5° N; 34.5° E–35.5° E) and north‐east Africa (29° N–31.5° N; 28° E–33.5°
      E), based on NASA MERRA reanalysis (2006–2019) [15].

     As known, dust occurrence in the south‐east Mediterranean is associated with cyclonic activity
all over the Mediterranean basin [4,14]. These Mediterranean cyclones determine surface winds over
the whole area of the south‐eastern Mediterranean (including north‐east Africa and Israel), causing
similar interannual variability of DDD.
     In spite of high correlation in the year‐to‐year variations of DDD over different parts of Israel,
there was an essential difference in dust deposition values. In different years, DDD over southern
Israel (Sede‐Boker) was approximately three times higher than over northern Israel (Haifa) (Figure
3). This will be discussed in the next Section 3.2.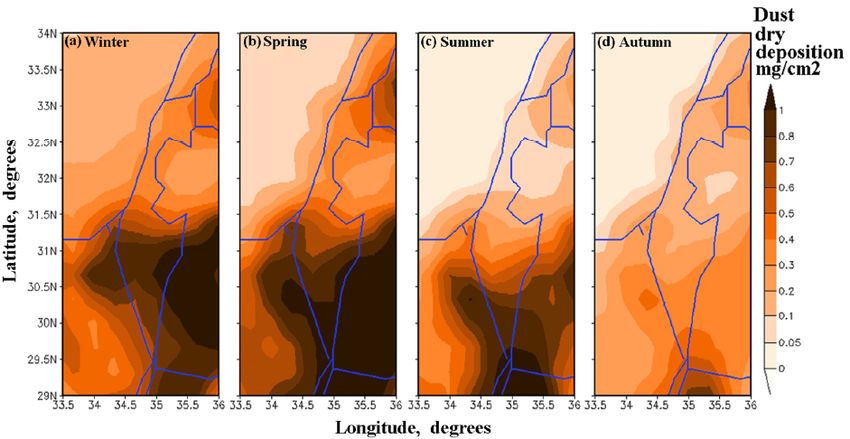
Atmosphere 2020, 11, 197                                                                       6 of 17

3.2. Spatial Non‐Uniformity of Annually‐Accumulated Dust Dry Deposition over Israel
      Taking into account that Israel is distant from major dust sources in the Sahara, one could
expect a homogeneous distribution of DDD (assuming that desert dust over Israel was transported
mainly from remote sources). However, DREAM showed that this is not the case. This is because the
spatial distribution of annually accumulated dust dry deposition (averaged over the 14‐year study
period) was non‐uniform (Figure 5). With respect to the south–north direction, dust dry deposition
was essentially higher over the southern part of Israel than over the central and northern parts: DDD
in Sede‐Boker (southern Israel) was three times higher than in Haifa (northern Israel). This indicates
the contribution of dust from the Negev Desert and from adjacent deserts in Jordan and Sinai to the
total dust deposition over Israel.

      Figure 5. Spatial distribution of annually‐accumulated dust dry deposition over Israel and
      surrounding areas, averaged over the 14‐year study period.

     Our findings about spatial non‐uniformity of dust dry deposition are in line with Ganor and
Foner [9]. We compared the obtained spatial distribution of 14‐year mean modeled
annually‐accumulated dust deposition with that of measured annually‐accumulated dust deposition
(Figure 6a) [9]. As mentioned in Section 2.2, the modeled and measured annually‐accumulated dust
deposition were normalized on the annually‐accumulated dust deposition in Sede‐Boker (30.855° N,
34.782 °E), located in the middle of the Negev Desert. Figure 6b represents a comparison between
modeled and measured annually‐accumulated dust dry deposition at the specified sites, located in
the south‐north direction along Israel. One can see a good correspondence between DREAM dust
deposition data and measurements, which supports our findings based on DREAM model data.
Both measurements and model data showed DDD values significantly decreasing with distance
from the Negev Desert (Sede‐Boker) (Figure 6a,b).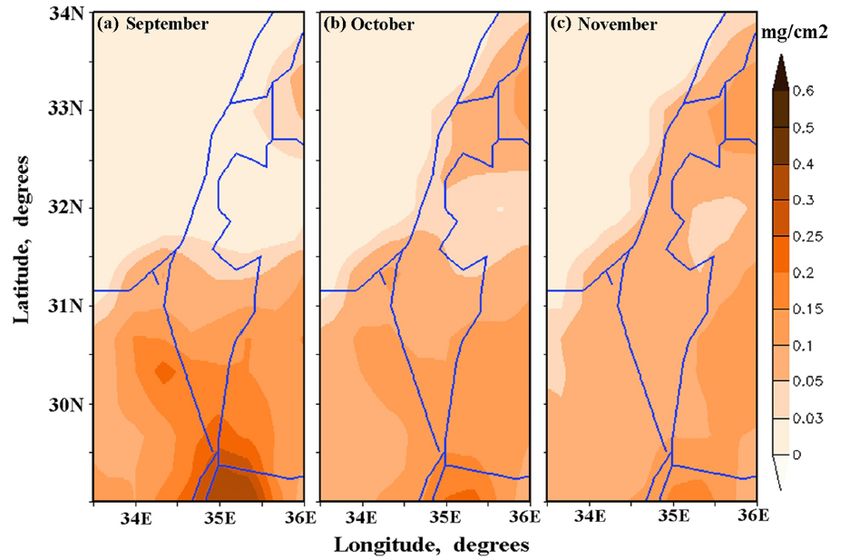
Atmosphere 2020, 11, 197                                                                                  7 of 17

      Figure 6. (a) Spatial distribution of measured annually‐accumulated dust dry deposition over Israel
      and surrounding areas (adapted from Ganor and Foner [9]). The measured annually‐accumulated
      dust dry deposition data were normalized on the annually‐accumulated dust deposition in
      Sede‐Boker (30.855° N, 34.782° E). (b) Comparison between modeled and measured
      annually‐accumulated dust dry deposition at the specified sites, located in the south–north direction
      along Israel: Sede‐Boker (30.855° N, 34.782° E), Beer‐Sheba (31.25° N; 34.80° E), Ashkelon (31.639° N;
      34.521° E), Ashdod (31.834° N; 34.637° E), Tel‐Aviv (32.085° N; 34.781° E), Hadera (32.47° N; 34.881°
      E), Haifa (32.79° N; 34.99° E), and Naharia (33.002° N; 35.091° E).

3.3. Seasonal Variations of Monthly‐Accumulated Dust Dry Deposition over Israel
     In order to further investigate the spatial non‐uniformity of dust dry deposition, we analyzed
the spatial distribution of seasonally‐accumulated DDD (Figure 7). DREAM showed a noticeable
difference in the patterns of seasonally‐accumulated DDD in various seasons. The model DDD
spatial distribution in winter, spring, and summer was similar to the distribution of
annually‐accumulated DDD, characterized by the maximum of DDD over southern Israel (Figure
7a–c). This allowed us to assume that local dust from the Negev Desert contributed to modeled DDD
over Israel in winter, spring, and summer. By contrast, in autumn, the spatial distribution of
modeled DDD, over the study region, was more uniform than in other seasons (Figure 7d). As
discussed in Section 3.4, we assume that the arrival of dust from Syria to northern and central Israel
led to this almost uniform spatial distribution of DDD in Israel in autumn.
     DREAM showed that, on average, during our study period, there were strong seasonal
variations of dry dust deposition with significant DDD in spring (March) and a decrease in DDD
from spring to autumn (Figure 8a,b). We also analyzed seasonal variations of DREAM‐based
monthly‐accumulated DDD over north‐east Africa (29° N–31.5° N; 28° E–33.5° E) (Figure 9). Our
analysis showed similar DDD seasonal variations over both north‐east Africa and Israel,
characterized by significant dust deposition in spring and a decrease in DDD from spring to
autumn. This similarity indicates the same causal factors responsible for the seasonal variations of
DDD over Israel and over north‐east Africa.
     We found that the above mentioned similar seasonal variations of DDD were associated with
similar seasonal variations of 14‐year mean surface wind speed. Figure 10 represents seasonal
variations of the 14‐year mean surface wind speed, averaged over north‐east Africa, and that
averaged over the southern part of the study region. One can see that surface wind speed in autumn
was lower than in other seasons (Figure 10). As mentioned, Mediterranean cyclones determine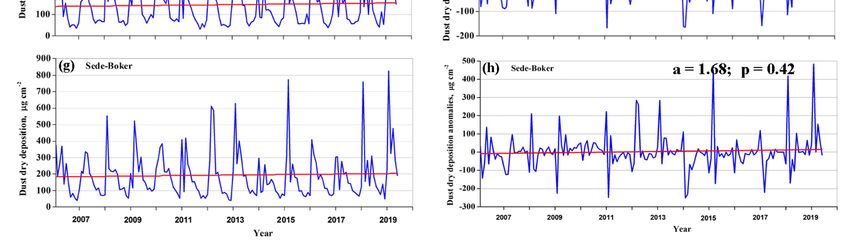
Atmosphere 2020, 11, 197                                                                              8 of 17

surface winds over the whole area of the south‐east Mediterranean, including north‐east Africa and
Israel. The obtained similar seasonal variations of wind speed prove this fact. The similar seasonal
variations of DDD and surface wind indicate the presence of a causal link between them.

      Figure 7. Spatial distribution of seasonally‐accumulated dust dry deposition over Israel and
      surrounding areas in (a) winter, (b) spring, (c) summer, and (d) autumn, averaged over the 14‐year
      study period.

     There was an essential difference in DDD values between the southern part, on the one hand,
and the central and northern parts, on the other hand. In particular, over the southern part, dust
deposition noticeably decreased from Sede‐Boker through Beer‐Sheba to Hafez‐Hayim, along a
distance of ~100 km (Figure 8). By contrast, along the same distance of ~100 km from Tel Aviv to
Haifa, there was almost no difference in dust deposition: seasonal variations of dust dry deposition
in Tel Aviv and Haifa coincided (Figure 8). Our findings imply an important point that local dust
from the Negev Desert and adjacent deserts in Sinai and Jordan significantly contributed to total
dust deposition over southern Israel, causing pronounced non‐uniformity of DDD over the study
region.
     Another factor should be taken into account, in order to understand seasonal variations of DDD
over northern Israel, where there is no local dust. Over the northern and central Israel (where
Tel‐Aviv and Haifa are located), the seasonal minimum of DDD was observed in July–August
(Figure 8). This was in contrast to southern Israel, where the seasonal minimum of DDD was
observed in October–November (Figure 8). As DREAM shows, over northern and central Israel, dust
dry deposition increases from September to November: it can be assumed some dust penetration
from Syria (Figure 11a–c). At the same time, from September to November, over southern Israel, a
decrease in dust dry deposition takes place (Figure 11a–c). This explains the different seasonal
minimum of DDD over northern and southern Israel.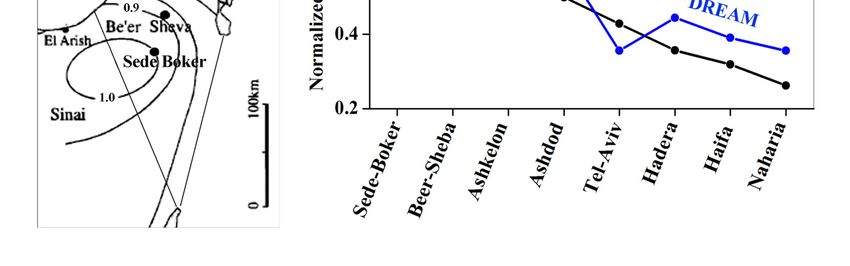
Atmosphere 2020, 11, 197                                                                                  9 of 17

      Figure 8. (a) Fourteen‐year mean seasonal variations of DREAM dust dry deposition at the specified
      sites located in the southern, central, and northern parts of Israel. (b) Geographic locations of the
      specified sites: Haifa (32.79° N; 34.99° E), Tel‐Aviv (32.085° N; 34.781° E), Hafez‐Hayim (31.79° N;
      34.81° E), Beer‐Sheba (31.25° N; 34.80° E), and Sede‐Boker (30.855° N, 34.782° E).

     Moreover, the above‐mentioned increase in DDD over northern Israel and the decrease over
southern Israel in November resulted in the almost uniform distribution of DDD over Israel.
Although, the dust deposition values were noticeably lower in November than in other seasons
(Figure 12).

      Figure 9. Fourteen‐year mean seasonal variations of DREAM dust dry deposition over north‐east
      Africa (29° N–31.5° N; 28° E–33.5° E).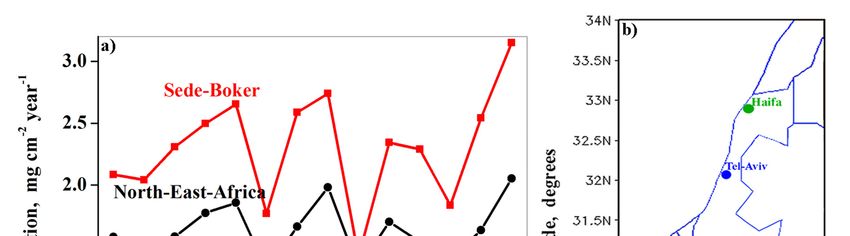
Atmosphere 2020, 11, 197                                                                                10 of 17

      Figure 10. Month‐to‐month variations of the 14‐year mean surface wind speed over (a) the southern
      part of the study region (29.5° N–31.5° N; 34.5° E–35.5° E) and (b) north‐east Africa (29° N–31.5° N;
      28° E–33.5° E), based on NASA MERRA reanalysis (2006–2019) [15,16]. The vertical lines designate
      standard deviation.

      Figure 11. Maps of 14‐year mean monthly‐accumulated dust dry deposition in (a) September, (b)
      October, and (c) November.
Atmosphere 2020, 11, 197 11 of 17
Figure 12. Maps of 14‐year mean monthly‐accumulated dust dry deposition in (a) January, (b).
March, and (c) July.
3.4. Trends
To obtain long‐term trends of DDD over the southern, central, and northern parts of Israel, the
obtained monthly‐accumulated model data at the specified sites were deseasonalized by removing
14‐year averages (2006–2019) from any given month (Figure 13). The slope of a linear fit was used to
determine trends of dust dry deposition (Figure 13). We found that there were no statistically
significant trends (at the 95% confidence level) in dust dry deposition at any of the specified sites in
Israel, during the 14‐year study period: all the obtained p‐values were essentially higher than 0.05
(Figure 13).
It was important to compare dust dry deposition trends in two different months, such as March
and November. In March, pronounced spatial non‐uniformity of DDD was observed (Figure 12b),
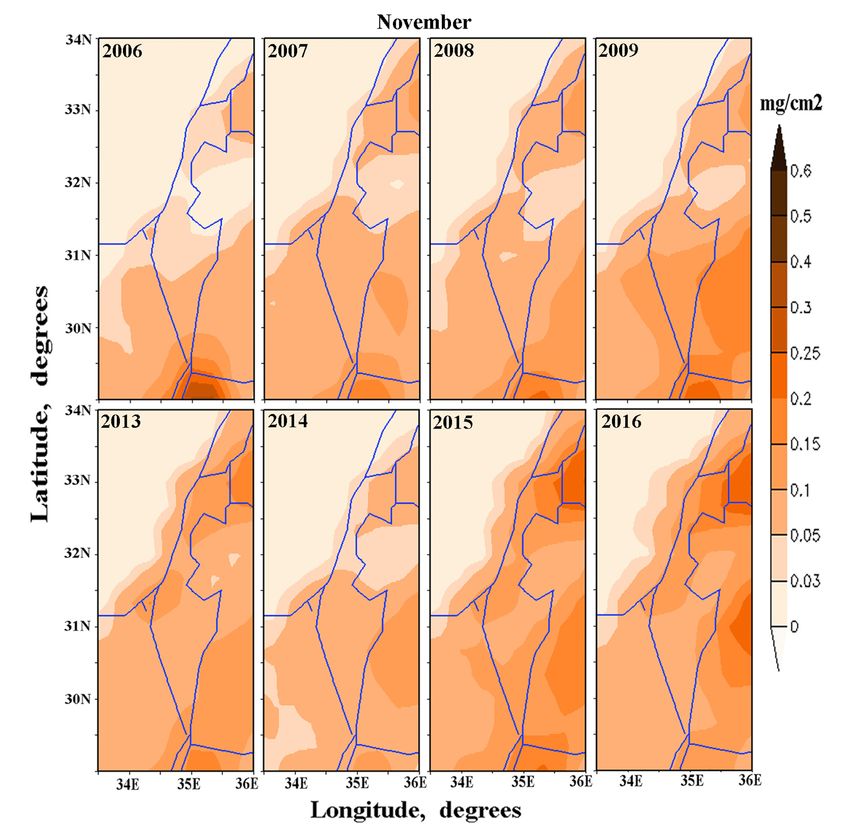
whereas in November, DDD was almost uniformly distributed (Figure 11c). Figure 14 represents
DDD trends in March and in November at the specified sites located in the southern, central, and
northern parts of Israel. One can see that, in March, there were no statistically significant trends in
DDD during the study period at any of the specified sites (Figure 14, the left panel). By contrast, in
November, there were statistically significant trends in DDD at 95% confidence level in Haifa,
Tel‐Aviv, and Beer‐Sheba: DDD increased from year‐to‐year during the 14‐year study period (Figure
14, the right panel). This fact is illustrated by Figure 15, representing patterns of
monthly‐accumulated dust dry deposition in November in the first four years (2006, 2007, 2008,
2009) and in 2013, 2014, 2015, 2016. It is seen that DDD over northern Israel increased from
year‐to‐year in November during the study period.Atmosphere 2020, 11, 197 12 of 17
Figure 13. Month‐to‐month variations of DREAM monthly‐accumulated dust dry deposition at the
specified sites located in the southern, central, and northern parts of Israel: (a) and (b) – Haifa; (c)
and (d) – Tel‐Aviv; (e) and (f) – Beer‐Sheba; (g) and (h) – Sede‐Boker. The left column represents
original monthly‐accumulated dust dry deposition at the specified sites, while the right column
represents their associated deseasonalized monthly anomalies. The straight red lines designate
linear fits characterized by the slope a [μg cm−2 year−1] and p values. One can see that all p values
were essentially higher than 0.05. Consequently, there were no statistically significant trends (at the
95% confidence level) in dust dry deposition at any of the specified sites during the study period.Atmosphere 2020, 11, 197 13 of 17
Figure 14. Year‐to‐year variations of DREAM monthly‐accumulated dust dry deposition at the
specified sites located in the southern, central, and northern parts of Israel in March (the left panel)
and November (the right panel): (a) and (b) – Haifa; (c) and (d) – Tel‐Aviv; (e) and (f) – Beer‐Sheba;
(g) and (h) – Sede‐Boker. The straight lines designate linear fits, characterized by the slope a [mg
cm−2 year−1] and p values. In November, the p‐values lower than 0.05 designate statistically
significant trends in DDD at the 95% confidence level in Haifa, Tel‐Aviv, and Beer‐Sheba.Atmosphere 2020, 11, 197 14 of 17
Figure 15. Comparison between monthly‐accumulated dust dry deposition over the study region in
November in 2006, 2007, 2008, 2009 (top panel) and that in 2013, 2014, 2015, 2016 (bottom panel).
We used a correlation matrix to investigate a relationship between DDD variations from
year‐to‐year at the specified sites (Tables 2 and 3). One can see that, in November, the year‐to‐year
variations of DDD in Haifa, Tel‐Aviv, and Beer‐Sheba were highly correlated due to increasing DDD
(Table 2). In March, however, there was no correlation between these year‐to‐year variations of DDD
in Haifa, Tel‐Aviv, and Beer‐Sheba (Table 3). Because of the proximity of Sede‐Boker and Beer‐Sheba
to the Negev Desert, there is always a high correlation of 0.8 between DDD in those sites (Tables 2
and 3).
Table 2. Correlation matrix for year‐to‐year variations in DDD in Haifa, Tel‐Aviv, Beer‐Sheba, and
Sede‐Boker in November during the study period (2006–2019). The numbers represent correlation
coefficients together with their standard error. The bold numbers highlight the high correlation
between Beer‐Sheba and Haifa, as well as between Beer‐Sheba and Tel‐Aviv in November.
Haifa Tel‐Aviv Beer‐Sheba Sede‐Boker
Haifa 1.00 0.99 ± 0.01 0.85 ± 0.10 0.40 ± 0.20
Tel‐Aviv 0.99 ± 0.01 1.00 0.90 ± 0.10 0.40 ± 0.20
Beer‐Sheba 0.85 ± 0.10 0.90 ± 0.10 1.00 0.80 ± 0.10
Sede‐Boker 0.40 ± 0.20 0.40 ± 0.20 0.80 ± 0.10 1.00Atmosphere 2020, 11, 197 15 of 17
Table 3. Correlation matrix for year‐to‐year variations in DDD in Haifa, Tel‐Aviv, Beer‐Sheba, and
Sede‐Boker in March during the study period (2006–2019). The numbers represent correlation
coefficients together with their standard error. The bold numbers highlight the low correlation
between Beer‐Sheba and Haifa, as well as between Beer‐Sheba and Tel‐Aviv in March, compared to
those in November (Table 2).
Haifa Tel‐Aviv Beer‐Sheba Sede‐Boker
Haifa 1.00 0.95 ± 0.03 0.10 ± 0.20 −0.20 ± 0.20
Tel‐Aviv 0.95 ± 0.03 1.00 0.30 ± 0.20 −0.01 ± 0.20
Beer‐Sheba 0.10 ± 0.20 0.30 ± 0.20 1.00 0.95 ± 0.03
Sede‐Boker −0.20 ± 0.20 −0.01 ± 0.20 0.95 ± 0.03 1.00
4. Conclusions
Similar quasiperiodic year‐to‐year variations of DDD with a two–three‐year period were found
over Israel and north‐east Africa. The similarity indicates that the quasiperiodic variations were
caused by the same factors. This phenomenon of quasiperiodic interannual variations of DDD has
not been discussed in previous publications. The quasiperiodic interannual variations of DDD were
associated with similar interannual variations of surface wind speed over Israel and north‐east
Africa. DREAM also showed similar seasonal variations of DDD over both Israel and north‐east
Africa, characterized by significant dust deposition in spring and a decrease in DDD from spring to
autumn. These seasonal variations of DDD were associated with the similar seasonal variations of
surface wind speed over Israel and north‐east Africa. The obtained similar interannual and seasonal
variations of DDD and surface wind indicate a causal link between them. Dust occurrence in the
south‐east Mediterranean is associated with cyclonic activity all over the Mediterranean basin [4,14].
The Mediterranean cyclones determine the surface winds over the whole area of the south‐east
Mediterranean, including north‐east Africa and Israel, causing similar interannual and seasonal
variability of DDD.
Using daily data from DREAM model runs at Tel Aviv University from 2006 to 2019, we found
that, on average, during the 14‐year study period, in the winter, spring, and summer months, the
spatial distribution of monthly‐accumulated dust dry deposition over Israel was non‐uniform with
the maximum of DDD over southern Israel. This maximum was determined by the significant
contribution of local dust from the Negev Desert (and adjacent deserts in Sinai and Jordan) to the
total dust deposition over Israel.
In the autumn months (November), DREAM showed an increase in dust dry deposition over
northern and central Israel from year‐to‐year, resulting in the almost uniform distribution of DDD
over Israel. As there is no local dust over northern and central Israel, it can be assumed that the
observed increase in dust dry deposition from year‐to‐year in November was associated with
increasing dust penetration from Syria.
The obtained specific features of spatio‐temporal distribution of DDD will advance the general
understanding of the dust‐related problems, such as negative effects of DDD on the performance of
solar panels in the south‐eastern Mediterranean and in Israel in particular. Moreover, this
knowledge is helpful for preventing insulator flashover in the regional power electric networks.
Author Contributions: All co‐authors equally contributed to the methodology and writing of the current
research article: P.K., E.V., B.S., P.A., S.N.; DREAM model development: S.N.; DREAM runs: P.K. All authors
have read and agreed to the published version of the manuscript.
Funding: This research received no external funding.
Acknowledgments: The authors acknowledge support from the EU COST Action CA16202 “International
Network to Encourage the Use of Monitoring and Forecasting Dust Products (InDust)”. We thank Slavko
Petkovic for help with the DREAM model. We thank all reviewers for their helpful comments.
Conflicts of Interest: The authors declare no conflict of interest.Atmosphere 2020, 11, 197 16 of 17
References
1. Lelieveld, J.; Berresheim, H.; Borrmann, S.; Crutzen, P.J.; Dentener, F.J.; Fischer, H.; Feichter, J.; Flatau, P.J.;
Heland, J.; Holzinger, R.; et al. Global air pollution crossroads over the Mediterranean. Science 2002, 298,
794–799, doi:10.1126/science.1075457.
2. Provençal, S.; Buchard, V.; da Silva, A.; Leduc, R.; Barrette, N.; Elhacham, E.; Wang, S.‐H. Evaluation of
PM2.5 surface concentration simulated by Version 1 of the NASA’s MERRA Aerosol Reanalysis over Israel
and Taiwan. Aerosol Air Qual. Res. 2017, 17, 253–261, doi:10.4209/aaqr.2016.04.0145.
3. Kushelevsky, A.; Shani, G.; Haccoun, A. Effect of meteorologic conditions on total suspended particulate
(TSP) levels and elemental concentration of aerosols in a semi‐arid zone (Beer‐Sheva, Israel). Tellus B 1983,
35, 55–64, doi:10.3402/tellusb.v35i1.14586.
4. Dayan, U.; Ziv, B.; Shoob, T.; Enzel, Y. Suspended dust over southeastern Mediterranean and its relation to
atmospheric circulation. Int. J. Climatol. 2008, 28, 915–924, doi:10.1002/joc.1587.
5. Biryukov, S. An experimental study of the dry deposition mechanism for airborne dust. J. Aerosol Sci. 1998,
29, 129–139, doi:10.1016/S0021‐8502(97)00037‐2.
6. Abdul, M.S.; Albaalib, G.; Alasisc, E.; Kaldellis, J.K. Experimental study on the effect of dust deposition on
solar photovoltaic panels in desert environment. Renew. Energy 2016, 92, 499–505,
doi:10.1016/j.renene.2016.02.031.
7. Volpov, E.; Kishcha, P. An Advanced Technique for Outdoor Insulation Pollution Mapping in the Israel
Electric Company Power Grid. IEEE Trans. Dielectr. Electr. Insul. 2017, 24, 3539–3548,
doi:10.1109/TDEI.2017.006917.
8. Singer, A.; Ganor, E.; Fried, M.; Shamay, Y. Throughfall deposition of sulfur to a mixed oak and pine forest
in Israel. Atmos. Environ. 1996, 30, 3881–3889, doi:10.1016/1352-2310(96)00065-9.
9. Ganor, E.; Foner, H.A. Mineral dust concentrations, deposition fluxes and deposition velocities in dust
episodes over Israel. J. Geophys. Res. Atmos. 2001, 106, 18431–18437, doi:10.1029/2000JD900535.
10. Kishcha, P.; Barnaba, F.; Gobbi.; P.; Alpert, P.; Shtivelman, A.; Krichak, S.O.; Joseph, J.H. Vertical
distribution of Saharan dust over Rome: Comparison between 3‐year model predictions and lidar
soundings. J. Geophys. Res. 2005, 110, D06208, doi:10.1029/2004JD005480.
11. Kishcha, P.; Alpert, P.; Shtivelman, A.; Krichak, S.; Joseph, J.; Kallos, G.; Spyrou, C.; Gobbi, G.P.; Barnaba,
F.; Nickovic, S.; et al. Forecast errors in dust vertical distributions over Rome (Italy): Multiple particle size
representation and cloud contributions. J. Geophys. Res. 2007, 112, D15205, doi:10.1029/2006JD007427.
12. Kishcha, P.; Nickovic, S.; Ganor, E.; Kordova, L.; Alpert, P. Saharan dust over the Eastern Mediterranean:
Model Sensitivity. In Book Air Pollution Modeling and Its Application XIX; Springer: Dordrecht, The
Netherlands 2008; Chapter 4.2, pp. 358–366, ISSN 1874‐6519, doi:10.1007/978‐1‐4020‐8453‐9_39.
13. Nickovic, S.; Kallos, G.; Papadopoulos, A.; Kakaliagou, O. A model for prediction of desert dust cycle in the
atmosphere. J. Geophys. Res. 2001, 106, 18113–18130.
14. Ganor, E.; Osetinsky, I.; Stupp, A.; Alpert, P. Increasing trend of African dust, over 49 years, in the eastern
Mediterranean. J. Geophys. Res. 2010, 115, D07201, doi:10.1029/2009JD012500.
15. M2IMNXLFO–NASA MERRA2 Reanalysis including Data Assimilation; Monthly Mean Surface Wind
Speed at the Surface Layer Height of Approximately 60 m. Version 5.12.4; doi:10.5067/11F99Y6TXN99.
Available online: https://disc.gsfc.nasa.gov/datasets/M2IMNXLFO_V5.12.4/summary. (accessed on 12
February 2020).
16. Randles, C.A.; da Silva, A.M.; Buchard, V.; Colarco, P.R.; Darmenov, A.; Govindaraju, R.; Smirnov, A.;
Holben, B.; Ferrare, R.; Hair, J.; et al. The MERRA‐2 aerosol reanalysis, 1980 onward. Part I: System
description and data assimilation evaluation. J. Climate. 2017. 30, 6823–6850.
17. Reanalysis Data Assimilation. Available online:
https://climatedataguide.ucar.edu/climate‐data/simplistic‐overview‐reanalysis‐data‐assimilation‐methods
(accessed on 12 February 2020).
18. Basart, S.; Perez, C.; Nickovic, S.; Cuevas, E.; Baldasano, J.M. Development and evaluation of the
BSC‐DREAM8b dust regional model over Northern Africa, the Mediterranean and the Middle East. Tellus
B 2012, 64, 18539, doi:10.3402/tellusb.v64i0.18539.Atmosphere 2020, 11, 197 17 of 17
19. Giorgi, F. A particle dry‐deposition parameterization for use in tracer transport models. J. Geophys. Res.
1986, 91, 9794–9806.
20. A Tutorial on Standard Errors. Available online:
http://www.minerazzi.com/tutorials/a‐tutorial‐on‐standard‐errors.pdf (accessed on 12 February 2020).
© 2020 by the authors. Licensee MDPI, Basel, Switzerland. This article is an open access
article distributed under the terms and conditions of the Creative Commons Attribution
(CC BY) license (http://creativecommons.org/licenses/by/4.0/).You can also read