Leaching Kinetics and Mechanism of Laterite with NH4Cl-HCl Solution
←
→
Page content transcription
If your browser does not render page correctly, please read the page content below
minerals
Article
Leaching Kinetics and Mechanism of Laterite with
NH4Cl-HCl Solution
Jinhui Li *, Yang Yang, Yaoru Wen, Wenxin Liu, Yuhang Chu, Ruixiang Wang and Zhifeng Xu *
 Faculty of Materials Metallurgy and Chemistry, Jiangxi University of Science and Technology,
 Ganzhou 341000, China; 17726959101@163.com (Y.Y.); yaoruwen@163.com (Y.W.);
 m15211356650@163.com (W.L.); a1299300139@163.com (Y.C.); wrx9022@163.com (R.W.)
 * Correspondence: jinhuili@jxust.edu.cn (J.L.); xu.zf@jxust.edu.cn (Z.X.)

 Received: 10 July 2020; Accepted: 21 August 2020; Published: 26 August 2020

 Abstract: Following the growing demand for Ni and Co and the dwindling supplies of sulfide
 nickel ore, attention has turned toward the more efficient exploitation and utilization of laterite ore.
 Using ammonium chloride acid solution to leach is an effective method. Our research concerned
 investigations on the leaching mechanism and leaching kinetics of laterite. XRD was used to
 demonstrate the leaching mechanism through analysis of the pattern of the leaching residue and
 raw ore, showing that acid concentration affects the leaching process more significantly than other
 factors, and that valuable metals are mainly released from goethite and serpentine. The leaching
 order of these materials are as follows: Goethite > serpentine > magnetite and hematite. The leaching
 kinetics were analyzed and this leaching process followed a shrinking core model controlled by a
 combination of interfacial transfer and diffusion across the solid film. Leaching data fitted to the
 kinetic equation perfectly, and the apparent activation energies for the leaching of nickel, cobalt,
 and iron were calculated to be 4.01 kJ/mol, 3.43 kJ/mol, and 1.87 kJ/mol, respectively. The Arrhenius
 constants for Ni, Co, and Fe were 204.38, 16.65, and 7.12 × 10⁻³ , respectively, with reaction orders of
 Ni (a 1.32, b 0.85, c 1.53), Co (a 1.74, b 1.12, c 1.22), and Fe (a 2.52, b −0.11, c 0.94).

 Keywords: laterite ore; leaching kinetics; mineral dissolution; chloride leaching; kinetic models

1. Introduction
      Nickel ranks as the fifth most abundant element after Fe, O, Si, and Mg in the Earth’s crust,
and nickel usually exists as oxides, sulphides, deep-sea nodules, and silicates [1]. Nickel resources
with regards to land reserves are 0.47 billion tons and are present in two principal ore deposit types:
60% of sulfide ore and 40% of laterite ore [2]. Due to its special metallurgical advantages, nickel is a
very important metal that is widely used in many industries, especially for the preparation of stainless
steel and nonferrous alloys helping to increase corrosion resistance and impact strength [3]. Globally,
nearly 85% of nickel is consumed by the alloy and stainless steel industry to impart various materials
with certain physical and chemical properties [4,5]. The global demand and the price of nickel and
cobalt has increased continuously over recent years, and the sulfide ores have gradually been depleted.
Attention has thus been directed to the development of selective leaching from laterite ores [6–8].
In contrast to sulfide ores, laterite cannot be readily concentrated because of its low nickel content and
the isomorphic goethite or serpentine crystalline structure. The production of nickel from laterites,
therefore, usually requires more processing and consumes more energy, leading to greater extraction
of nickel from sulfide [9–11].
      In recent years, much attention has been directed toward the development of novel methods to
exploit nickel laterite ores, such as hydrometallurgy, pyrometallurgy, and biometallurgy [12]. Due to
economic reasons, sulfuric acid has been predominantly used. For example, the pressure leaching

Minerals 2020, 10, 754; doi:10.3390/min10090754                                 www.mdpi.com/journal/minerals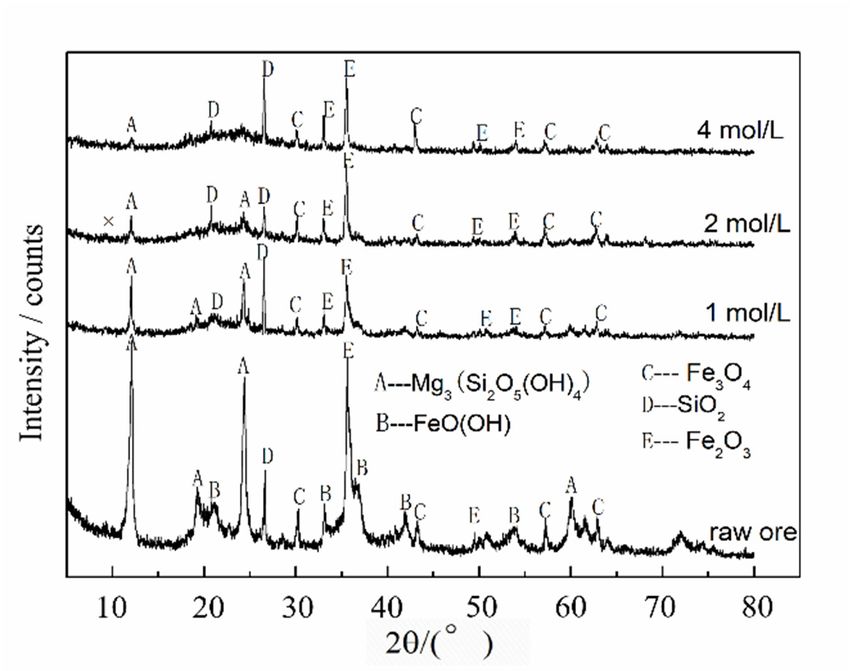
Minerals 2020, 10, 754 2 of 11
(PAL) process and high-pressure leaching (HPAL) processes are the preferred methods used to leach
nickel and cobalt from limonite laterites, the merit of these processes being that iron can be precipitated
as hematite [13,14].
However, the PAL and HPAL processes have relatively high operational costs, require significant
investment, and have high energy consumption at the commercial level compared with atmospheric
pressure leaching (AL) [15]. The atmospheric pressure hydrometallurgical process uses sulfuric acid,
hydrochloric acid, and citric acid to leach various types of nickel laterite ores [16,17]. Although
the atmospheric pressure leaching processes successfully extract Ni and Co, these processes usually
consume much more acid and leach a higher number of Fe and Mg purities, which impede their further
application [18,19].
In contrast with other conventional hydrometallurgical and pyrometallurgical processes, chloride
metallurgy processes have several advantages, such the comparatively higher leaching from mixed
ores, higher leaching selectivity, and easier regeneration of leaching reagents [20–23]. In order to
determine and optimize the best processing conditions, kinetic analysis must be comprehensively
conducted [4,24,25]. Thus, kinetic studies should be conducted to further determine the mechanism of
leaching with ammonium chloride-hydrochloric acid solution, which has been presented in previous
work, in order to provide a theoretical reference for its industrial application. In this paper, factors
such as leaching time, acid concentration, and leaching temperature are taken into account for kinetic
analysis. Mineralogical analyses of the raw ore and the different leaching residues with regards to
leaching time, acid concentration, and leaching temperature were conducted to better elucidate the
leaching behaviors of various metals. The leaching order of minerals is beneficial to the investigation
of mineral stability and the influence of Ni and Co dissolution under the proposed leaching conditions.
2. Experimental and Analytical Methods
2.1. Materials
The tested samples were obtained from Yuanjiang Laterite deposit, which consists of various
mixed ores obtained at different surface depths. The ores should be dried and crushed before the
leaching. In this paper, the tested samples were sieved through 150 mesh and a particle size fraction of
0.074–0.15 mm was used as materials for leaching experiments. The content of the different elements
in the laterite sample are shown in Table 1.
Table 1. The content of different elements in laterite sample.
Elements Ni Co Mn Fe Cu Ca Mg Al Si Na
Content% 1.15 0.08 0.35 14.06 0.07 0.12 29.35 0.34 23.13 0.26
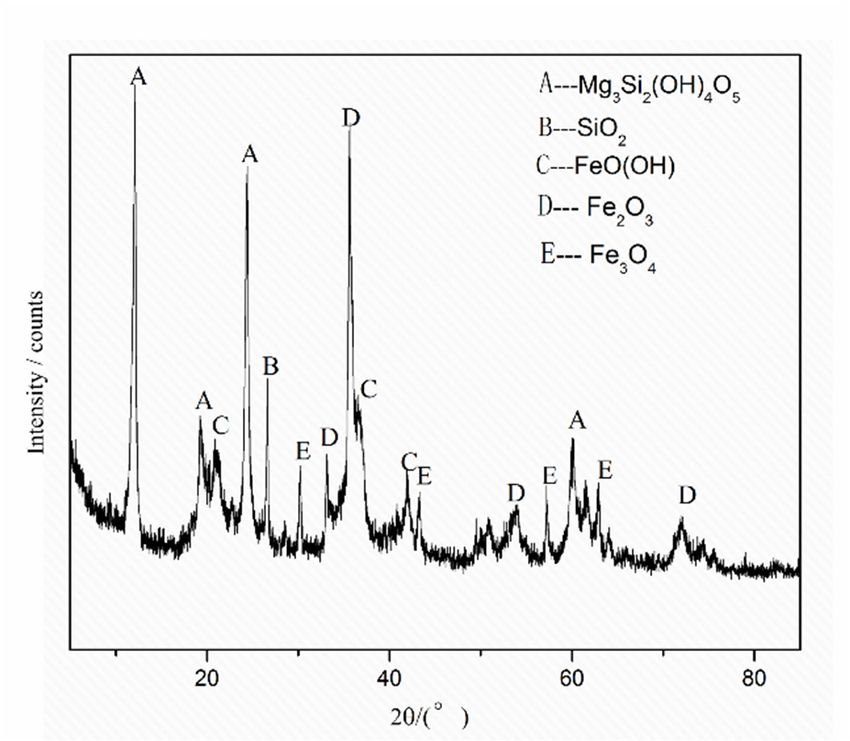
Mineralogical analysis (Figure 1) showed that the main minerals were serpentine
(Mg3 [Si2 O5 (OH)4 ]), silica (SiO2 ), and some iron oxides including magnetite (Fe3 O4 ), hematite (Fe2 O3 ),
and goethite (FeO(OH)). Although there is not a single nickel mineral, nickel usually exists through
surface adsorption and lattice replacement in laterite ore [4].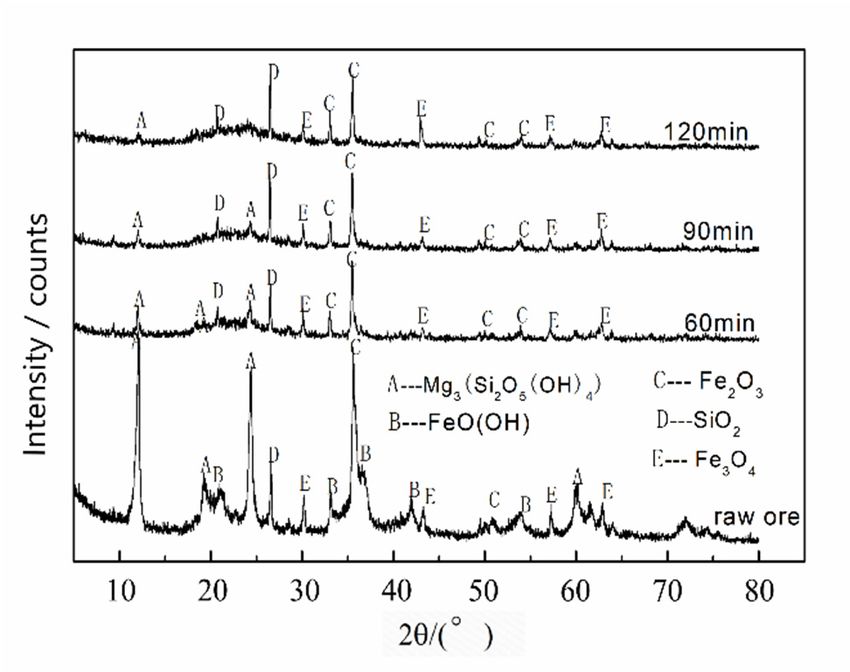
Minerals 2020,10,
Minerals2020, 10,754
x FOR PEER REVIEW 33of
of11
11
Figure1.1. XRD
Figure XRD pattern
patternof
ofthe
thelaterite
lateritesample.
sample.
2.2. Methods
2.2. Methods
All leaching experiments were performed in a three-necked flask, which was set in a water bath,
All leaching experiments were performed in a three-necked flask, which was set in a water bath,
and the stirring speed was fixed at 300 rpm. Hydrochloric acid solution at different concentrations
and the stirring speed was fixed at 300 rpm. Hydrochloric acid solution at different concentrations
was used as lixiviant with addition of ammonium chloride. The mineral samples were added into the
was used as lixiviant with addition of ammonium chloride. The mineral samples were added into the
solution and heated to a certain temperature. After some time, the residue and leaching solution were
solution and heated to a certain temperature. After some time, the residue and leaching solution were
collected, respectively, through filtration. The leaching of Ni, Co, Mn, Mg, and Fe was determined
collected, respectively, through filtration. The leaching of Ni, Co, Mn, Mg, and Fe was determined
under different leaching conditions.
under different leaching conditions.
2.3. Analytical Methods
2.3. Analytical Methods
X-ray diffraction analyzer (Rint-2000, Bruker corporation, Karlsruhe, Germany) was used to
X-ray the
determine diffraction
structureanalyzer (Rint-2000,
of raw ores Brukerresidues.
and leaching corporation,
AtomicKarlsruhe,
absorptionGermany) was used to
spectrophotometry
determinewas
(Ruli-160) theused
structure of raw the
to determine orescontent
and leaching
of Ni, Co,residues.
and Mn Atomic absorption
in the leaching spectrophotometry
solution. The Fe content
(Ruli-160) was used to determine the content
was determined via potassium permanganate titration methods.of Ni, Co, and Mn in the leaching solution. The Fe
content was determined via potassium permanganate titration methods.
3. Results and Discussion
3. Results and Discussion
3.1. Leaching Mechanism
3.1. Leaching Mechanism
On the basis of previous work, the optimal leaching conditions consisted of a temperature of
90 ◦ C,On the basis ofchloride
ammonium previous work, the optimal
concentration leaching
of 3 mol/L, conditions consisted
a hydrochloric of a temperature
acid concentration of 90
of 2 mol/L,
a°C, ammonium
liquid–solid chloride
ratio of 6:1, concentration
and leaching timeof 3 ofmol/L,
1.5 h a[22].
hydrochloric acid experiments
The following concentrationwereof 2based
mol/L, ona
liquid–solid
this ratiocondition.
optimization of 6:1, and leaching to
According time
ore of 1.5 hanalysis
phase [22]. The following
(Figure 1), theexperiments were based
majority of valuable metalson
this
in optimization
this condition.
laterite ore exists Accordingoftoferrite,
as composites ore phase analysis
silicate, or oxide(Figure 1), the
in certain majority
kinds of valuable
of mineralogical
metals such
phases in this laterite layered
as goethite, ore exists as compositesand
montmorillonite, of serpentine.
ferrite, silicate, or oxide
Therefore, in essential
it was certain kinds
to studyof
mineralogical
the dissolutionphases
mechanismsuch as goethite,
of these layered
minerals to montmorillonite, and serpentine.
optimize the selective Therefore,
leaching process it was
of laterite.
essentialreactions
Possible to studyconcerning
the dissolution
these mechanism
valuable metals of these
are asminerals
follows: to optimize the selective leaching
process of laterite. Possible reactions concerning these valuable metals are as follows:
NiFe2 O4 (s) + 2H + =+ Ni2+2+ + Fe2 O3 (s) + H2 O(l) (1)
NiFe2O4 ( s) + 2 H = Ni + Fe2O3 ( s) + H 2O(l ) (1)
CoFe2 O4 (s) + 2H + =+ Co2+2+ + Fe2 O3 (s) + H2 O(l) (2)
CoFe2O4 ( s) + 2 H = Co + Fe2O3 ( s) + H 2O(l ) (2)
MnFe2 O4 (s) + 2H + =+ Mn2+ + Fe2 O3 (s) + H2 O(l) (3)
MnFe2O4 ( s) + 2 H = Mn2+ + Fe2O3 ( s) + H 2O(l ) (3)
2NiO · SiO2 (s) + 4H + = 2Ni2+ + SiO2 (s) + 2H2 O(l) (4)
2 NiO ⋅ SiO2 (s) + 4H + = 2 Ni 2+ + SiO2 (s) + 2H 2O(l ) (4)
2CoO · SiO2 (s) + 4H + = 2Co2+ + SiO2 (s) + 2H2 O(l) (5)
2CoO ⋅ SiO2 (s) + 4H + = 2Co2+ + SiO2 (s) + 2H 2O(l ) (5)
2MnO · SiO2 (s) + 4H + = 2Mn2+ + SiO2 (s) + 2H2 O (6)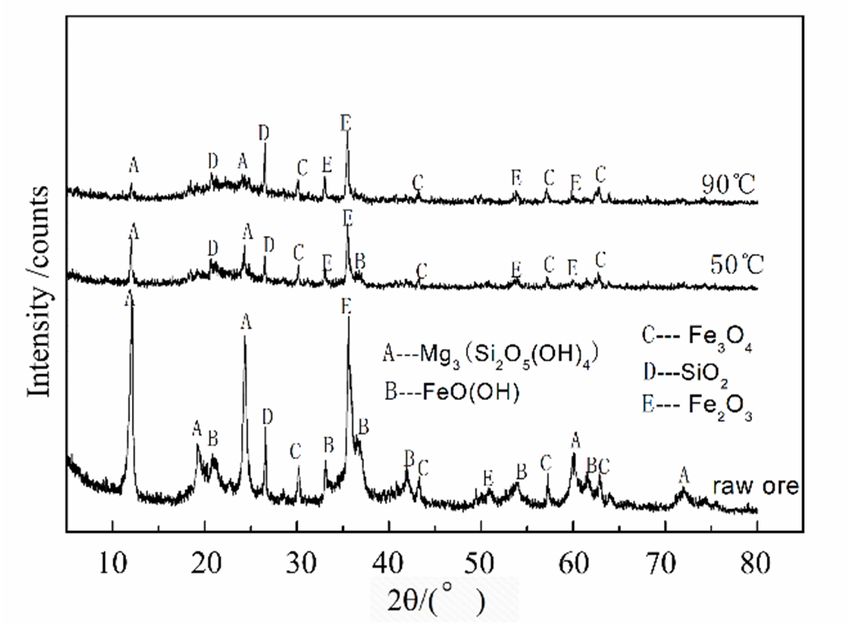
Minerals 2020, 10, x FOR PEER REVIEW 4 of 11
Minerals 2020, 10, 754 4 of 11
2MnO⋅ SiO2 (s) + 4H + = 2Mn2+ + SiO2 (s) + 2H2O(l ) (6)
NiO( s) + 2H + = Ni 2+ + H 2O(l ) (7)
NiO(s) + 2H + = Ni2+ + H2 O(l) (7)
CoO(s) + 2H + = Co2+ + H O(l ) (8)
CoO(s) + 2H + = Co2+ + H2 2 O(l) (8)
FeO(FeO
OH()(
OHs))(+s)3H H +==Fe
+ 3+ Fe33++ ++22H
H 2OO
(l ) (9)
2 (l) (9)
+ 3+
Fe2Fe
O32(Os3)(+ + 6+
s ) 6H H ==2Fe + 33H
2 Fe3+ + H 22O
O((ll)) (10)
(10)
FeOOH
FeOOH (s)HCl
(s) + + HCl
→→FeOCl
FeOCl((ss))+
+ HH2O(l() l)
2O (11)
(11)
The
Theleaching
leachingmechanism
mechanismof oflaterite
lateritenickel
nickelore
orein
inacidic
acidicsolution
solutionwas wasstudied
studiedby bycomparing
comparingthe the
XRD
XRDpatterns
patternsofof different
differentleaching residues
leaching andand
residues raw raw
ore tooreobserve
to observeany changes in characteristic
any changes peaks.
in characteristic
The leaching
peaks. temperature,
The leaching acid concentration,
temperature, and leaching
acid concentration, time as
and leaching important
time parameters
as important for the
parameters for
leaching process were studied comprehensively.
the leaching process were studied comprehensively.
In
InFigure
Figure2,2,the theXRD
XRDdiagram
diagramof ofdifferent
differentleaching
leachingresidues
residues(raw (rawore
orepattern
patternincluded)
included)showsshows
that most characteristic goethite peaks at 2θ are 22.1◦ , 33.6◦ , 36.8◦ , 42.8◦ , and 54.1◦ , which changed
that most characteristic goethite peaks at 2θ are 22.1°, 33.6°, 36.8°, 42.8°, and 54.1°, which changed
following
following an anincrease
increaseininthetheconcentration
concentrationofofhydrochloric
hydrochloricacid. acid. They
They diminished
diminished gradually
gradually and and
eventually
eventuallydisappeared
disappeared at at
an an
acidacid
concentration of 2 mol/L.
concentration The characteristic
of 2 mol/L. serpentine
The characteristic peaks became
serpentine peaks
gradually weaker and
became gradually evenand
weaker disappeared at high concentrations
even disappeared of HCl of
at high concentrations at HCl
2θ angles
at 2θ of 12.1◦of
angles , 24.2 ◦,
12.1°,
and 60.1 ◦ , which is similar to that of goethite. The characteristic 12.1◦ serpentine peaks were still
24.2°, and 60.1°, which is similar to that of goethite. The characteristic 12.1° serpentine peaks were
present at an acid
still present at anconcentration of 4 mol/L,
acid concentration of 4 which
mol/L,means
whichthat serpentine
means is more stable
that serpentine is more than goethite
stable than
under these leaching conditions. Magnetite and hematite were still present in the
goethite under these leaching conditions. Magnetite and hematite were still present in the residues, residues, even when
the
evenHClwhenconcentration was increased
the HCl concentration wastoincreased
4 mol/L. toThe disappearance
4 mol/L. of the goethite
The disappearance of thepeaks suggests
goethite peaks
that goethite
suggests thatdissolves
goethite more readily
dissolves morethan hematite
readily thanand magnetite,
hematite and which signifies
magnetite, whichthat the ironthat
signifies in the
the
solution
iron in theoriginated
solutionmostly from the
originated goethite.
mostly fromThethe order of dissolution
goethite. The orderofofthese mineralsofwith
dissolution theseincreasing
minerals
HCl
withconcentration
increasing HCl goethite > serpentine
areconcentration > magnetite
are goethite ≈ hematite.
> serpentine > magnetite ≈ hematite.
Figure2.2.XRD
Figure XRDdiagram
diagramof
ofleaching
leachingresidues
residuesatatdifferent
differentacid
acidconcentration.
concentration.
Figure 3 shows the XRD (raw ore pattern included) spectra obtained from leaching experiments at
Figure 3 shows the XRD (raw ore pattern included) spectra obtained from leaching experiments
different temperatures. It shows that between temperatures of 50 ◦ C and 90 ◦ C, certain characteristic
at different temperatures. It shows that between temperatures of 50 °C and 90 °C, certain
peaks corresponding to goethite and serpentine diminished and even disappeared. The residue did
characteristic peaks corresponding to goethite and serpentine diminished and even disappeared. The
not contain any goethite at a temperature of 90 ◦ C. This illustrates that the leaching temperature had
residue did not contain any goethite at a temperature of 90 °C. This illustrates that the leaching
a greater influence on goethite than serpentine. As shown in Figure 3, the magnetite mineral was
temperature had a greater influence on goethite than serpentine. As shown in Figure 3, the magnetite
affected by the leaching temperature similarly to the hematite mineral, and nearly all the characteristic
mineral was affected by the leaching temperature similarly to the hematite mineral, and nearly all
peaks corresponding to hematite and magnetite were present at this temperature. The fact that most of
the characteristic peaks corresponding to hematite and magnetite were present at this temperature.
the serpentine dissolved can be concluded from Figure 3 due to a decrease in the amount of serpentine
The fact that most of the serpentine dissolved can be concluded from Figure 3 due to a decrease in
and an increase in the amount of SiO2 .
the amount of serpentine and an increase in the amount of SiO2.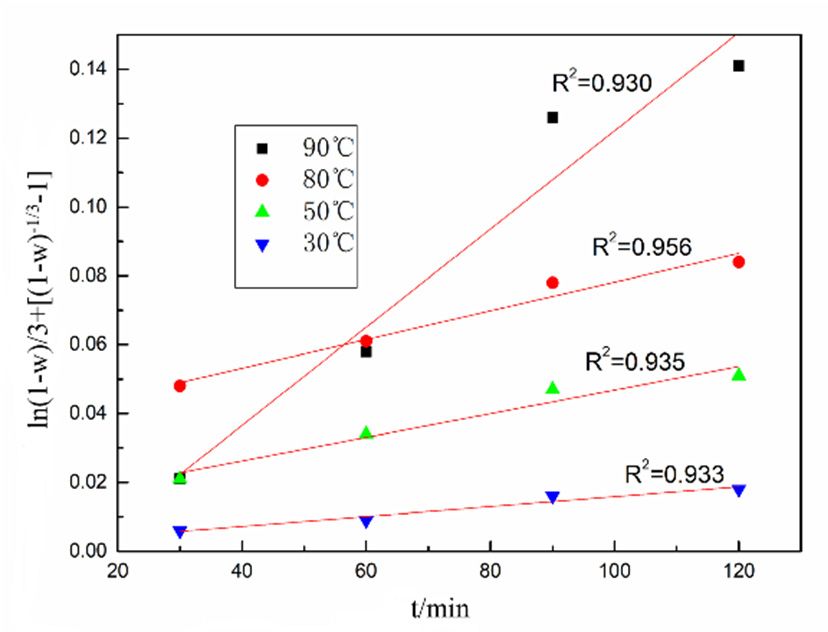
Minerals2020,
Minerals 2020,10,
10,754
x FOR PEER REVIEW 55of
of11
11
Minerals 2020, 10, x FOR PEER REVIEW 5 of 11
Figure 3.
Figure 3. Leaching
Leaching residues’
residues’ XRD
XRD diagram
diagram at
at different
differentleaching
leachingtemperatures.
temperatures.
Figure 3. Leaching residues’ XRD diagram at different leaching temperatures.
The main
The main changes
changes inin the
the content
content of
of different
differentminerals
minerals according
according to
to leaching
leaching time
time isis shown
shown in
in
The main changes in the content of different minerals according to leaching time is shown in
Figure 4.4. The characteristic
Figure characteristic Goethite
Goethite peaks
peaks nearly
nearly disappeared,
disappeared, and
and the
the characteristic
characteristic serpentine
serpentine
Figure 4. The characteristic Goethite peaks nearly disappeared, and the characteristic serpentine
peaks diminished
peaks diminished significantly
significantly after
after the
the laterite
lateritewas
wasleached
leachedfor
for60
60min.
min. The
The characteristic
characteristic peaks
peaks
peaks diminished significantly after the laterite was leached for 60 min. The characteristic peaks
corresponding to
corresponding to goethite
goethite disappeared
disappeared prior
prior to
to serpentine,
serpentine, indicating
indicating that
that goethite
goethite can
can be
be leached
leached
corresponding to goethite disappeared prior to serpentine, indicating that goethite can be leached
morereadily
more readilythan
thanserpentine.
serpentine.TheThe characteristic
characteristicpeaks
peaks corresponding
correspondingto tomagnetite
magnetiteandandhematite
hematitewerewere
more readily than serpentine. The characteristic peaks corresponding to magnetite and hematite were
stillpresent
still presentin
inthe
theleaching
leachingresidue
residueatataaleaching
leachingtime
timeofof120
120min
min(Figure
(Figure4),
4),suggesting
suggestingthat
thathematite
hematite
still present in the leaching residue at a leaching time of 120 min (Figure 4), suggesting that hematite
andmagnetite
and magnetiteare
arerelatively
relativelystable.
stable.
and magnetite are relatively stable.
Figure 4. Leaching residues’ XRD diagram at different leaching times.
Figure 4. Leaching residues’ XRD diagram at different leaching times.
Figure 4. Leaching residues’ XRD diagram at different leaching times.
3.2. Leaching Kinetics
3.2. Leaching Kinetics
The process
3.2. Leaching of laterite leaching with ammonium chloride hydrochloric acid solution is a typical
Kinetics
solid–liquid reaction.
The process However,
of laterite the with
leaching curves for leaching
ammonium rate vs.
chloride time for Ni,acid
hydrochloric Co,solution
and Fe did not fit
is a typical
The process of laterite leaching with ammonium chloride hydrochloric acid solution is a typical
traditional
solid–liquid reaction. However, the curves for leaching rate vs. time for Ni, Co, and Fe did notthe
kinetic models, and so traditional kinetic models were not appropriate to describe fit
solid–liquid reaction. However, the curves for leaching rate vs. time for Ni, Co, and Fe did not fit
dynamics
traditionalof kinetic
the process in thisand
models, research. A new shrinking
so traditional core model
kinetic models werewas studied
not by Dickinson
appropriate et al. [26]
to describe the
traditional kinetic models, and so traditional kinetic models were not appropriate to describe the
and Dehghand
dynamics et process
of the al. [27], in
which
this was applied
research. to simulate
A new shrinkingandcore
calculate
modelthe
wasprocess as follows:
studied by Dickinson et
dynamics of the process in this research. A new shrinking core model was studied by Dickinson et
al. [26] and Dehghand et al. [27], which was applied to simulate and calculate the process as follows:
al. [26] and Dehghand et al. [27],1 which was applied to−1/3 simulate and calculate the process as follows:
ln(1 − w) + [(1 − w) − 1] = km t (12)
3 1
1 ln(1 − w) + [(1 − w)-1/3 − 1] = kmt
-1/3
(12)
3 ln(1 − fraction,
w) + [(1 −the − 1] = reaction
w)apparent kmt (12)
where w, km , and t represent the leaching 3 rate constant, and leaching
time,
where respectively.
w, km, and t represent the leaching fraction, the apparent reaction rate constant, and leaching
where w, km, and t represent the leaching fraction, the apparent reaction rate constant, and leaching
time, respectively.
time, respectively.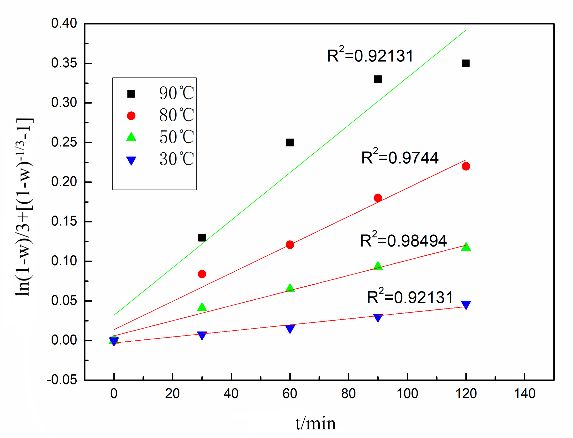
Minerals
across the2020, 10, x FOR
           product        PEER
                       layer.   REVIEW
                              The                                                                       6 of 11
                                  leaching rates of Ni, Co, and Fe vs. time were calculated using Equation
                                                                 1                           -1/3
(12), and   themodel
         This    relationship
                          showsbetween
                                  that the the valuesrate
                                            reaction   of can   be−affected
                                                             ln(1    w) + [(1 −byw)interfacial
                                                                                        − 1] and    leaching
                                                                                                 transfer andtime  for
                                                                                                               diffusion
   Minerals 2020, 10, x FOR  PEER  REVIEW                  3                                                        6 of 11
   across the product layer. The leaching rates of Ni, Co, and Fe vs. time were calculated using Equation
Ni, Co, and Fe at different temperatures are presented in Figures 5–7.
   Minerals 2020, 10, 754                                     1                                                    6 of 11
   (12), This
         and the    relationship
                model     shows thatbetween   the values
                                       the reaction  rateofcan be    − w) + [(1
                                                                ln(1affected        w) -1/3 − 1] transfer
                                                                               by−interfacial     and leaching  time for
                                                                                                           and diffusion
                                                              3
   across the product layer. The leaching rates of Ni, Co, and Fe vs. time were calculated using Equation
   Ni, Co,   and   Fe  at different temperatures   are presented
         This model shows that the reaction rate can be1affected    in Figures   5–7. transfer and diffusion across
                                                                         by interfacial
                                                                                       -1/3
   (12),product
   the   and thelayer.
                     relationship   between
                           The leaching       the
                                          rates ofvalues        ln(1  − w) + [(1
                                                   Ni, Co,ofand Fe vs. time were  − w)      − 1] and
                                                                                      calculated       leaching
                                                                                                    using       time(12),
                                                                                                          Equation     for
                                                                     3
  and the relationship between the values of 13 ln(1 − w) + [(1 − w)−1/3 − 1] and leaching time for Ni,
  Ni, Co, and Fe at different temperatures are presented in Figures 5–7.
  Co, and Fe at different temperatures are presented in Figures 5–7.

                                                     1
                               Figure 5. The           ln(1- w) +[(1- w)-1/3−1]    of nickel leaching.
                                                     3
                                                        1
                                  Figure 5. The           ln(1- w) +[(1- w)-1/3−1]    of nickel leaching.
                                                        3
                             Figure 5. The   1
                                                 ln(1−w) + [(1 −w)−1/3 − 1] of nickel leaching.
                                             3
                                                        1
                                   Figure 5. The          ln(1- w) +[(1- w)-1/3−1]    of nickel leaching.
                                                        3

                                                     1
                               Figure 6. The           ln(1- w) +[(1- w)-1/3−1]    of cobalt leaching.
                                                     3
                             Figure 6. The   1
                                                 ln(1−w) + [(1 −w)−1/3 − 1] of cobalt leaching.
                                             3
                                                        1
                                  Figure 6. The           ln(1- w) +[(1- w)-1/3−1]   of cobalt leaching.
                                                        3
                                                        1
                                   Figure 6. The          ln(1- w) +[(1- w)-1/3−1]    of cobalt leaching.
                                                        3

                              Figure 7. The      1
                                                     ln(1−w) + [(1 −w)−1/3 − 1] of iron leaching.
                                         1       3
                                           ln2(1- w) +[(1- w)-1/3−1] of iron leaching.
                                Figure 7. The
        High fitting degrees (the minimal3R of 0.92131) indicate that these values are linear and verify
  the suitability of this shrinking core model to the process.
                                              1                 -1/3
        Temperature can affectFigure
                                  the rate
                                       7. The   ln(1- w) +
                                            constant.     [(1- w)
                                                         The         −1] of iron
                                                               Arrhenius     equation   was used to express the
                                                                                 leaching.
                                              3
  relationship between the rate constant (k) and temperature (T):
                                                         1                  -1/3
                                    Figure 7. Thek =lnA - w) [+−E
                                                      (1exp           (RT−)]1] of iron leaching.
                                                               [(1a-/w)                                               (13)
                                                         3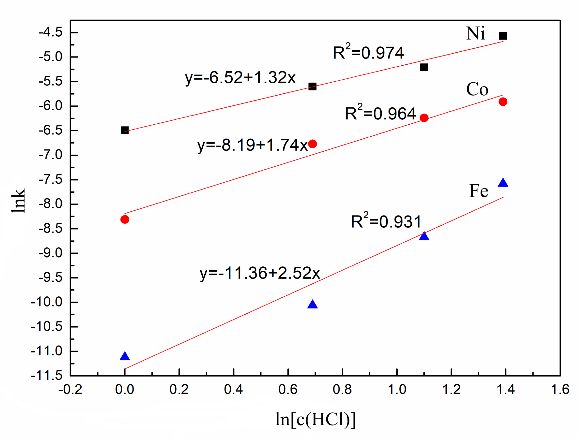
the suitability of this shrinking core model to the process.
     Temperature can affect the rate constant. The Arrhenius equation was used to express the
     Temperature can affect the rate constant. The Arrhenius equation was used to express the
relationship between the rate constant (k) and temperature (T):
relationship between the rate constant (k) and temperature (T):

                                               k = Aexp[- E / ( RT )]                                      (13)
Minerals 2020, 10, 754
                                               k = Aexp[- Eaa / ( RT )]                                    (13)
                                                                                                          7 of 11

    In Equation (13), A and Ea are the frequency factor and apparent activation energy, respectively.
    In Equation (13), A and Ea are the frequency factor and apparent activation energy, respectively.
Equation (13) can be expressed
    In Equation                 as the
                       A and Ea are     following:
Equation (13) can(13),
                  be expressed      thefollowing:
                                as the   frequency factor and apparent activation energy, respectively.
Equation (13) can be expressed as the following:
                                     ln k = ln A-E / (2.303RT )]                                 (14)
                                     ln k = ln A-Eaa / (2.303RT )]                               (14)
                                      ln k = ln A − Ea /(2.303RT )]                               (14)
     The Arrhenius plots are shown in Figures 8–10, which describe the relationship between the rate
     The Arrhenius
     The  Arrhenius plots
                      plots are
                             are shown
                                 shown inin Figures
                                            Figures 8–10,
                                                    8–10, which
                                                          which describe
                                                                describe the
                                                                         the relationship
                                                                             relationship between
                                                                                           between the rate
                                                                                                         rate
constant and temperature      and the data  presented in Figures 5–7. They show   that plots in thesethe
                                                                                                      figures
constant and
constant  and temperature and and the
                                   the data
                                       data presented in Figures 5–7. They show that plots in these figures
of lnk againsttemperature
               1/T give a straight   line. presented in Figures 5–7. They show that plots in these figures
of lnk
of lnk against
       against 1/T
               1/T give
                   give aa straight
                           straight line.
                                     line.

                                  Figure 8. Arrhenius plot for nickel leaching.
                                         8. Arrhenius plot for nickel leaching.
                                  Figure 8.

Minerals 2020, 10, x FOR PEER REVIEW                                                                       8 of 11
                                         9. Arrhenius plot for cobalt leaching.
                                  Figure 9.
                                  Figure 9. Arrhenius plot for cobalt leaching.

                                   Figure 10. Arrhenius plot for iron leaching.

     From   the slope
     From the    slope of
                       ofthese
                           theselines,
                                  lines,the
                                          theactivation
                                              activationenergy
                                                          energycan
                                                                  canbebe  calculated.
                                                                        calculated.  TheThe activation
                                                                                         activation     energies
                                                                                                     energies for
for
nickel, cobalt, and iron are 4.01 kJ/mol, 3.43 kJ/mol, and 1.87 kJ/mol, respectively. This shows thatthat
    nickel, cobalt, and  iron are   4.01 kJ/mol,  3.43 kJ/mol, and  1.87 kJ/mol,  respectively. This  shows   the
the leaching
leaching       of Ni,
          of Ni,  Co, Co,
                      andand    Fe are
                            Fe are       all controlled
                                    all controlled      by solid
                                                    by solid      diffusion
                                                             diffusion       as the
                                                                         as the     Ea rates
                                                                                Ea rates     arethe
                                                                                         are in  in range
                                                                                                    the range  of
                                                                                                          of 1–5
1–5 kJ/mol,  further  verifying  the  suitability of this kinetic model
kJ/mol, further verifying the suitability of this kinetic model [28].     [28].
     Equation (15) can be used to express the reaction rate constants. The major factors, including
leaching time, liquid–solid ratio, leaching temperature, and the concentration of leaching regent (i.e.,
ammonium chloride and hydrochloric acid) in the leaching process can all be expressed:
                                k m = k 0 [ HCl ]a [ NH 4Cl ]b ( c L / S ) c exp[ − E a / ( RT )]          (15)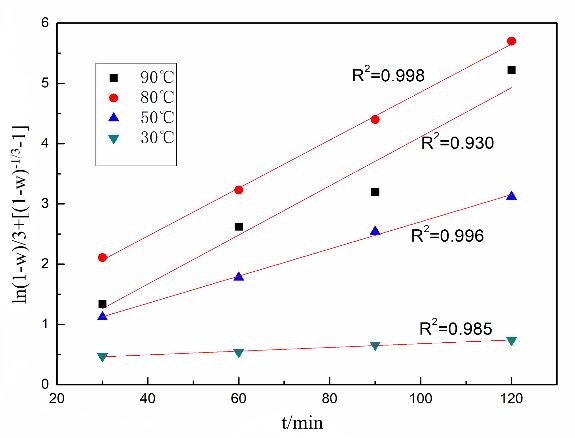
Figure 10. Arrhenius plot for iron leaching.
From the slope of these lines, the activation energy can be calculated. The activation energies for
nickel,
Minerals cobalt,
2020, 10, and
754 iron are 4.01 kJ/mol, 3.43 kJ/mol, and 1.87 kJ/mol, respectively. This shows that the
8 of 11
leaching of Ni, Co, and Fe are all controlled by solid diffusion as the Ea rates are in the range of 1–5
kJ/mol, further verifying the suitability of this kinetic model [28].
Equation (15)
Equation (15) can
can be
be used
used to
to express
express the
the reaction
reaction rate
rate constants. The major
constants. The major factors, including
factors, including
leaching time, liquid–solid ratio, leaching temperature, and the concentration of
leaching time, liquid–solid ratio, leaching temperature, and the concentration of leaching regentleaching regent
(i.e.,
(i.e., ammonium
ammonium chloride
chloride and hydrochloric
and hydrochloric acid)acid)
in theinleaching
the leaching process
process canbeallexpressed:
can all be expressed:
a b cc
= kk00[[HCl
kkmm = HCl]]a [[NH
NH44Cl
Cl]]b ((ccL/S exp[−−E
L / S )) exp[ E aa//((RT
RT)]
)] (15)
(15)
In Equation (15), k0 is the Arrhenius constant; a, b, and c represent the reaction order with respect
In Equation (15), k0 is the Arrhenius constant; a, b, and c represent the reaction order with
to hydrochloric acid concentration, ammonium chloride concentration, and cL/S; and cL/S is the liquid–
respect to hydrochloric acid concentration, ammonium chloride concentration, and cL/S ; and cL/S is the
solid ratio.
liquid–solid ratio.
Substituting km from Equation (15) into Equation (12) gives the following:
Substituting km from Equation (15) into Equation (12) gives the following:
1
1 ln(1-w ) + [(1-w) -1/3−1/3
− 1] = k 0 [ HCl ]a [ NH ]b ( bc L / S ) c exp[
4 Cl Cl − E a / ( RT )]t . (16)
3 ln(1−w) + [(1 −w) − 1] = k0 [HCl]a [NH c
4 ] (cL/S ) exp[−Ea / (RT )]t. (16)
3
The
The apparent
apparent reaction
reaction rate
rate constants
constants for for Ni,
Ni, Co,
Co, and
and Fe
Fe in
in the
the shrinking
shrinking core
core model
model can
can bebe
determined
determined by by different
different factors
factors affecting
affecting thethe dissolution
dissolution of
of Ni,
Ni, Co,
Co, and
and Fe;
Fe; aa kinetic
kinetic equation
equation with
with
regards
regards toto the
the leaching
leaching of
of each
each metal
metal can
can be be established.
established. This
This will
will significantly
significantly benefit
benefit improvements
improvements
in
in laterite
laterite leaching
leaching processes.
processes.
The
The reaction
reaction order
order of
of each
each metal
metal (a,
(a, b,b, and
and c)
c) can
can also be calculated
also be calculated through
through thethe relationship
relationship
between k and c(HCl), c(NH Cl), and c (the slope of lnk − lnc(HCl), lnk − lnc(NH
between k and c(HCl), c(NH4 Cl), and cL/S (the slope of lnk − lnc(HCl), lnk − lnc(NH4 Cl), lnk
4 L/S 4 Cl), lnk −
− lnc
lncL/S
L/S),
),
shown
shown inin Figures
Figures 11–13.
11–13.
Minerals 2020, 10, x FOR PEER REVIEW 9 of 11
Figure
Figure 11.
11. The lnk −− lnc(HCl)
The lnk lnc(HCl) of
of Ni,
Ni, Co,
Co, and
and Fe.
Fe.
Figure 12. The lnk −
Figure 12. Cl) of
− lnc(NH44Cl) of Ni,
Ni, Co,
Co, and
and Fe.
Fe.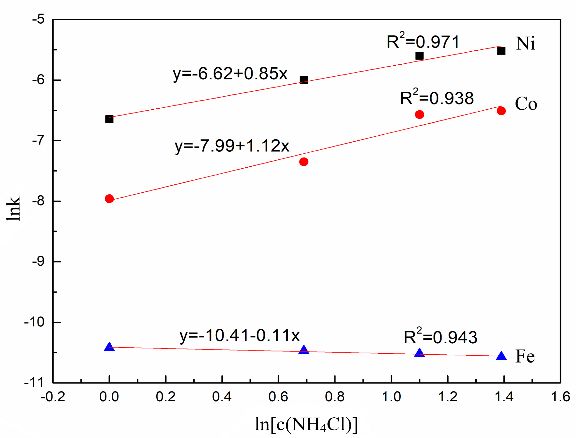
Minerals 2020, 10, 754                                                                                                               9 of 11
                                       Figure 12. The lnk − lnc(NH4Cl) of Ni, Co, and Fe.

                                          Figure 13. The
                                          Figure 13.     lnk −
                                                     The lnk   lncL/S
                                                             − lnc     ofNi,
                                                                   L/Sof Ni,Co,
                                                                             Co,and
                                                                                 andFe.
                                                                                    Fe.

     The Arrhenius
     The   Arrhenius constants
                         constants (k(k00)) for
                                            for nickel,
                                                 nickel, cobalt,
                                                          cobalt, and
                                                                    and iron,
                                                                         iron, calculated
                                                                                calculated through
                                                                                             through the
                                                                                                      the intercept
                                                                                                            intercept in
                                                                                                                       in
Figures  11–13  are  204.38,  16.65, and     7.12  × 10 −3 , respectively.
Figures 11, 12, and 13 are 204.38, 16.65, and 7.12 × 10⁻³, respectively.
     The plots
     The   plots in
                 in Figures
                      Figures 11–13
                               11–13 can
                                       can be be used
                                                  used toto calculate   mean rate
                                                              calculate mean    rate constants,   which represent
                                                                                      constants, which    represent the
                                                                                                                      the
reaction  orders  (a, b, and c). The   mean      values  of  these constants   (a, b, and c) are nickel (1.32,
reaction orders (a, b, and c). The mean values of these constants (a, b, and c) are nickel (1.32, 0.85, and    0.85, and
1.53), cobalt
1.53), cobalt (1.74,
              (1.74, 1.12,
                      1.12, and
                            and 1.22),
                                 1.22), and
                                         and iron    (2.52, −0.11,
                                                iron (2.52,          and 0.94).
                                                              −0.11, and  0.94).
     All data
     All data are
               are applied
                    applied toto Equation
                                  Equation (16) (16) and
                                                     and so so the
                                                               the final
                                                                   final kinetic   equations can
                                                                         kinetic equations    can be
                                                                                                   be described
                                                                                                      described asas the
                                                                                                                      the
following:
following:
          1

      1                                    − 31
    Ni :    ln ( 1 − w  ) +    ( 1  −
                                 -1/3 w )
 Ni: ln3(1 - w ) + [(1 - w) − 1] = 204 .38        − 1    HCl ]1.[32HCl
                                                       =[204.38        ]1.32Cl
                                                                    [ NH     [NH
                                                                               ]0.854(Cl
                                                                                           0.85
                                                                                       c L] / S )1(.53cL/S )1.53
                                                                                                        exp[     exp[−4010/
                                                                                                              − 4010  /( RT )](t RT )]t (17)
                                                                                                                                         (17)
                                                                          4
      3
           1
                                               1

    Co1: ln(1 − w) + (1-1/3− w)− 3 − 1 = 16.651.[74HCl]1.74 [NH                1.124
                                                                                     Cl]1.121(.22   cL/S )1.22 exp[−3430/(RT )]t         (18)
 Co: ln (1 - w ) + [(1 - w) − 1] = 16 .65[ HCl ] [ NH 4 Cl ] (c L / S ) exp[ −3430 /( RT )]t
           3                                                                                                                            (18)
       3                                1

   Fe : 13 ln(1 − w) + (1 − w)− 3 − 1 = 7.12 × 10⁻³ [HCl]2.52 [NH4 Cl]−0.11 (cL/S )0.94 exp[−1870/(RT )]t (19)
 Fe: 1 ln (1 - w ) + [(1 - w) -1/3 − 1] = 7.12 × 10 -3 [ HCl ]2.52 [ NH 4 Cl ]-0.11 (c L / S ) 0.94 exp[ −1870 /( RT )]t                (19)
     3
4. Conclusions
      In summary, the leaching mechanism study showed that all the major leaching conditions can
affect
4.     the dissolution of these minerals. The dissolution order is: Goethite > serpentine > hematite and
   Conclusions
magnetite, which is consistent with the results observed for the extraction of metals.
      In summary, the leaching mechanism study showed that all the major leaching conditions can
      The activation energies of 4.01 kJ/mol for nickel, 3.43 kJ/mol for cobalt, and 1.87 kJ/mol for iron,
affect the dissolution of these minerals. The dissolution order is: Goethite > serpentine > hematite and
which proved a solid diffusion-controlled extraction of Ni, Co, and Fe. Reaction orders (a, b, and c) for
magnetite, which is consistent with the results observed for the extraction of metals.
the metals were determined to be: Nickel (1.32, 0.85, and 1.53), cobalt (1.74, 1.12, and 1.22), and iron
      The activation energies of 4.01 kJ/mol for nickel, 3.43 kJ/mol for cobalt, and 1.87 kJ/mol for iron,
(2.52, −0.11, and 0.94). Kinetic equations demonstrated that the leaching of Ni, Co, and Fe during the
which proved a solid diffusion-controlled extraction of Ni, Co, and Fe. Reaction orders (a, b, and c)
leaching of laterite using a hydrochloric acid-ammonium chloride system can be separated into two
for the metals were determined to be: Nickel (1.32, 0.85, and 1.53), cobalt (1.74, 1.12, and 1.22), and
stages. The first stage involves interface exchange on the surface of the solid particle and the second
iron (2.52, −0.11, and 0.94). Kinetic equations demonstrated that the leaching of Ni, Co, and Fe during
stage concerns diffusion over the solid-doped membrane. In addition, it can be concluded that nickel,
the leaching of laterite using a hydrochloric acid-ammonium chloride system can be separated into
cobalt, and iron, which are present in laterite, undergo two types of reactions: Surface adsorption and
lattice replacement.

Author Contributions: Preliminary idea, technical guidance, and writing guidance, J.L.; data collection, data
analysis, and paper writing, Y.Y.; discussion and proofreading, Y.W. and W.L.; data provided, Y.C.; project
supervision, R.W.; Experimental guidance, Z.X. All authors have read and agreed to the published version of
the manuscript.
Funding: The project was sponsored by National Natural Science Foundation (51974140), (51564021),
and (5176040277), Department of Education of Jiangxi Province (GJJ160593), and Jiangxi Province Postdoctoral
Science Fund (2017KY17).
Conflicts of Interest: The authors declare no conflict of Interest.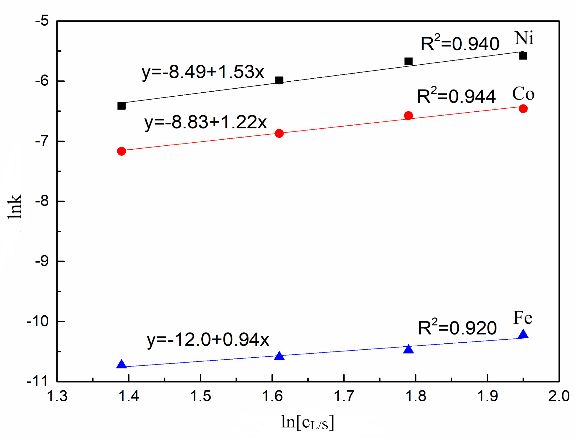
Minerals 2020, 10, 754                                                                                              10 of 11

References
1.    Moskalyk, R.; Alfantazi, A. Nickel laterite processing and electrowinning practice. Miner. Eng. 2002, 15,
      593–605. [CrossRef]
2.    McDonald, R.G.; Whittington, B. Atmospheric acid leaching of nickel laterites review: Part I. Sulphuric acid
      technologies. Hydrometallurgy 2008, 91, 35–55. [CrossRef]
3.    Zhao, Y.; Gao, J.-M.; Yue, Y.; Peng, B.; Que, Z.-Q.; Guo, M.; Zhang, M. Extraction and separation of nickel and
      cobalt from saprolite laterite ore by microwave-assisted hydrothermal leaching and chemical deposition.
      Int. J. Miner. Met. Mater. 2013, 20, 612–619. [CrossRef]
4.    MacCarthy, J.; Nosrati, A.; Skinner, W.; Addai-Mensah, J. Atmospheric acid leaching mechanisms and
      kinetics and rheological studies of a low grade saprolitic nickel laterite ore. Hydrometallurgy 2016, 160, 26–37.
      [CrossRef]
5.    Liu, Y.; Lee, M.-S. Separation of Co and Ni from a chloride leach solutions of laterite ore by solvent extraction
      with extractant mixtures. J. Ind. Eng. Chem. 2015, 28, 322–327. [CrossRef]
6.    Liu, K.; Chen, Q.; Hu, H. Comparative leaching of minerals by sulphuric acid in a Chinese ferruginous nickel
      laterite ore. Hydrometallurgy 2009, 98, 281–286. [CrossRef]
7.    Marrero, J.; Coto, O.; Goldmann, S.; Graupner, T.; Schippers, A. Recovery of nickel and cobalt from laterite
      tailings by reductive dissolution under aerobic conditions using Acidithiobacillus species. Environ. Sci.
      Technol. 2015, 49, 6674–6682. [CrossRef]
8.    Ma, B.; Yang, W.; Yang, B.; Wang, C.; Chen, Y.; Zhang, Y. Pilot-scale plant study on the innovative nitric acid
      pressure leaching technology for laterite ores. Hydrometallurgy 2015, 155, 88–94. [CrossRef]
9.    Xu, D.; Liu, L.; Quast, K.; Addai-Mensah, J.; Robinson, D.J. Effect of nickel laterite agglomerate properties on
      their leaching performance. Adv. Powder Technol. 2013, 24, 750–756. [CrossRef]
10.   Tang, X.-H.; Liu, R.-Z.; Yao, L.; Ji, Z.-J.; Zhang, Y.-T.; Li, S.-Q. Ferronickel enrichment by fine particle reduction
      and magnetic separation from nickel laterite ore. Int. J. Miner. Met. Mater. 2014, 21, 955–961. [CrossRef]
11.   Chen, Y.-Q.; Zhao, H.-L.; Wang, C. Two-stage reduction for the preparation of ferronickel alloy from nickel
      laterite ore with low Co and high MgO contents. Int. J. Miner. Met. Mater. 2017, 24, 512–522. [CrossRef]
12.   McDonald, R.G.; Whittington, B. Atmospheric acid leaching of nickel laterites review. Part II. Chloride and
      bio-technologies. Hydrometallurgy 2008, 91, 35–55. [CrossRef]
13.   Whittington, B.I.; Muir, D. Pressure acid leaching of nickel laterites: A review. Miner. Process. Extr. Met. Rev.
      2000, 21, 527–599. [CrossRef]
14.   Guo, X.; Shi, W.-T.; Li, N.; Tian, Q. Leaching behavior of metals from limonitic laterite ore by high pressure
      acid leaching. Trans. Nonferrous Met. Soc. China 2011, 21, 191–195. [CrossRef]
15.   Büyükakinci, E.; Topkaya, Y. Extraction of nickel from lateritic ores at atmospheric pressure with agitation
      leaching. Hydrometallurgy 2009, 97, 33–38. [CrossRef]
16.   Rice, N.M. A hydrochloric acid process for nickeliferous laterites. Miner. Eng. 2016, 88, 28–52. [CrossRef]
17.   Luo, J.; Li, G.; Rao, M.; Peng, Z.; Zhang, Y.; Jiang, T. Atmospheric leaching characteristics of nickel and iron in
      limonitic laterite with sulfuric acid in the presence of sodium sulfite. Miner. Eng. 2015, 78, 38–44. [CrossRef]
18.   Wang, B.; Guo, Q.; Wei, G.; Zhang, P.; Qu, J.; Qi, T. Characterization and atmospheric hydrochloric acid
      leaching of a limonitic laterite from Indonesia. Hydrometallurgy 2012, 129, 7–13. [CrossRef]
19.   Da Costa, G.M.; Couto, D.J.F.; De Castro, F.P.M. Existence of maghemite and trevorite in nickel laterites.
      Miner. Process. Extr. Met. Rev. 2013, 34, 304–319. [CrossRef]
20.   Lakshmanan, V.I.; Sridhar, R.; Chen, J.; Halim, M.A. Development of mixed-chloride hydrometallurgical
      processes for the recovery of value metals from various resources. Trans. Indian Inst. Met. 2016, 69, 39–50.
      [CrossRef]
21.   Zhang, P.; Guo, Q.; Wei, G.; Meng, L.; Han, L.; Qu, J.; Qi, T. Leaching metals from saprolitic laterite ore using
      a ferric chloride solution. J. Clean. Prod. 2016, 112, 3531–3539. [CrossRef]
22.   Li, J.; Li, D.; Xu, Z.; Liao, C.; Liu, Y.; Zhong, B. Selective leaching of valuable metals from laterite nickel ore
      with ammonium chloride-hydrochloric acid solution. J. Clean. Prod. 2018, 179, 24–30. [CrossRef]
23.   Li, J.; Xiong, D.; Chen, H.; Wang, R.; Liang, Y. Physicochemical factors affecting leaching of laterite ore in
      hydrochloric acid. Hydrometallurgy 2012, 129, 14–18. [CrossRef]
Minerals 2020, 10, 754 11 of 11
24. Ma, B.; Yang, W.; Xing, P.; Wang, C.; Chen, Y.; Lv, D. Pilot-scale plant study on solid-state metalized
reduction–magnetic separation for magnesium-rich nickel oxide ores. Int. J. Miner. Process. 2017, 169, 99–105.
[CrossRef]
25. Thubakgale, C.; Mbaya, R.; Kabongo, K. A study of atmospheric acid leaching of a South African nickel
laterite. Miner. Eng. 2013, 54, 79–81. [CrossRef]
26. Dickinson, C.; Heal, G. Solid–liquid diffusion controlled rate equations. Thermochim. Acta 1999, 340, 89–103.
[CrossRef]
27. Dehghan, R.; Noaparast, M.; Kolahdoozan, M. Leaching and kinetic modelling of low-grade calcareous
sphalerite in acidic ferric chloride solution. Hydrometallurgy 2009, 96, 275–282. [CrossRef]
28. Li, J.; Li, Y.; Zheng, S.; Xiong, D.; Chen, H.; Zhang, Y. Research review of laterite nickel ore metallurgy.
Nonferrous Met. Sci. Eng. 2015, 6, 35–40.
© 2020 by the authors. Licensee MDPI, Basel, Switzerland. This article is an open access
article distributed under the terms and conditions of the Creative Commons Attribution
(CC BY) license (http://creativecommons.org/licenses/by/4.0/).You can also read