4.1 LATEST DEVELOPMENTS IN THE NWS' SEA LAKE AND OVERLAND SURGES FROM HURRICANES MODEL
←
→
Page content transcription
If your browser does not render page correctly, please read the page content below
4.1     LATEST DEVELOPMENTS IN THE NWS’ SEA LAKE AND OVERLAND SURGES FROM
                               HURRICANES MODEL

                                     Arthur Taylor1* and Huiqing Liu2#
             1. NOAA / NWS / STI / Meteorological Development Laboratory, Silver Spring, MD
                                    2. Ace Info Solutions, Inc. Reston, VA
        (#) Presented at the 100th AMS Annual Meeting, Boston MA, January 14, 2020

1. INTRODUCTION
                                                          This paper will discuss the design changes
    The Sea, Lake, and Overland Surges from           that the Meteorological Development Laboratory
Hurricanes (SLOSH) model is used by the               has made to transition SLOSH into a multi-
National Weather Service (NWS) to produce             processor program and will demonstrate the
storm surge guidance in several ways. SLOSH-          impact via simulations of Hurricanes Katrina in
based simulation studies form the basis of the        2005 and Irene in 2011. Section 2 expands upon
“hazards analysis” portion of hurricane               why real-time ensemble modeling is important
evacuation planning. The Probabilistic tropical       and why SLOSH is used. Section 3 describes
cyclone storm Surge (P-Surge) model runs              the current run-time challenge, while section 4
SLOSH to analyze the storm surge inundation           describes the solution. Section 5 provides run-
from each of its approximately 630 ensemble           time results for the two cases. The paper
wind inputs. Similarly, the Probabilistic Extra       concludes in section 6 with a summary.
Tropical Storm Surge (P-ETSS) model runs
SLOSH to analyze the storm surge inundation           2. MOTIVATION
from the North American Ensemble Forecast
System’s 42 ensemble members.                         2.1. Large Wind Uncertainty

     One key aspect of SLOSH, for this ensemble           The accuracy of the National Hurricane
modeling, has been its fast-computational             Center’s storm surge forecasts is directly related
speed.      This was due to design choices            to both the accuracy of the storm surge model
necessitated by the technology available when it      (SLOSH) used and the accuracy of the input
was developed in the 1980’s. However, SLOSH           parameters provided to it. Jelesnianski et al.
computational domains have recently become            (1992) found that when the hurricane’s track,
significantly broader and finer. While the results    intensity, and size are estimated as well as
are more accurate, they take longer to run on a       possible after the event, SLOSH was correct to
single processor. Additionally, NWS is working        within approximately 20% of high-water marks.
to couple a wave model to SLOSH, which will           This is particularly good, considering high water
slow down the computation by at least a factor of     marks often vary by 20% for locations that are
two. To allow real-time ensemble storm surge          less than a mile apart (Jelesnianski et al. 1984).
modeling (e.g., P-Surge and P-ETSS) to
continue to produce results within one hour,              Unfortunately, as seen in Taylor and Glahn
SLOSH needs to move from a single processor           (2008), the errors in the wind input provided to
to a multi-processor program, enabling it to scale    SLOSH cause storm surge errors which are
based on the number of available processors.          much larger than 20%. For example, as shown
                                                      in Figs. 1 and 2, the storm surge forecast for
                                                      Advisory 54 of Hurricane Ivan in 2004, made 12
                                                      hours before landfall, predicted a surge of 10 to
* Corresponding author address: Arthur Taylor,
                                                      12 feet for Mobile, Alabama. Due to errors in the
MDL, Silver Spring, MD 20910-3280; e-mail:
arthur.taylor@noaa.gov
                                                      predicted position and size of the hurricane, only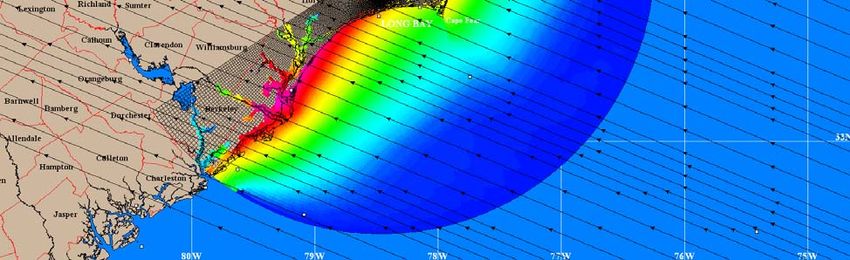
Figure 1. SLOSH storm surge forecast for Figure 2. SLOSH storm surge hindcast
Advisory 54 of Hurricane Ivan in 2004, made created with the best available information for
12-hr before landfall. Hurricane Ivan in 2004.
3 to 5 feet actually occurred. Similarly, develop evacuation plans which are provided to
Pensacola Bay, Florida was forecast to have only the Federal Emergency Management Agency.
2 to 5 feet, but actually experienced 7 to 11 feet.
Note, this is not a one-time phenomenon, as A conceptually similar method of utilizing
similar results can be seen for Hurricane Joaquin pre-made results was done by Smith et al.
in 2015 in Liu and Taylor (2018). Thus, the storm (2012). Their idea was to determine which of a
surge information in the advisory needs to rely on set of pre-run hypothetical storms best fit the
an ensemble of perturbations of the wind inputs current forecast storm. Given a sub-set of likely
to account for the wind uncertainty. storms, they could look up the results and
statistically combine them together. The
2.2. Ahead of Time Ensembles hypothetical storms could model both surge and
waves.
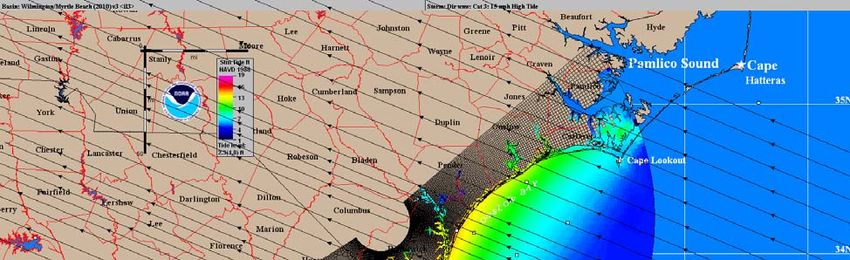
SLOSH is currently used in ahead-of-time
ensembles in the form of Maximum Envelope of The advantage of both the MEOW and
Water (MEOWs) (Shaffer 1989). The idea is to Smith’s data-mining concepts is that they require
calculate the potential storm surge for an area. minimal computation during the storm as they
To do so, a set of hypothetical storms are are made ahead-of-time. The challenge is they
provided as input to SLOSH. The storms all have don’t handle time very well, because the
the same forward speed, forward direction, size, hypothetical storms are run before the timing of
and Saffir-Simpson category. The difference the actual storm is known. The lack of timing
between them is where the storm track crosses information makes it challenging to model tidal
land (i.e., landfall location). The storms in a water levels (highly dependent on time),
MEOW each make landfall within at most a few abnormal water levels (e.g., sea level rise,
miles of the other storms (see Fig. 3). The results disruptions of currents, etc.), and external wind-
of each ensemble are combined together by fields.
taking the maximum value in each grid cell at any
time from any of the hypothetical storms. The The MEOW’s handle tidal and abnormal
MEOWs are made well before the storm exists water levels by initializing the water to high-tide.
and are provided to the US Army Corps of This results in a conservative over-estimate,
Engineers. They in turn combine the MEOWs which is sufficient given the planning purpose of
with population and transportation studies to the MEOWs. Smith’s data-mining effort could
linearly superimpose the tidal and abnormal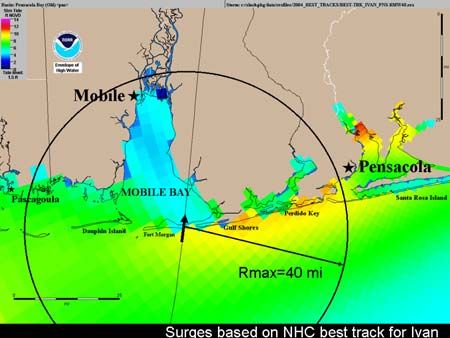
Figure 3. A sample Maximum Envelope of Water (MEOW) for a Category 3 hurricane in the Wilmington
basin at high tide moving west-north-west at 15 miles per hour.

water levels, but that wouldn’t model non-linear         In terms of modeling, the storm surge
tide surge interactions, nor calculate the correct   ensemble system should have a reasonable
inundation. Thus, both examples of ahead-of-         selection of wind cases, preferably based on
time ensembles can account for tidal and             error statistics. If a parametric wind model is
abnormal water levels; however, they can’t do so     used, it should be integrated within an external
as well as a real-time ensemble. Additionally,       wind field. Ideally the surge-model component
neither method can handle external wind fields.      would explicitly model surge, tide, waves, and
                                                     rainfall/river flooding. Additionally, the ensemble
2.3. Real-Time Ensembles                             system should have some form of observational
                                                     analysis for initial water levels. Finally, there
    In order to do a real-time storm surge           would be a readily available process of
ensemble for forecasting purposes, the results       maintaining the computational domains.
need to be available within an hour. Delays
beyond an hour would result in the data being             This is a tall order. To date, the best solution
overcome by the next forecast cycle.                 for this are SLOSH-based ensemble systems, as
Additionally, the forecast needs to contain at       design choices for SLOSH, necessitated by the
least 4 days of information as evacuation            technology available when it was developed in
decisions are made 3 to 5 days before landfall.      the 1980’s, make it very fast with a small
Furthermore, it needs to provide coverage for all    computational footprint.         That allows the
US storm surge vulnerable areas and run on the       ensemble system to diagnose numerous wind
National Centers for Environmental Prediction’s      permutations with the requisite 4-day forecasts
(NCEP) operational super-computer.                   while running on NCEP’s machines. SLOSH has
                                                     coverage for most of the US, only lacking
                                                     coverage for some US islands in the Pacific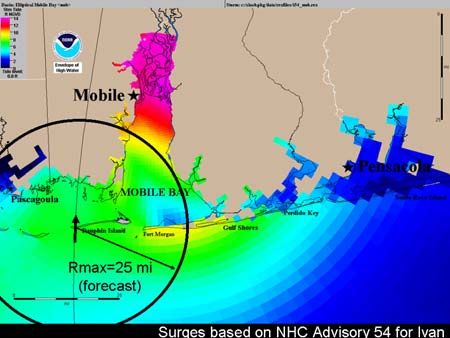
Ocean, and that coverage is maintained via the       P-Surge of 2006. Unfortunately, it is likely to be
National Hurricane Program.                          even more computationally expensive than that,
                                                     as NWS is planning to add more physics (such
     That said, real-time ensembles based on         as waves) and more domains (such as Puerto
SLOSH don’t meet all the requirements. For           Rico and Hawaii).
instance, NWS is currently working to enable
SLOSH to explicitly model waves caused by                 MDL has already hit the run-time limits in
each ensemble member (Yang 2020).                    P-Surge since a single track in the latest South
Additionally, NWS is working on adding an initial    Florida basin can take more than 1 hour to run
water condition based on observations to the         for a single processor. To make it work, MDL had
extra-tropical storm surge ensemble (Liu 2020)       to split the basin into thirds. Unfortunately, that
which eventually will be added to the tropical       is a sub-optimal solution as computations on one
storm surge ensemble. Finally, long term plans       sub-basin are unable to influence computations
include enabling the SLOSH-based ensemble            on the other sub-basins.
systems to handle the rainfall/river flooding
requirement as well as nesting the parametric        4. SOLUTION
wind field within an external wind grid. Still,
despite its flaws, no other storm surge model can        A better solution is to enable multiple
meet as many of the run-time and ensemble            processors to work as a team to solve a single
modeling requirements as SLOSH can.                  storm and basin problem. This is done via the
                                                     Message Passing Interface (MPI) library and
3. PROBLEM                                           domain decomposition as seen in Fig 4.

     One recent trend with SLOSH is to create             To use MPI, we need to determine what
broader basins with a fine grid resolution. The      information to pass between the processors and
logic for this stems from Hurricane Ike which        how often. With the parallelization of SLOSH via
made landfall in Galveston Texas in 2008. The        MPI (SLOSH-MPI), we chose to: (a) pass a halo
high-resolution basin available at the time was      or set of “shadow cells” along the boundary of
too narrow to capture Hurricane Ike, so it           each subdomain each time-step, and (b) pass
significantly under-forecasted the event. The        the whole subdomain when it is time for the grid
alternative was to use the broader Gulf of Mexico    to be written to disk. Each time-step, neighboring
basin, which captured Hurricane Ike, but was too     subdomains calculate results for their
coarse to resolve the details of the flooding. The   neighboring halo cells, but the results are treated
desire to add waves has accelerated the trend.       as “scratch space” and replaced by results from
                                                     the neighbor’s actual grid cells that overlap the
    This trend is exemplified by the fact that in    halo ones.        This works as long as the
2006, P-Surge used 35 basins which, if they          computation per communication time-step stays
were all run, required 2,369,815 cell Calculations   within the subdomain plus the surrounding halo.
per model Minute (C/M). In 2020, P-Surge
requires 28 basins which, if they are all run,           SLOSH goes through three stages each
require 14,862,102 C/M, or 6 times more              time-step:    Continuity,     Momentum,        and
calculations. So, the trend is for fewer, but        Smoothing. We choose to communicate the halo
broader and finer, grids. This will continue as we   boundary at the end of all three stages rather
implement the next generation of grids with          than between some combinations of the various
basins like: Super Texas (1,920,000 C/M), New        stages. The intent is to reduce the amount of
Orleans (99,225 -> 2,232,240 C/M), and New           communication thereby increasing efficiency. As
York (233,887 -> 4,760,550 C/M). Thus in 2022,       the equations for Continuity and Momentum both
P-Surge may require 23,441,780 C/M, or be 10         require one extra grid cell (i.e. halo cell) on the
times more computationally expensive than the        boundary, the surrounding number of halo cells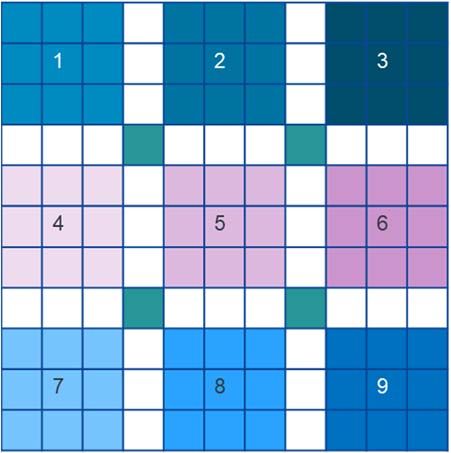
Figure 4. A sample domain decomposition for an 11x11 grid into 9 4x4 grids with 1 grid cell overlap.

(i.e. halo-width), needs to be at least 2 grid cells.   groups (4x1), splitting the columns into 4 groups
The challenge is the Smoothing stage.                   (1x4), or splitting the rows and columns into 2
Originally, we thought the Smoothing stage              groups each (2x2). The SLOSH-MPI algorithm
would require increasing the halo-width by a            breaks up the domains based on a call to
single grid cell. Unfortunately, we couldn’t get        MPI_Dims_create(), which automatically creates
identical results for Hurricane Katrina in the New      a balanced distribution of processes. So, in the
Orleans basin (HMS8) without using a total              case of 4 processes it would split the rows and
halo-width of 7.        Our hypotheses is that          columns into 2 groups each (2x2).
Smoothing calculations are harder for some
basins, particularly when dealing with large            5. RESULTS
amounts of inundation.
                                                             The results for Hurricane Katrina in 2005 in
    Once we’d chosen the halo-width and were            the New Orleans basin (HMS8) show a reduction
ready to modify the code, we had to choose how          of run-time as the number of processors
to update the indexes for all the loops. One            increases (Fig 5). As seen in Table 1, the
option was to change the start of each loop from        percent improvement of adding a single
1 to a variable based on the subdomain. This            processor varies from 4% to 29%. Additionally,
appeared dangerous as there was a lot of code           the influence of the subdomain topology can be
to modify, and any index mistake would be               seen in the sudden reduction in improvement
subtle.    Instead we chose to have each                when adding a 7th processor. While adding an
processor read in the entire basin and then shift       8th processor produced diminished returns, it is
the area of its focus to start at 1,1. This reduced     worth trying to add more for this basin and storm.
the changes to the loops, but we had to be
careful while updating the indexes of the vector            The results for Hurricane Irene in 2011 in the
data (e.g. barriers, cuts, flows, etc).                 Chesapeake Bay basin (CP5) as seen in Table 2
                                                        also show a reduction of run-time as number of
    Another aspect to consider when dealing             processors increases.       Here, the percent
with domain decomposition is the topology. For          improvement per additional processor ranges
instance, you can break up a rectangular domain         from -3% to 25%. The influence of the topology
amongst 4 processors by splitting the rows into 4       can be seen again when the 6th processor is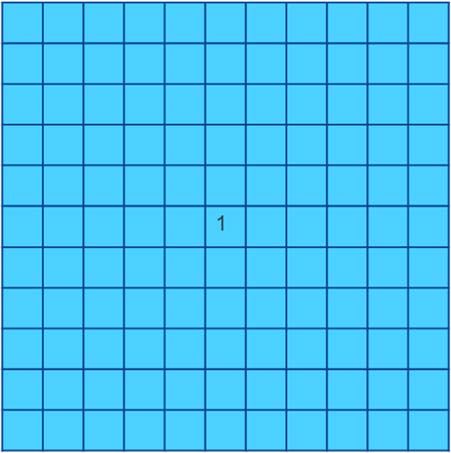
added. In this case we likely don’t want to            halo-width results in a roughly linear increase in
increase the number of processors any further          the run-time.
than 8. Both tables also show that increasing the

 Figure. 5. Run time for Hurricane Katrina in the New Orleans basin (HMS8) vs number of processors
 for halo-widths of 4, 6, 8, and 10 cells.

Table 1. Run time (minutes) and percent improvement (from 1 fewer processor) for Hurricane Katrina in
the New Orleans basin (HMS8). Columns are the number of processors.
                   1         2         3        4          5          6          7         8

 Halo-width = 4     58.8       42.1       29.7      23.6     20.0       16.5       15.0        12.8
                               28%        29%       21%      15%        18%        9%          15%
 Halo-width = 6     58.8       42.3       30.1      23.9     20.5       16.7       15.6        13.1
                               28%        29%       21%      14%        19%        7%          16%
 Halo-width = 8     58.8       42.6       30.3      24.3     21.1       17.0       16.2        13.4
                               28%        29%       20%      13%        19%        5%          17%
 Halo-width = 10    58.8       42.9       30.5      24.6     21.7       17.4       16.7        13.7
                               27%        29%       19%      12%        20%        4%          18%

Table 2. Same as in Table 1, but for Hurricane Irene in the Chesapeake Bay basin (CP5).
                   1          2          3          4         5         6         7            8

 Halo-width = 4     20.4       16.4       13.1      11.4      8.9        8.9        6.7        6.9
                               20%        20%       13%       22%        0%         25%        -3%
 Halo-width = 6     20.4       16.5       13.2      11.5      9.0        9.0        7.0        7.1
                               19%        20%       13%       22%        0%         22%        -1%
 Halo-width = 8     20.4       16.7       13.3      11.7      9.2        9.2        7.4        7.2
                               18%        20%       12%       21%        0%         20%        3%
 Halo-width = 10    20.4       16.8       13.4      11.8      9.4        9.4        7.7        7.4
                               18%        20%       12%       20%        0%         18%        4%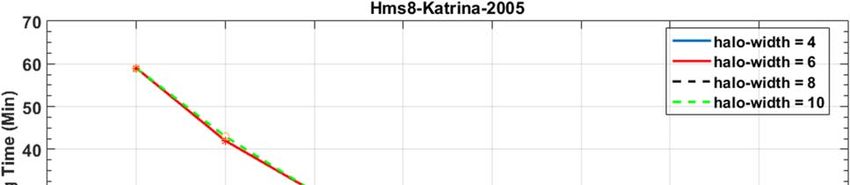
6. SUMMARY                                                 84, Washington, D.C., Marine Technology
                                                           Society and IEEE/Oceanic Engineering
    The parallelization of SLOSH via MPI was               Society,                           314-317,
successful and will enable a number of                     https://slosh.nws.noaa.gov/docs/Jelenianski
enhancements to the real-time SLOSH based                  _1984_SLOSH_HurcnFcstModel.pdf.
ensemble storm surge systems one of which is
the use of larger, finer resolution basins. Another    Jelesnianski, C. P., J. Chen, and W. A. Shaffer,
enhancement is enabling the ability to scale past          1992: SLOSH: Sea, Lake and Overland
the time it takes a single processor to handle a           Surges from Hurricanes. NOAA Technical
storm in a single basin.               Finally, this       Report, NWS 48, National Oceanic and
parallelization will give the flexibility needed to        Atmospheric      Administration,   U.    S.
explicitly calculate waves within the ensemble             Department of Commerce, 71 pp.,
members.                                                   https://slosh.nws.noaa.gov/docs/SLOSH_T
                                                           R48.pdf.
     There were various design choices in the
parallelization process including: (a) how             Liu, H., and A. Taylor, 2018: Development of the
frequently to communicate, (b) how wide a halo              NWS’ Probabilistic Extra-Tropical Storm
to establish, (c) whether to shift the grids or             Surge Model and Post Processing
update all loop indexes, and (d) what topology to           Methodology.     16th Symposium on the
use for the domain decomposition. The halo-                 Coastal Environment, Austin, TX, Amer.
width decision was explored to determine its                Meteor.      Soc.,      1.2,    8      pp.,
impact. Other decisions, such as topology or                https://ams.confex.com/ams/98Annual/medi
communication frequency, could be explored in               afile/Manuscript/Paper329410/P-ETSS1p0_
the future. For instance, the best way to                   AMS_abstract_extended.pdf.
decompose a grid may be basin dependent as it
may involve balancing the number of wet/dry            _____, and A. Taylor, 2020: Latest Development
cells. Similarly, it may be better to communicate         in the NWS’ Probabilistic Extra-Tropical
a halo-width of 2 before the Continuity and               Storm Surge Model. 18th Symposium on the
Momentum stages and then a halo-width of 5                Coastal Environment, Boston, MA, Amer.
before the Smoothing stage. The results further           Meteor.      Soc.,      4.2,     10     pp.,
show that the optimal number of processors may            https://ams.confex.com/ams/2020Annual/w
be basin dependent, so for ensemble systems,              ebprogram/Paper370559.html.
consideration should be given to running
different basins with different numbers of             Shaffer, W. A., C. P. Jelesnianski, and J. Chen,
processors.                                               1989: Hurricane Storm Surge Forecasting.
                                                          11th Conference on Probability and
    In the near term, MDL needs to resolve how            Statistics    in    Atmospheric     Sciences,
to handle basins with a periodic boundary                 Monterey, CA, Amer. Meteor. Soc., pp. J53-
condition (e.g., UB(I,1) = UB(I,N) for I = 1 … M).        J58,
An example of this is the Puerto Rico basin,              https://slosh.nws.noaa.gov/docs/Shaffer198
which allows water to flow from one edge to the           9HurricaneStormSurgeForecasts.pdf.
opposite edge. Additionally, MDL will be working
to add spatially varying bottom friction to SLOSH.     Smith, J. M., A. B. Kennedy, J. J. Westerink, A.
                                                          A. Taflanidis, and K. F. Cheung, 2012:
7. REFERENCES                                             Hawaii Hurricane Wave and Surge Modeling
                                                          and Fast Forecasting. Int. Conf. Coastal.
Jelesnianski, C. P., J. Chen, W. A. Shaffer, and          Eng.,      vol.   1,   no.     33,   p     8,
    A. J. Gilad, 1984: SLOSH- a hurricane storm           https://doi.org/10.9753/icce.v33.manageme
    surge forecasting model. Preprints Oceans             nt.8.
Taylor, A., and Glahn, B., 2008: Probabilistic   Yang, D., Van der Westhuysen, A., Rhome, J.,
    Guidance for Hurricane Storm Surge. 19th        and Fritz, C., 2020: Efficient Wave-Surge
    Conference on Probability and Statistics,       Coupling with SLOSH-Wave for Hispaniola.
    New Orleans, LA, Amer. Meteor. Soc., 7.4.,      18th     Symposium     on    the  Coastal
    https://ams.confex.com/ams/pdfpapers/132        Environment, Boston, MA, Amer. Meteor.
    793.pdf.                                        Soc.,                                4.4.,
                                                    https://ams.confex.com/ams/2020Annual/w
                                                    ebprogram/Paper370526.html.
You can also read