Time-of-Flight Technology - Medical Review - Canon Medical Systems USA
←
→
Page content transcription
If your browser does not render page correctly, please read the page content below
Medical Review

Time-of-Flight Technology

                                Bing Bai, PhD
             Clinical Sciences Manager, PET/CT
                        Canon Medical Systems
INTRODUCTION                                                      where the difference between the arrival times at the
Improving the care for every patient while providing a high       detectors of the two photons is measured and used to help
standard care to the entire population of patients you treat      to identify the location of the radioisotope injected into
is a goal of every provider of healthcare today. Providing        the patient. By incorporating the TOF information in image
quality and safer care is always weighed with reducing the        reconstruction, the signal-to-noise ratio (SNR) and contrast
total cost of that care and providing high end technology         recovery of the image can be substantially improved,
that can possibly help providers is the goal of Canon Medical     especially for large patients.
Systems and the goal of Celesteion™ PET/CT.                       Patients undergoing PET imaging receive
Celesteion is designed with patients in mind. With the            radiopharmaceuticals labeled with positron-emitting isotope.
industry’s largest bore of 90 cm (CT) and 88 cm (PET), a true     A positron produced from radioactive decay travels a short
scan field of view at 70 cm (CT and PET) and Time-of-Flight       distance before annihilating with an electron. The annihilation
technology, Celesteion can enable facilities to improve care      generates two 511 keV photons emitted in opposite directions.
and maximize their investment.                                    These photons are detected in the scanner and processed
                                                                  through electronics to check for various criteria such as
Positron emission tomography (PET) is a widely used               if each photon has the right amount of energy (typically
molecular imaging modality with a broad range of clinical         between 350-650 keV) and if the photons have arrived almost
applications in oncology, neurology and cardiology.               simultaneously (within 5-6 ns or less of each other). If all criteria
Over the last two decades, tremendous advancements                are satisfied, then a coincidence event is recorded. Each
in instrumentation and data processing methods have               coincidence event can be stored separately as is the case with
greatly improved image quality. One of the latest technical       “list-mode” data or alternatively, the total number of events
developments is the evolution of time-of-flight (TOF) PET,        detected at each detector pair can be stored. A mathematical

Figure 1: Illustration of Conventional PET (A) and TOF PET (B).

2      Celesteion Time-of-Flight PET Technology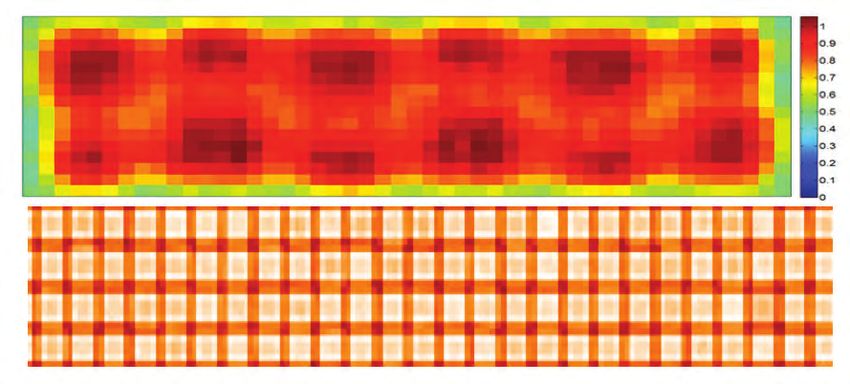
algorithm is then applied to reconstruct the distribution of the          LOR in Figure 1A, the value of each image pixel along the
radiopharmaceuticals from the collected PET data.                         LOR is increased by an amount proportional to the number
                                                                          of events measured between the two detectors at the ends
Conventional PET only uses the total number of events
                                                                          of the LOR. All the events recorded in the LOR contribute
between each detector pair for image reconstruction, as
                                                                          equally to all the pixels along the LOR and add noise to the
shown in Figure 1A. With TOF-PET, the difference between
                                                                          pixels. With TOF, the contribution of each event to each pixel
arrival times at the two detectors is measured and used to
                                                                          is weighted by the probability of the event occurred when
pinpoint the location of the source, as shown in Figure 1B.                                           c
The distance between the source and the center of the line                                         = _ t from the pixel, as shown in
                                                                          the two photons arexemitted
                                                                                                      2
                                                                          Figure 1B. As a result, only the events near the pixel where
connecting the detector pair (called line of response, or LOR)
x can be computed from the arrival time difference t as:                  it originated contribute to the pixel and add noise to it.
                                                                          Based on this analysis, we can derive the following SNR
                                c                              (1)        improvement factor using TOF information2,3:
                             x= _t
                                2                                                               2
                                                                                            SNR TOF            2D                        (2)
                                                                                                           =
where c is the speed of light.                                                                  2
                                                                                         SNR Non–TOF           c∆t
Theoretically, if we could measure the arrival time difference
t perfectly, then we could put                                            where D is the diameter of the subject being imaged and Δt
                              2 each coincidence event back
to the source location,SNR
                         and no         2D reconstruction
                                tomographic
                              TOF                                         is the timing resolution.
                                     =
                           2 However,c∆t
algorithm would beSNR needed.            even the fastest                 The above SNR gain factor was originally derived for the
                           Non–TOF
PET detector technology today can only achieve a timing
resolution of about 400 picosecond, which results in a
                                                                                                   ( μdisk
                                                                          central pixel in a uniform
                                                                                                      H – μB) / μB
                                                                                                           source scanned using 2D PET
                                                                          and reconstructed     = FBP.
                                                                                         CRC using         Later experiments on modern
distance uncertainty of about 6 cm. The spatial resolution of                                               C
                                                                          3D PET scanners using iterative reconstruction algorithms
clinical PET scanners is about 5 mm. Therefore, the effects of            show similar results for both phantom and clinical patient
TOF on image resolution is negligible.                                    studies.4–6 It has also been demonstrated that as randoms
                                (μ – μ ) / μ                              ratio increases (randoms are events detected when the
                    CRC = andH accuracy
Improving lesion detection               B is aB key component

to improved treatment planning with   C possible better                   two photons arrive at the detectors simultaneously are not
                                                                          related to each other,   σB
outcomes when treating Oncology patients. The major                                    Noise = which happens more often when
advantage of TOF is the improvement in image SNR,                                                  μB
                                                                          more radioactivity is injected),  the SNR gain due to TOF also
which results in better lesion detection performance1. To                 increases.6 Furthermore, phantom studies suggest that TOF
understand the SNR benefit of TOF, let’s assume an analytic               image quality with reduced counts (through less injected
reconstruction algorithm such σ as filtered backprojection                dose or shorter scan time) is equivalent to conventional
                 Noise
(FBP) is applied to       = InBFBP, the projection data is
                    the data.                                             non-TOF image.4 Therefore, TOF technology can possibly
filtered, then backprojectedμtoB image space. If we look at the           reduce radiation dose, PET 2Dscan time and2 xoverall table) time
                                                                                                                         35 ( cm
                                                                                 TOF gain =               =                                  = 5.6
                                                                                                    c∆t        0.03( cm ) x 420 ( ps )
                                                                                                                     ps
                                                     Nal(TI)         BaF                BGO                   LSO             LYSO
                      2D        2 x 35 ( cm)          2
           TOF gain =     =                         = 5.6
 Effective Z
                      c∆t   0.03( cm
                                   51) x 420 ( ps )54                                     74                   66               60
                                  ps

 Linear atten. coeff. (cm1)                           0.34           0.44               0.92                0.87               0.86

 Density (gm/cm3)                                     3.67           4.89                7.13                  7.4              7.1

 Light yield (% Nal(TI))                              100             5                   15                   75               80

 Decay constant (ns)                                  230            0.8                 300                   40               41

Table 1: Properties of some PET scintillators [7].

                                                                                         Celesteion Time-of-Flight PET Technology            3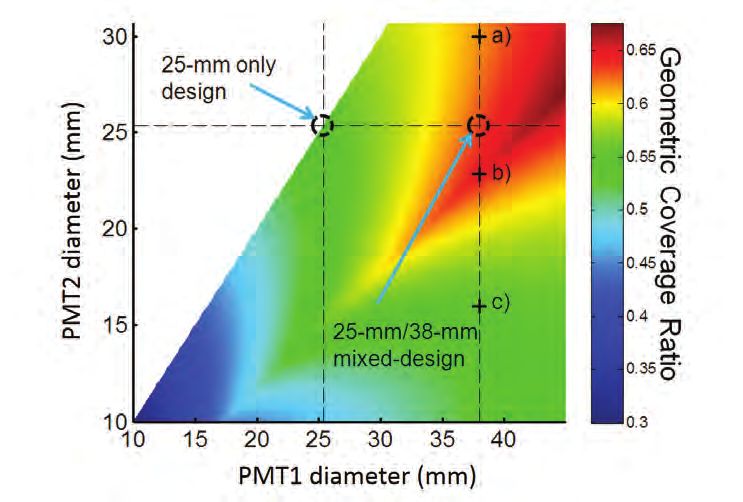
for improved workflow and patient satisfaction during PET              scintillators have short decay time and can be used for TOF
procedures. The dose (or time) reduction factor can be                 PET. And unlike the TOF scintillators used in the 1980s, they
estimated using equation2.                                             have high stopping power and very good light output so
                                                                       the efficiency of the detector is not compromised.

CANON MEDICAL SYSTEM CELESTEION TOF                                    In order to optimize the performance of the scanner for
PET TECHNOLOGY                                                         different clinical applications and patient populations,
                                                                       Canon Medical Systems’ Celesteion PET/CT uses Lutetium-
New Modular Detector Designed for TOF PET                              based scintillator and a new modular and scalable detector
Detector design is critical for PET. Scintillator is the material      design.9 Figure 2 shows a Celesteion PET detector module
of choice for radiation detectors in PET. Table 1 lists the key        and two detector designs commonly used in commercial
properties of some PET scintillators.7 The first generation            PET scanner. Each module is two-side buttable in the
of TOF PET scanners was built in the 1980s, using fast                 transaxial direction. Twelve photomultiplier tubes (PMTs)
scintillators such as CsF and BaF2.8 Although timing                   with two different sizes (25mm and 38mm) are arranged in
resolution was sufficient, the low stopping power and weak             a rectangular pattern. The scintillator area is divided into five
light output made these scintillators less efficient. BGO              overlap trigger zones. Each trigger zone has four PMTs and
detectors, which were developed shortly after, have much               the neighboring zones share two PMTs.
higher stopping power and acceptable light output and                  The main features of Celesteion TOF PET detectors include:
became the standard material for PET scanners for many
years. Due to the long decay time and low light output,                High Light Collection Efficiency
BGO is not useable for TOF PET and thus the development                The unique mixed-size PMT design of Celesteion PET module
of TOF PET was paused. The discovery of Lutetium-                      ensures high light collection efficiency, which is critical for
based scintillators such as LSO and LYSO prompted the                  excellent timing resolution. This is achieved by optimizing
development of a new generation of PET scanners. These                 the geometric coverage ratio of the scintillator area by the

Figure 2: Celesteion PET detector module and two PET detector designs commonly used for commercial PET scanners [9]

4     Celesteion Time-of-Flight PET Technology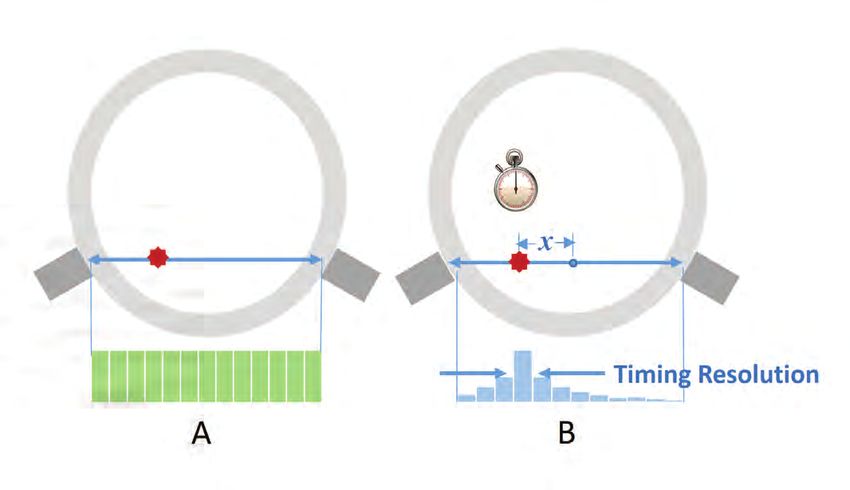
active areas of the PMTs. Figure 3 shows the calculated                 On average 94% of the light is collected by the four PMTs in
geometric coverage ratio as a function of the size of the               each trigger zone. In contrast the block detector has many
PMTs. By combining 25mm and 38mm PMTs, the Canon                        edge crystals which have lower efficiencies than those in the
Medical System Celesteion achieves a geometric coverage                 center of the block.
ratio that is near optimal.
                                                                        Excellent Count-Rate Performance
Detector crystals near the edge of PET detector modules                 Some PET studies require larger amounts of radioactivity
have lower detection efficiency and light collection                    to be injected into the patient. For example, in a stress-
efficiency, deteriorating the performance. Celesteion PET               rest myocardial perfusion study 25-50 mCi of Rubidium-82
detector has about 16% edge crystals, much less than what               may be injected, which results in the very high count
is typical for block detectors (30-50%).                                rate necessary for the exam.11 As count rate increases, PET
                                                                        detector performance deteriorates due to deadtime and
Figure 4 shows the uniformity of light collection efficiency            pile-up effect. The area of scintillator coupled to a single
of a Celesteion PET module and a block detector module.10               trigger zone determines the PET scanner performance

                   Figure 3: Geometric coverage ratio as a function of PMT diameters. The 25/38 mm mixed-design is
                   used in Celesteion, resulting in near optimal geometric coverage ratio [9].

                           Figure 4: Light collection efficiency of Celesteion detector module [9] and a block
                           detector module [10]

                                                                                         Celesteion Time-of-Flight PET Technology      5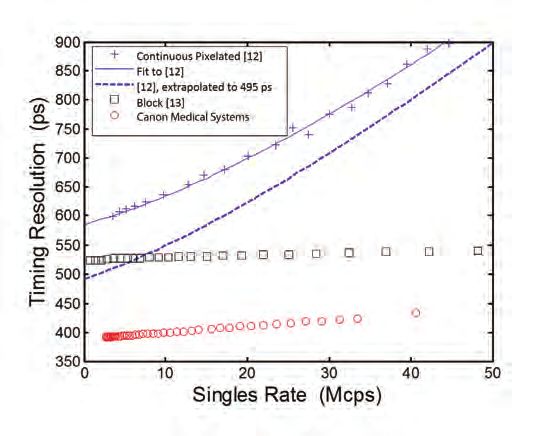
at high count rates. Smaller trigger areas will reduce the              EVALUATION OF TOF BENEFITS
deadtime and pile-up effect.                                            To demonstrate the improvement to image quality using
                                                                        TOF, we scanned a 35cm diameter cylindrical phantom.
Best In-Class Timing Resolution                                         Twelve spherical inserts were attached to the removable cap
The combination of fast, bright Lutetium-based scintillator,            in two radii. Six spheres with inner diameters between 10
fast PMTs and mixed-size, modulated detector design results             mm and 37 mm were inserted in the inner radius (about 6
in excellent timing resolution of Celesteion. The timing                cm from the sphere centers to the center of the phantom).
resolution of Celesteion was measured using two cylindrical             Another six spheres with inner diameters of between 3.95
phantoms filled with F18 solution and a Ge68 point                      mm and 13 mm were inserted in the outer radius (about 10
source between the phantoms9. This experimental setup                   cm from the sphere center to the center of the phantom).
represents the situation encountered in the clinic, with large
                                                                        18
                                                                           F-FDG solutions were injected into the background and
proportion of lower-energy scattered radiation. Timing                  spheres. The phantom was positioned such that the center
resolution was measured as a function of system singles                 of the spheres were located in the axial center of the scanner
rate (singles counts all the individual photons detected in             FOV. We scanned the phantom for 2 minutes and 10 minutes
the scanner). Figure 5 shows the result. As expected, the               respectively. The background activity concentration was
timing resolution of Celesteion PET detectors gets slightly             4.6 kBq/cc at the beginning of the scan, and the sphere-to-
worse as singles rate increases. Nevertheless the modulated             background concentration ratio was 8.4.
detector design of the Celesteion outperforms block                     We reconstructed the data using a 3D listmode OSEM
detectors and continuous pixelated detectors at all singles             algorithm with and without TOF. A new area-simulating-
rates. Also the timing resolution of continuous pixelated               volume (ASV) projector has been developed for Celesteion,
detectors gets worse at a faster rate when the singles rate             which accurately models the PET system and is very fast
increases as expected.                                                  to compute.15 Twenty subsets were used for both TOF and

Figure 5: Timing resolution as a function of system singles rate. The   Figure 6: Contrast vs. noise plot for the 10 mm diameter sphere in
blue symbols (+) and black symbols (squares) were digitized from [12]   the 35 cm diameter cylindrical phantom scanned on Celesteion.
and [13], respectively. The blue dashed line is extrapolated based on
timing resolution of 495 ps measured on newer scanners [14].

6     Celesteion Time-of-Flight PET Technology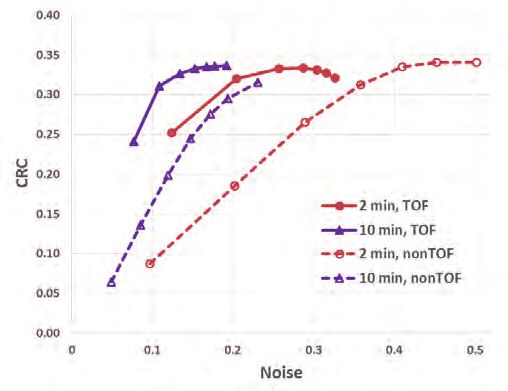
c
x= _t
2
2
SNR TOF 2D
=
2
SNR Non–TOF
non-TOF reconstruction. A Gaussian c∆t FWHM
filter with 6mm The CRC vs. noise curves in Figure 6 shows that the TOF
was applied after the image was reconstructed. We drew a gain is slightly better than 5, which is consistent with the
2
10 mm diameter sphericalSNRregion 2D (ROI) on the 10
TOF of interest estimation using equation (2).
mm sphere in the inner circle =
and measured the mean μH.
2 c∆t
A 30 mm diameter SNR Non–TOF
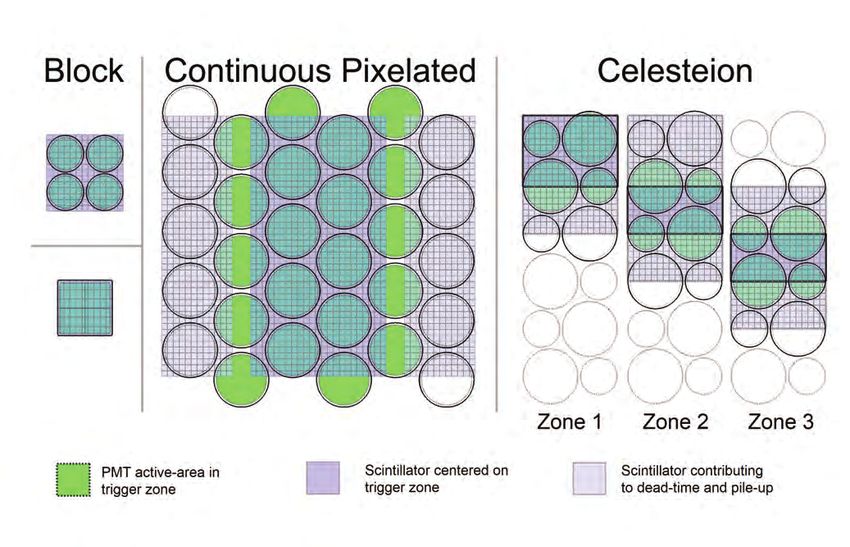
spherical ROI was drawn in the central From Figure 6 we can see that the TOF image from 2 minute
background area_ c of the phantom, at least 25 mm away from data reconstructed using 2 iterations of OSEM has similar
( μ – μ B ) / μ BσB of
x = Thet mean μ and standard
all the spheres. 2 CRC
B = H deviation CRC and noise as non-TOF image from 10 minute data
C
the background ROI were measured. The contrast recovery
reconstructed using 8 iterations of OSEM. Figure 7 shows these
coefficient (CRC) and noise were given by:
two images. Similar image quality is seen in both images, while
(μH – μB) / μB (3) the acquisition time is different by a factor of five.
2
SNR TOF
=
CRC 2D
= C
2
SNR Non–TOF c∆t
σB (4)
Noise = CONCLUSIONS
μB
It has been demonstrated in the literature that TOF PET can
Figure 6 shows the CRC vs. noise measurements. First, we improve SNR and contrast recovery of image, compared
σB
observe that the TOF reconstruction converges faster. After to the conventional, non-TOF PET technology. As a result,
( μNoise
3 iterations,=TOF Himage )=/very
– μ B is μμB close to the peak CRC value.
CRC B PET studies using TOF technology can be done with less
With non-TOF, 5-8 iterations
C are necessary to achieve near
peak CRC. Second, we notegainthat the 2D 2 x 35 ( cm) scan time. The TOF gain gets larger as the timing resolution
TOF = 2 minute
= TOF curve is = 5.6or when the patient is bigger. Using innovative
much better than the 2 minute non-TOF c∆tcurve,0.03 cm x 420 gets
and even better
slightly better than the 10 minute non-TOF curve (higher
( ps ) ( ps )
technologies such as the modular PET detector, Celesteion
CRC at the same noise level, or 2Dless noise with
2 xthe35
same PET/CT has achieved excellent timing resolution and image
σB that = =
( cm ) =
CRC). This
Noise = TOF
shows gain
the quality of the 2 minute TOF image 5.6 Phantom study suggests that for a 35 cm diameter
quality.
μ B than that of c∆t cm 420 ( ps ) subject, TOF may reduce the dose or time by a factor of five,
is slightly better the 10 minute ( ps ) ximage.
0.03non-TOF
Using the simple TOF gain equation (2) and the measured
without sacrificing the image quality.
TOF timing resolution of 420 ps, we can calculate the time
reduction factor using TOF (TOF gain) as: Improving the quality of care with technology like a large
2D 2 x 35 ( cm) (5) bore, a large field of view and 3D listmode TOF reconstruction.
TOF gain = = = 5.6 Celesteion can provide improved accuracy and possibility a
c∆t 0.03( cm ) x 420 ( ps )
ps safer, faster and overall a better patient experience.
Figure 7: TOF image from 2 minute scan (left) and non-TOF image from 10 minute scan (right). The TOF image
was reconstructed using 2 iterations of OSEM, while the non-TOF image was reconstructed using 8 iterations
of OSEM. Both with 20 subsets and 6 mm Gaussian post filter.
Celesteion Time-of-Flight PET Technology 7REFERENCES
1. T . H. Farquhar, J. Llacer, J. Sayre, Y.-C. 6. G
. Mettivier, V. Tabacchini, M. Conti, and 11. R . Nakazato, D. S. Berman, E.
Tai, and E. J. Hoffman, “ROC and LROC P. Russo, “Signal-to-noise gain at variable Alexanderson, and P. Slomka, “Myocardial
analyses of the effects of lesion contrast, randoms ratio in TOF PET,” Nucl. Sci. IEEE perfusion imaging with PET,” Imaging
size, and signal-to-noise ratio on Trans. On, vol. 59, no. 5, pp. 1948–1957, 2012. Med., vol. 5, no. 1, pp. 35–46, 2013.
detectability in PET images,” J. Nucl. Med.,
vol. 41, no. 4, p. 745, 2000. 7. T . K. Lewellen, “Recent developments in PET 12. S . Surti, A. Kuhn, M. E. Werner, A. E. Perkins,
detector technology,” Phys. Med. Biol., vol. J. Kolthammer, and J. S. Karp, “Performance
2. T . F. Budinger, “Time-of-flight positron 53, no. 17, p. R287, 2008. of Philips Gemini TF PET/CT scanner with
emission tomography: status relative to special consideration for its time-of-flight
conventional PET,” J. Nucl. Med., vol. 24, no. 8. M
. Conti, “State of the art and challenges imaging capabilities,” J. Nucl. Med., vol. 48,
1, pp. 73–78, 1983. of time-of-flight PET,” Phys. Med., vol. 25, no. 3, pp. 471–480, 2007.
no. 1, pp. 1–11, 2009.
3. W
. Moses, “Time of flight in PET revisited,” 13. B . Jakoby, Y. Bercier, M. Conti, M. Casey,
Nucl. Sci. IEEE Trans. On, vol. 50, no. 5, pp. 9. K. C. Burr, G.-C. Wang, H. Du, G. Mann, K. T. Gremillion, C. Hayden, B. Bendriem,
1325–1330, 2003. Balakrishnan, J. Wang, X. Li, C. Rollet, E. and D. Townsend, “Performance
Kundro, and M. Buhin, “A new modular investigation of a time-of-flight PET/CT
4. S. Surti, S. Karp, L. M. Popescu, E. and scalable detector for a Time-of-Flight scanner,” presented at the Nuclear Science
Daube-Witherspoon, and M. Werner, PET scanner,” presented at the Nuclear Symposium Conference Record, 2008.
“Investigation of time-of-flight benefit for Science Symposium and Medical Imaging NSS’08. IEEE, 2008, pp. 3738–3743.
fully 3-DPET,” IEEE Trans Med Imaging, vol. Conference (NSS/MIC), 2012 IEEE, 2012, pp.
25, no. 5, pp. 529–538, 2006. 2830–2834. . Perkins, “Astonish TF: Technical
14. A
overview of Philips time-of-flight PET
5. C
. Lois, B. W. Jakoby, M. J. Long, K. F. 10. J . J. Williams, D. L. McDaniel, C. L. Kim, design and its clinical behavior.” Philips
Hubner, D. W. Barker, M. E. Casey, M. and L. J. West, “Detector characterization Healthcare.
Conti, V. Y. Panin, D. J. Kadrmas, and D. W. of discovery ST whole-body PET scanner,”
Townsend, “An assessment of the impact presented at the Nuclear Science 15. H
. Ye, X. Niu, and W. Wang, “Improved
of incorporating time-of-flight information Symposium Conference Record, 2003 IEEE, list-mode reconstruction with an Area-
into clinical PET/CT imaging,” J. Nucl. Med., 2003, vol. 2, pp. 717–721. Simulating-Volume projector in 3D
vol. 51, no. 2, pp. 237–245, 2010. PET,” presented at the Nuclear Science
_CANON MEDICAL SYSTEMS USA,INC_
Symposium and Medical Imaging 2017.7.21
Conference (NSS/MIC), 2012 IEEE, 2012, pp.
3311–3314.
Follow us: https://us.medical.canon @CanonMedicalUS +CanonMedicalUS Canon Medical Systems USA, Inc. +CanonMedicalUS
https://us.medical.canon
2441 Michelle Drive, Tustin CA 92780 | 800.421.1968
©Canon Medical Systems, USA 2018. All rights reserved.
Design and specifications subject to change without notice.
Celesteion and Made for Life are trademarks of Canon Medical Systems Corporation. Google+ logo and YouTube logo are trademarks of Google Inc.
TWITTER, TWEET, RETWEET and the Twitter logo are trademarks of Twitter, Inc. or its affiliates. LinkedIn, the LinkedIn logo, the IN logo and InMail
are registered trademarks or trademarks of LinkedIn Corporation and its affiliates in the United States and/or other countries.
CTWP12776US MCAMR0134EBAYou can also read