Disseminating Results of Mining Ordinances and their Tweets by Android App Development
←
→
Page content transcription
If your browser does not render page correctly, please read the page content below
Disseminating Results of Mining
    Ordinances and their Tweets by
        Android App Development

             Master’s Project Report
In Partial fulfillment of the requirements for a degree
  in Master of Science in Information Technology
                      Dec 2019

      Submitted by: Christina Babu Varghese
             Advisor: Dr. Aparna Varde
          Department of Computer Science
             Montclair State University
                 Montclair, NJ, USA

                                                      1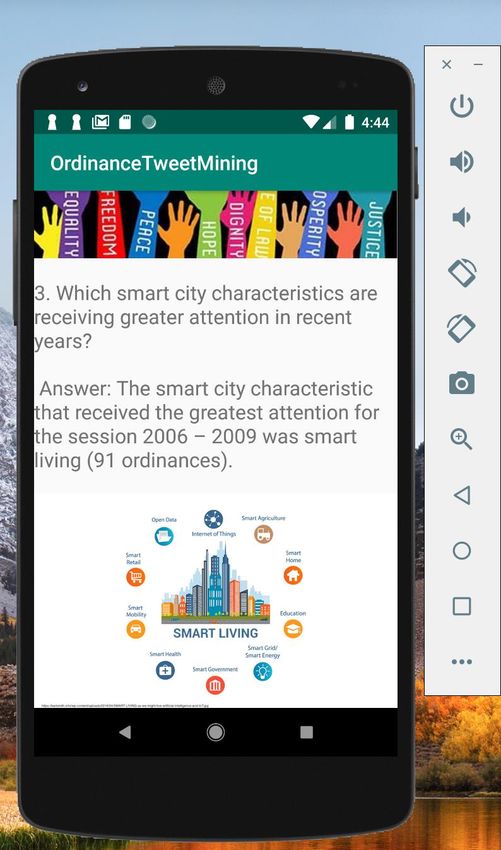
Table of Contents

1         Abstract ........................................................................................................................ 3
2         Background and Problem Definition............................................................................. 3
3         Methods and Models ..................................................................................................... 4
    3.1       Methods Deployed ..............................................................................................................4
    3.2       Models and Materials .........................................................................................................7
4         Implementation of the App ............................................................................................ 8
5         Results........................................................................................................................ 10
    5.1       App Implementation Results ............................................................................................ 10
6         User Surveys ............................................................................................................... 14
7         Conclusions ................................................................................................................ 21
8         Acknowledgement ....................................................................................................... 21
9         Works Cited ................................................................................................................ 22

                                                                                                                                           2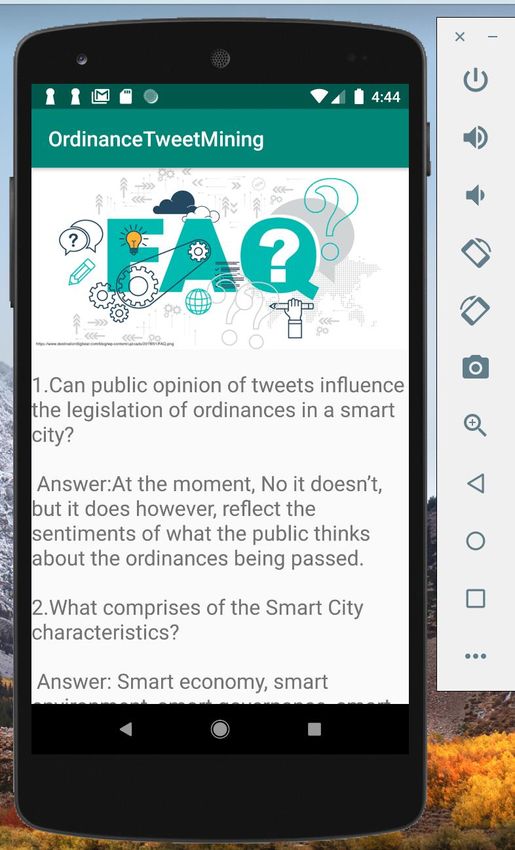
1 Abstract

    This paper focuses on how populations can get more aware, by the
    use of technology, more specifically, an app to understand how
    local ordinances are passed in a city, how these ordinances result in
    changing the city for the better and in extension, make it head
    towards becoming a Smart City or a leading Smart City

    The main goal of this project is to develop an Android-based
    Ordinance Tweet Mining App that shows how government
    ordinances contribute towards the making of a Smart City. In this
    project, we focus on Smart City Characteristics such as Smart
    Economy, Smart Mobility, Smart Governance, Smart Living,
    Smart Environment and Smart People.

    This app would be beneficial to various users such as
    environmental scientists, policy makers, city committees as well as
    the general public in becoming more aware of what committees to
    reach out to and different ways in contributing to making a region
    head towards a Smart City.

    Keywords: Urban Policy; Smart Governance; Smart Living; Social
    Media; Sentiment Analysis

2 Background and Problem Definition
    New York City comprises of 5 boroughs sitting where the Hudson
    River meets the Atlantic Ocean. At its core is Manhattan, a densely
    populated borough that’s among the world’s major commercial,
    financial and cultural centers. Its iconic sites include skyscrapers
    such as the Empire State Building and the sprawling Central Park.
    Broadway theater is staged in neon-lit Times Square. It is also
    known as the economy hub of the world which is constantly the
    center of emerging technologies and smart innovations in every

                                                                        3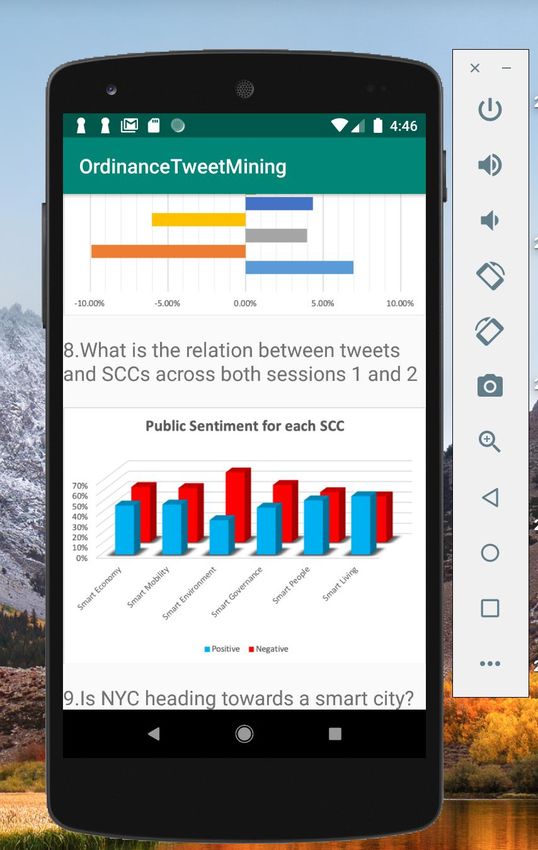
field. This was the main motivation to choose New York City in
     our research to show the results of different ordinance-passing
     sessions in the app, and indicate how it has moved New York City
     towards enhancing as a Smart City.

     According to the Webster dictionary, the definition of an
     “ordinance” is “a law set forth by a governmental authority”.
     (Merriam Webster, n.d.) [3]. It plays a crucial role in helping cities
     maintain direction and successful progression towards the future
     while keeping up with the rest of the world. In our research we
     look at tweets that are being posted in Social Media i.e. Twitter to
     measure the sentimental responses of the ordinances being passed
     in New York City [10].

     The goal of our work is to leave the user with a better
     understanding of the whole process from the start of creating an
     ordinance and the factors that affect it to find ways to make a given
     region head towards a smart city [4, 5, 6] or become a leading
     smart city based on several characteristics.

3 Methods and Models

3.1 Methods Deployed

To develop this app, we comprehensively used the principles inspired by
Human Computer Interaction (HCI) [19, 20] to create a user experience
that would be all encompassing for all kinds of ages and technology
users. Since this app would be beneficial to various individuals, ranging
from policy makers to the common public, our main goal was to keep in
mind that users from all walks of life should be able to use this app and
be well informed about the activities of Smart City Ordinances in their
local region.

                                                                          4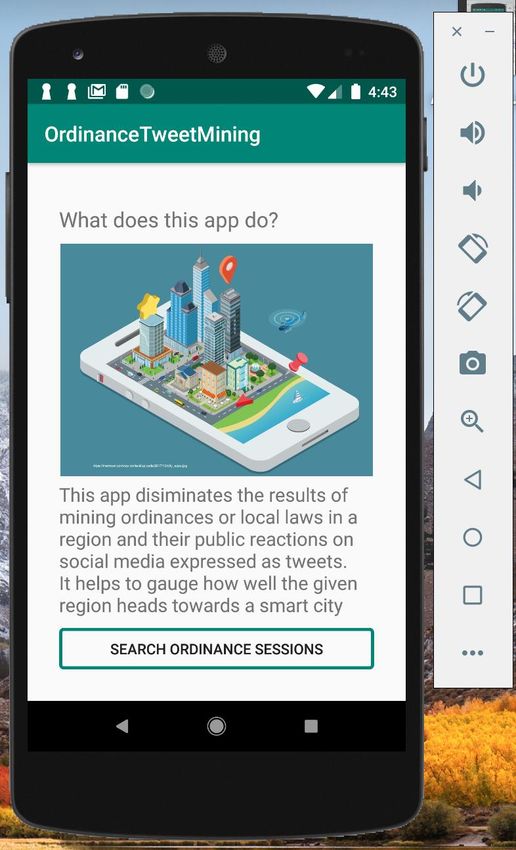
For the creation and layout of the app, mockup designs are initially
designed to give a sense of what the blueprint of the app is going to be.
The main aspect that we kept in mind is simplicity and efficiency of the
app. Whether its navigation, time spent to find an explanation to a
question asked by the user or even the analytical graphs being displayed,
anybody with a basic sense of critical thinking should be able to
decipher the results being displayed.

LAYOUT 1                                    LAYOUT 2

Figure 1a. Mockup Design for the App

                                                                        5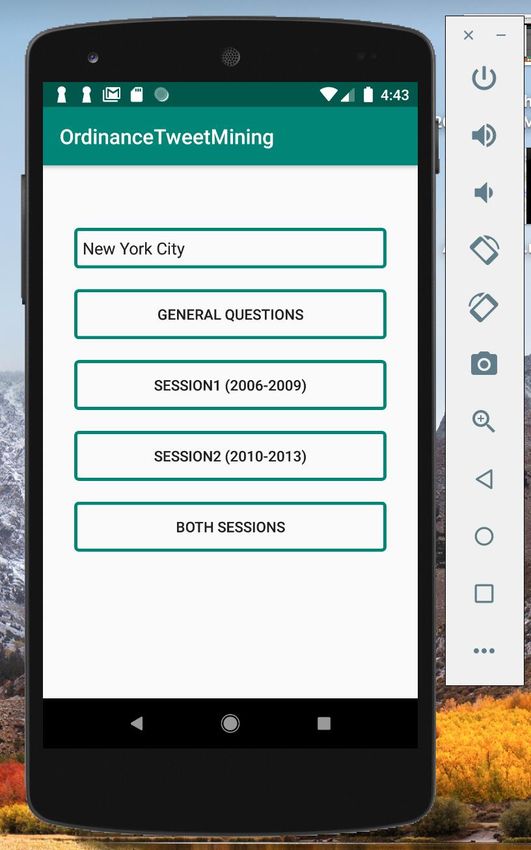
LAYOUT 3

Figure 1b. Mockup Design for the app (cont’d)

Layout 1 serves as a landing page as well as the welcome page to the
first ever Ordinance tweet mining app with a call to action button
labeled as “Get Started”.

Layout 2 gives the user a brief description of what the app does through
a small description and overview of the app’s focus.

                                                                           6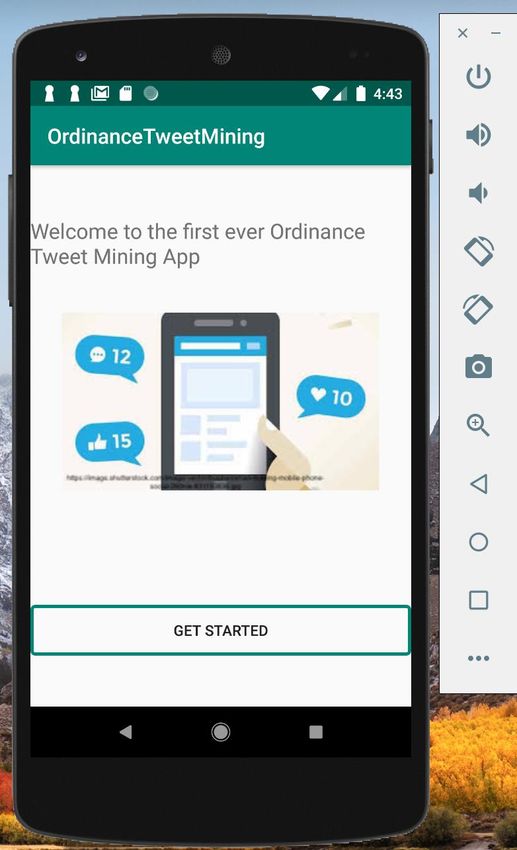
Layout 3 shows the main selection page where the users get to choose
the region. This is followed by the 4 main selection categories labeled
as: “general questions”; “session 1” (a time span ranging 3 years from
2006 – 2009); “session 2” (a time span ranging from 2010 – 2013); and
“both sessions” (information collected from the 2 sessions and combined
to give the overall results of ordinances passed and the sentimental tweet
analysis from these sessions).

3.2 Models and Materials

For this particular app development, we used models derived from
Microsoft Excel such as bar graphs and pie charts, as well as statistical
models to derive the information displayed on the app. Figure 2 depicts
the flow of the app navigation process, by referring to useful sources [1].

                 Figure 2. App Navigation Process Flow

                                                                          7
Figure 2 shows the flow of output results desired by the user at various
pages of the app. Figure 2 also summarizes the user interaction with the
system and illustrates how HCI concepts [19, 20] are implemented into
the architecture of the app. From the results and positive feedback of the
survey conducted, it has already proven to be beneficial to the targeted
users of New York City.
4 Implementation of the App
Figure 3. Implementation Diagram
Figure 3 illustrates the deployment process of an application first created
and developed in Android Studio [2]. The following steps are used for
the implementation of this app based on relevant sources in the literature
[1, 2, 9]. Android applications are written in Java. It uses Android SDK
tools to compile classes, resources and package the code along with any
required data. Android depends on Linux OS for essential operating
services such as security management, process management, network
stack etc. The Linux kernel plays the role of an abstraction layer
between the hardware and the software stack.
81. The application is first initialized by creating a new project in
Android Studio
2. The main activity page is where the app is built and prompted
to run with the help of an emulator
3. For the front end of the application, XML files are created to
outline the layout of the application’s user interface
4. The Android manifest .xml file then describes the main
characteristics of the project to express each of its modules
5. The ordinance data for the app is provided by researchers
from the Department of Earth and Environmental Studies and
the Department of Computer Science at Montclair State
University, via their earlier works [15, 16, 17, 18]
6. The ordinance session records are extracted from knowledge
bases (KBs) that encompass Common Sense Knowledge
(CSK) [21], which is very useful in AI (Artificial
Intelligence) systems today. More specifically, we use web-
based repositories such as WebChild [7] and WordNet [8]
7. The records are then mapped to tweets to create a sentiment
analysis behind each ordinance
8. The results are finally imported to Android Studio and
displayed in their respective selection category
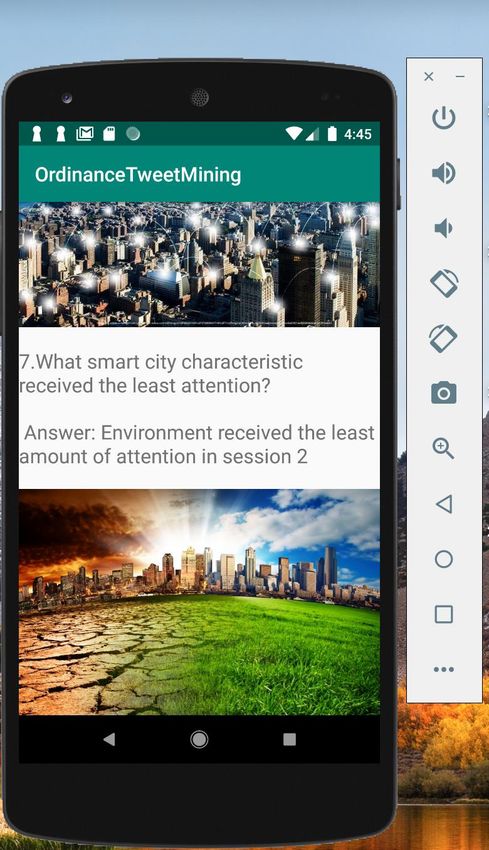
95 Results
5.1 App Implementation Results
This Ordinance-Tweet Mining App gives very good results with
graphical displays and FAQs (Frequently Asked Questions). We
demonstrate the results of the app with the following 7 example
screenshots that together constitute Figure 4.
1011
12
Figure 4. Results of the App after Implementation

                                                    13
As shown in Figure 4, the app is successfully implemented with the
main aspect of simplicity and efficiency of use for any user. The user
can easily navigate from different pages of the app and select the New
York City region, to get the information from the desired session or
category to obtain the required results.
6 User Surveys
In order to evaluate the success of this app, we conduct user surveys. We
create the survey questions mainly with a Likert Scale format. The
objective results of the survey appear in Figures 5 to 10. The results
summarize the responses of 32 participants, which include Computer
and Environmental Scientists, students, Lawyers, policy makers,
students and researchers. The following results show favorable
responses towards this Ordinance-Tweet Mining App.
14Figure 5. Responses to Q1 on most relevant field of work
The answer choices for the Q1 are as follows
Answer Choices Response Rate Qty
Environmental Science 8.57% 3
Comp Science/Info Tech 45.71% 16
Business Administration 8.57% 3
Law 8.57% 3
Government Science 5.71% 2
Other (Please Specify) 22.86% 5
Total 32
15Figure 6. Responses to Q2 on occupation category
The answer choices for the Q2 are as follows
Answer Choices Response Rate Qty
Student 14.29% 5
Professor 22.86% 8
Corporate 37.14% 13
Other 25.71 9
16Figure 7. Responses to Q3 on ease of use of the app
17Figure 8. Responses to Q4 on helpfulness of the app’s question and
answer section
18Figure 9. Responses to Q5 on awareness of urban policy
19Figure 10. Responses to Q6 on user opinion of NYC getting better as a
Smart City
In addition to these objective results seen in the survey questions
designed using the Likert Scale, there are subjective responses of the
survey participants (Q7). These appear next, combined into a common
Figure 11.
20Figure 10. Responses to Q7 on additional comments of the app
217 Conclusions
This project addresses the issue of Ordinance Mining and the
sentimental tweet analysis attached to each ordinance related to a smart
city characteristic between the sessions of 2006 – 2009 and 2010 – 2013.
An ordinance tweet mining app was created to get the public involved
with the processes of passing ordinances within their region and
bringing awareness towards the different smart city characteristics that
encompasses a smart city. From this data, the users can make well
informed decisions within their local region and contribute in new ways
whether becoming a part of the city council committee or by supporting
the region in general through financial means or community outreach.
The work done has a huge potential to be extended worldwide to
different existing smart cities around the world or regions that are
heading towards becoming a smart city.
8 Acknowledgement
I would like to thank each and every individual who helped me through
my master’s journey, all the group project team members from different
courses taken over the years. I like to thank Xu Du, a PhD student in
Montclair State University for all the help he gave me in guiding me
through the Ordinance tweet mining process and explaining how the
data has been gathered and derived. A very special thanks to Dr. Aparna
Varde who saw the best in me and my potential even when I didn’t see it
myself, for being patient with me and working with my current abilities
to make me a better programmer and an overall better student in the field
of Computer Science and Information Technology. I would like to thank
my family for being there for a great support system throughout the
years even though we’re continents apart and especially my father who
passed away a few months ago for teaching me to be a person of impact
by always giving back to the community you are a part of, no matter
how big or small it may seem.
229 Works Cited
[1] Android Application UML Deployment Diagram Example. (n.d.).
Retrieved from wml-diagrams.org: https://www.uml-
diagrams.org/android-application-uml-deployment-diagram-
example.html
[2] Android Studio, https://developer.android.com/studio
[3] Merriam Webster. (n.d.). Ordinance. Retrieved from Merriam-
Webster: https://www.merriam-webster.com/dictionary/ordinance
[4] H. J. Scholl and S. Al Awadhi, “Smart governance as key to multi-
jurisdictional smart city initiatives: The case of the ecitygov alliance,”
Social Science Information, vol. 55, no. 2, pp. 255–277, 2016.
[5] TU-Wien, “European smart cities, technical report,” Tech. Rep.,
Vienna University of Technology, Austria, 2015.
[6] IEEE, “IEEE smart cities technical community,” 2018.
[7] N. Tandon, G. de Melo, F. Suchanek, and G. Weikum, “WebChild:
Harvesting and organizing commonsense knowledge from the web,” in
WSDM (Web Search and Data Mining comference), pp. 523–532, 2014.
[8] G. A. Miller, “WordNet: A lexical database for English,”
Communications of the ACM, vol. 38, no. 11, pp. 39–48, 1995.
[9] Google Developers. (n.d.). Create an Android project.
https://developer.android.com/training/basics/firstapp/creating-
project
[10] N. Y. C. Council, “Legislative research center web page.”
23http://legistar.council.nyc.gov/, 2018.
[11] T. Mikolov, I. Sutskever, K. Chen, G. S. Corrado, and J. Dean,
“Distributed representations of words and phrases and their composi-
tionality,” in Advances in Neural Information Processing Systems, 2013.
[12] Q. Li, S. Shah, X. Liu, A. Nourbakhsh, and R. Fang, “Tweetsift:
Tweet topic classification based on entity knowledge base and topic
enhanced word embedding,” in ACM CIKM (Conference on
Information and Knowledge Management), pp. 2429–2432, 2016.
[13] L. A. Zadeh, A. M. Abbasov, and S. N. Shahbazova, “Analysis of
Twitter hashtags: Fuzzy clustering approach,” in 2015 Annual
Conference of the North American Fuzzy Information Processing
Society (NAFIPS) held jointly with 2015 5th World Conference on Soft
Computing (WConSC), pp. 1–6, 2015.
[14] L. Sorensen, “User managed trust in social networking - comparing
Facebook, Myspace and LinkedIn,” Wireless Communication and
Electronic Systems Technology, pp. 427–431, 2009.
[15] X. Du, D. Liporace, and A. Varde, “Urban legislation assessment
by data analytics with smart city characteristics,” in IEEE Ubiquitous
Computing, Electronics and Mobile Communications Conference
(UEMCON), pp. 20–25, IEEE, 2017.
[16] M. Puri, X. Du, A. S. Varde, and G. de Melo, “Mapping ordinances
and tweets using smart city characteristics to aid opinion mining,” in
WWW (The Web Conference) Companion Vol., pp. 1721–1728, 2018.
[17] M. Puri, A. S. Varde, X. Du, and G. de Melo, “Smart governance
through opinion mining of public reactions on ordinances,” in IEEE
ICTAI (International Conference on Tools with Artificial Intelligence),
pp. 838–845, 2018.
24[18] X. Dong and G. de Melo, “Cross-lingual propagation for deep
sentiment analysis,” in AAAI Conference (Association for Advancement
of Artificial Intelligence), pp. 5771–5778, 2018.
[19] R. Harper, T. Rodden, and Y. Sellen, Being Human: Human
Computer Interaction in the Year 2020, Microsoft Research, 2008.
[20] Y. Rogers, H. Sharp, J. Peece, Interaction Design: Beyond Human
Computer Interaction, 4th Edition, Wiley, 2015.
[21] N. Tandon, A. S. Varde, and G. de Melo, “Commonsense
knowledge in machine intelligence,” ACM SIGMOD Record, vol. 46,
no. 4, pp. 49–52.
25You can also read