Flood Assessment through 1D/2D coupled Hydrodynamic modeling and Google Earth Image - Dr Dhruvesh Patel Asst. Prof., PDPU - Vedas
←
→
Page content transcription
If your browser does not render page correctly, please read the page content below
Flood Assessment through 1D/2D coupled
    Hydrodynamic modeling and Google Earth Image

                                                                      Dr Dhruvesh Patel
Date: 08/05/2018
                                                                       Asst. Prof., PDPU

               “Satellite based Hydrology and Modeling, Sac Bopal Campus, 2-11 May 2018”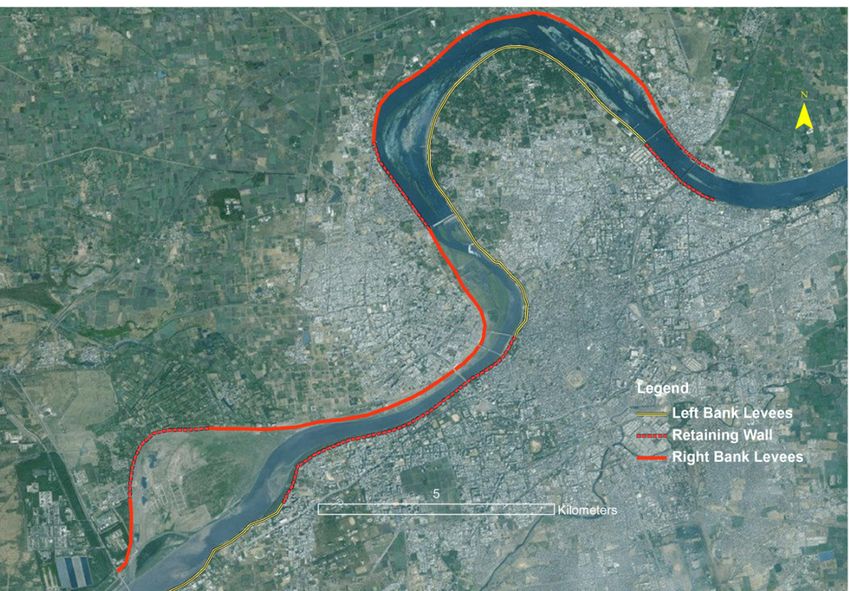
Contents
•   Introduction
•   Flood Assessment Models
•   HEC-RAS Hydrodynamic model
•   Case Study: Surat City
•   Modeling outcomes and discussion
•   Limitations
•   Conclusion
•   Opportunity
Introduction
Background:
Catastrophic events ► on rise
   (man-made & natural both)
No. of victims ► varying
     (showed no definite trend)
                                                                    Source: Swiss-Re 2017

Year 2017 reported;               http://www.swissre.com/library/editors-pick/sigma_1_2018_en.html

      - 301 Catastrophic events
      - 183 Natural Disaster, 118 Man-Made Disaster
      - 11,404 people killed
      - 190 million people affected
      - 337 billion US$ economic loss
Disaster types:
• Occurrence for
  flood is
  much higher

                                Source: http://nidm.gov.in/default.asp

Flood events increased 10-folds during 1980-2009
  i.e. Total 395 events; 184 events (Floods)

Causing major damage to:
      1. Property (human, housing, industrial)
      2. Productivity (agriculture, industry)
      3. Infrastructure (road, bridge)
Therefore, Flood Prevention, Mitigation, Management
measures are MUST! and              MOST- URGENT!!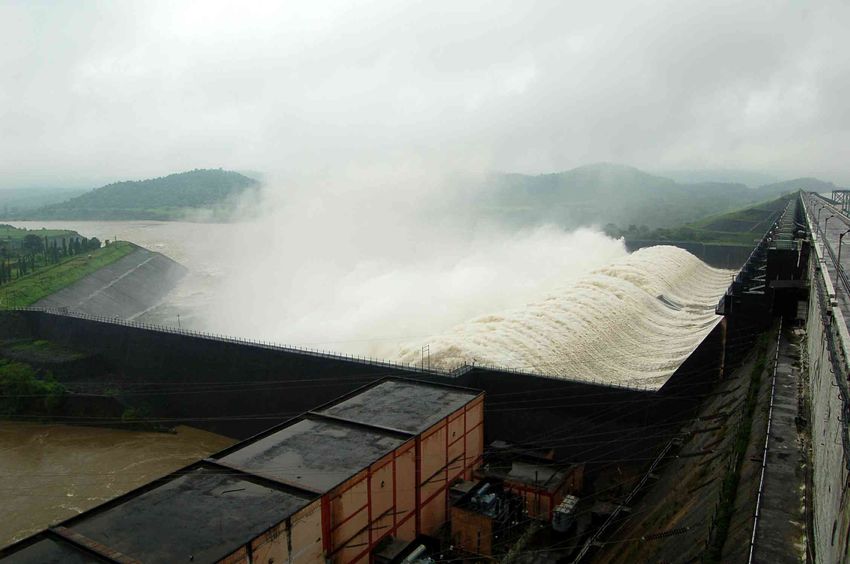
Flood Events-2017 (India)
Date        Country     Event         Number of victims and
                                      amount of damage
2.7.‒30.7   Assam,      Floods caused 156 dead
(July)      Arunachal   by heavy      INR 23bn (USD 360m)
            Pradesh,    monsoon       total damage
            Nagaland,   rains ‒
            Manipu      precipitation
                        driven floods
20.7.‒31.8 Gujarat      Floods caused 224 dead
                        by heavy      INR 20bn (USD 313m)
                        monsoon       total damage
                        rains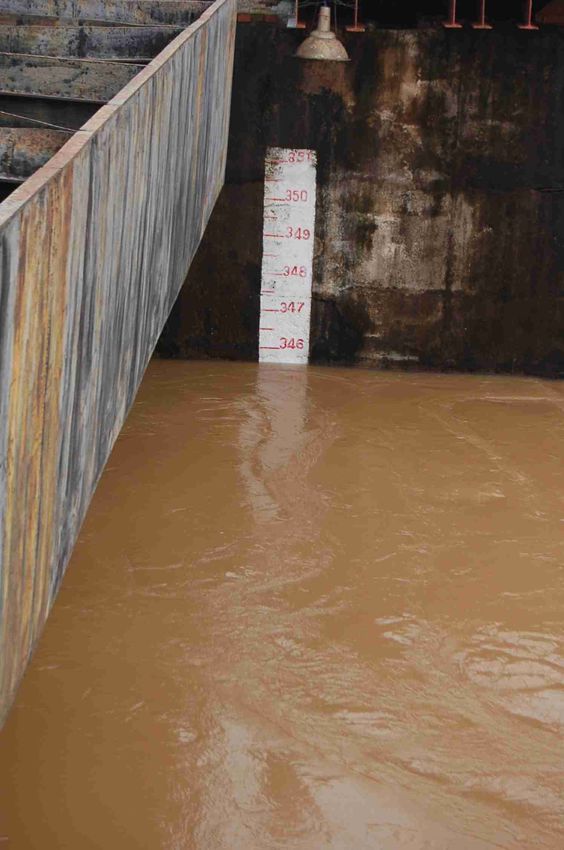
Flood Events-2017 (India)
Date     Country      Event           Number of victims and
                                      amount of damage
31.7.‒3.8 India       Floods caused   58 dead
          West        by heavy        25,000 homeless
          Bengal,     monsoon rains   INR 7.8bn (USD 122m)
          Jharkhand   ‒ 7868 houses   total damage
                      destroyed, 44
                      361 houses
                      damaged, 1
                      059
                      000 ha of
                      cropland
                      flooded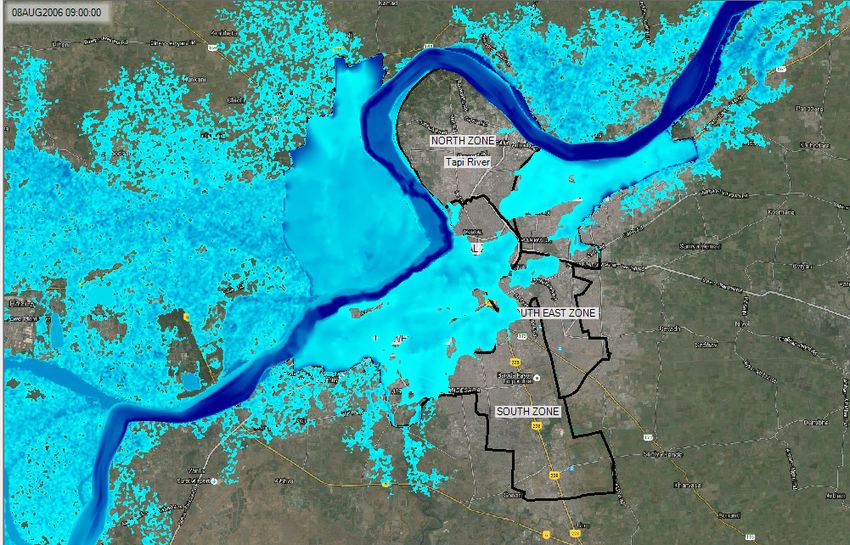
Flood Events-2017 (India)
Date       Country    Event        Number of victims and
                                   amount of damage
12.8.‒26.8. Araria,   Floods       514 dead
            Jogbani   caused by    INR 100bn (USD 1.567bn)
            (Bihar)   heavy        total
                      monsoon      damage
                      rains
                      in Bihar ‒
                      River
                      Gandak
                      burst its
                      banks in
                      8 points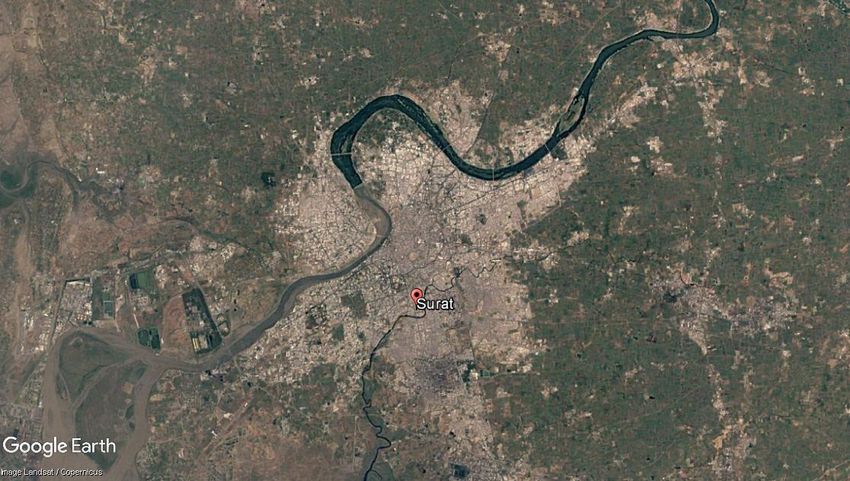
Flood Events-2017 (India)
Date      Country   Event       Number of victims and
                                amount of damage
29.8.     Mumbai,   Flash flood 14 dead
          Thane,                INR 5bn (USD 78m)
          Palghar               insured loss
                                USD 300m (USD 300m)
                                total damage

   Total : 5 Floods; 966 dead; USD 2662 million
        [Loss of 1,77,34,24,40,000.00 INR]

                            http://www.swissre.com/library/editors-pick/sigma_1_2018_en.html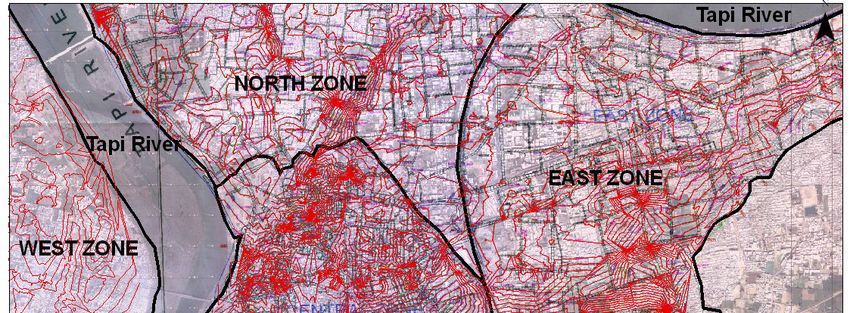
Types of Floods
Flood Assessment Models
•   MIKE 11, MIKE-SHE, MIKE-FLOOD
•   LISFLOOD-FP
•   HEC-RAS, HEC-GeoRAS, RAS Mapper (Free)
•   FLOW 2D
•   FLOW 3D
•   TUFLOW (Classic and GPU)
•   InaSAFE (http://inasafe.org/)
•   TELEMAC-2D
•   FEMA Flood Maps
HEC-RAS Hydrodynamic Modeling
   1D Modeling    2D Modeling
HEC-RAS Hydrodynamic Modeling
         1D/2D Coupled Modeling
1D Modeling • Step-1: Geometry Preparation
1D Modeling

• Step-1: Geometry Preparation
1D Modeling

• Step-1: Geometry from (HEC-GeoRAS)
Digital Elevation Model (DEM)
• SRTM DEM (30 X 30 m) (Free)
  (https://earthexplorer.usgs.gov/)
Digital Elevation Model (DEM)
• AW3D
  (http://www.aw3d.jp/en/products/)

        (5 X 5 m)              (1 X 1 m)
Digital Elevation Model (DEM) • UAV or Drone base Surveying (30 cm x 30 cm)
1D Modeling

• Step-2: Boundary Condition
1D Modeling

• Step-3 : Run the Model
1D Modeling

• Step-4 Out put
1D Modeling

• Step-4 Out put

                             1. Q total
                             2. W.S. Elev.
                             3. Crit W.S.
                             4. E.G. Elev.
                             5. E.G. Slope
                             6. Vel. Chnl
                             7. Flow Area
                             8. Top Width
                             9. Froude Chl.
1D/2D Coupled Modeling • Step 1 : Generation of 2D Geometry (DEM)
1D/2D Coupled Modeling

• Step 1 : 2D Flow Area Computation Points
  (DEM)
1D/2D Coupled Modeling

• Step 2 : Boundary Condition

                                1D

                                2D
1D/2D Coupled Modeling • Step 3: Run the Model
1D/2D Coupled Modeling

• Step 4: RAS Mapper (Out Put)
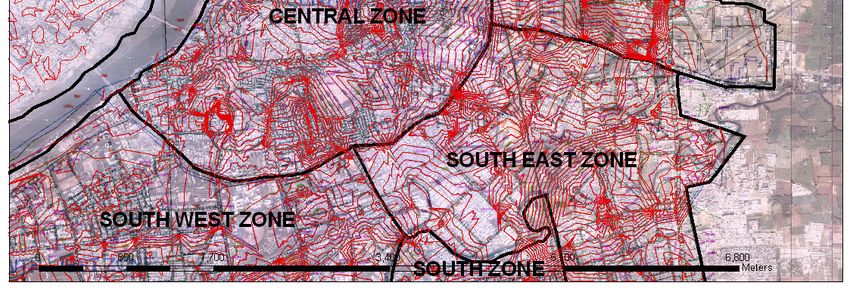
Case of Surat City
Study area : Lower Tapi Basin-Surat City
Down stream of Ukai Dam
 Tapi River Reach                     Ukai Dam                      Surat
North West India               Flood control            7th largest city in India
Ukai Dam to the                Year completion: 1972    Area: 326 km2
Arabian Sea                     Max. Spill 46,270 m3/s   Population: 6.2
120 km                          PMF: 59, 920 m3/s       million

              Surat City                                               Ukai Dam
                                        Tapi River
Sea

Source: Google.maps.co.in
Upstream of Ukai Dam
Catchment area: 62,000 km2
90% of the annual rainfall is received during the monsoon
months (June to October)
Average annual rainfall: 830 mm
Lower Tapi Middle Tapi Upper Tapi
Basin Basin Basin
Surat Ukai
Arabian Sea
•5 major floods since the construction of the dam (1972)Ukai Dam:
M F L 106.98m ( 351ft)
F R L 105.15m (345ft)
Water spread Area = 600 Km2
Live Storage = 7369Mm3
Section
25768 m3/s P.M.F :59747.9 m3/s
PlanFinal Jury
Ukai Dam
42,617
Constructed 63,87,000
Surat, 1984
25,768 Area 112 Sq.
Km
Average Flood 12,256 6,42,000
2,36,000
Ukai Dam Constructed in
1972
1968 1972 19 20 20
98 06 13
Peak Floods Each Year
Surat, 2013
Area 326 Sq. km
Source: Sumiran, 2018, CEPTPerformance of Ukai Dam (1972-2017)
Surat city : Surat city affected by Catastrophic flood in year of
1959,1968, 1978, 1979, 1994, 1998, 2006, 2013
Population : 6.288 million people Rural area and Surat citySurat Flood 2006
Ukai Dam Release 2006 flood
Flood Warning level
- Intense Rainfall in the Tapi Catchment
- Reservoir Level Max. 105.32 m (345.5 ft.)
- Dam release near 25,768 m3/s (9.1 lakh Cusecs)
- Channel capacity near Surat city 11,326 m3/s (4.0 lakh Cusecs; Ref. SMC )
- Hope Bridge Gauge level 12.5 mHydrograph:2006
25768 m3/s (910000 ft3/s)FRL:105.32 m (345.5 ft)
Section at Hope Bridge
Water Spill             Gauge Level 12.5m (25768 m3/s)             Water Spill

                                                         Left Bank R.L. 8.34 m

                             Gauge Level 0.0m
Right Bank R.L. 7.5 m

                                                Bed Level -3.10m
Nehru (Hope) Bridge of Surat City West Zone of Surat City
Swaminarayan Temple H.F.L Marking at West Zone
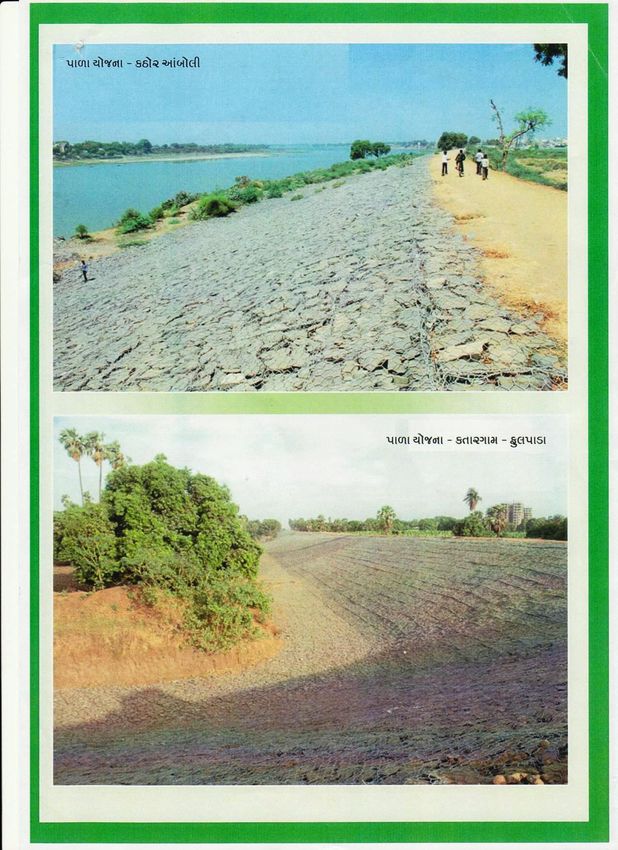
H.F.L.Levees after 2006 Flood
• Total 11,558 and 8,700 m bank protection work completed
• Approximate INR 125.60 Crores (~1250 Million)
• Total 3920 m flood retaining wall completed
• Approximate INR 37.15 Crores (~ 370 Million)
• 16.55 m to 21.21 m (Right RLs); 16.00 to 18.40 m (Left RLs)
• Gauge Level 12.5 m at Hope Bridge in 2006 Flood
Levees StructuresObjectives Strengthen the flood resilience at Surat City requires: 1. To develop 1D-2D coupled hydrodynamic model for urban coastal flood inundation mapping. 2. To investigate the characteristic of 2D flow velocity in urban floodplain. 3. To explore the significant of Tide cycle effect on urban coastal flooding. 4. To develop Emergency Action Plan (EAP)
Methodology
Use of HEC-RAS 5.0.3 1D/2D coupled flow model to Simulate flooding in Surat City

Stage 1: Model the flow of water (Ukai Dam to Sea) 1D Analysis

Stage 2: Model the flood inundation at Surat (With and Without levees) 1D/2D Couple

Stage 3: Model the influence of Tide

                  Surat City
                                                                                   Ukai
                                                                                   Dam

Stage 3                  Stage 2                                   Stage 1

    Arabian
       Sea
Methodology
HEC-RAS 5.0.3 Model
1. Open Source Model
2. Low Computation demand
3. Low data requirement
4. Water is routed over landscape in the X and Y direction (2D) from the raster cell to cell
using simplification of the shallow water equation
5. HEC-RAS is storage cell model, where a Digital Elevation Model (DEM) represents the
landscape and Water is stored at the raster cell locations.Stage 1: Modeling Ukai Dam to Surat 1D Modeling 1. 120 km river stretch from Ukai Dam to Arabian Sea 2. 299 cross-section after 2006 flood Upstream Boundary 3. 150 m apart 4. 5 m chainage
Stage 2: Modeling Flooding in Surat
1D/2D Coupled Modeling

1.   30 m SRTM DEM for LTB
2.   0.5 m contour interval, 5m DEM of Surat city
3.   299 cross section, 5 m DEM for Lower Tapi River
4.   Levees and Retaining wall

DEM of Tapi river 5*5, Surat 5*5, SRTM 30*30   0.5 m interval contours superimposed on SRTM
Flood Inundation
Gauge level +DEM= Inundation ( Risk assessment)

 13/12/2007
Stage 3: Modeling Flooding in Surat
   Tidal Input for D/S Boundary

                                  Flood scenario with Levees

 Downstream Boundary
Surat City Flooding- 1D
Velocity-Slope Curve
Surat City Flooding: 1D/2D Coupled
Discharge : 9998 m3/s    Discharge : 23038 m3/s   Flood inundation map
                                                  Represent the
                                                  Maximum water depth
                                                  At each DEM location

Discharge : 23980 m3/s   Discharge : 25770 m3/s
Animation (Flood Inundation)
Flood Inundation Map Superimposed on
Google Earth Image
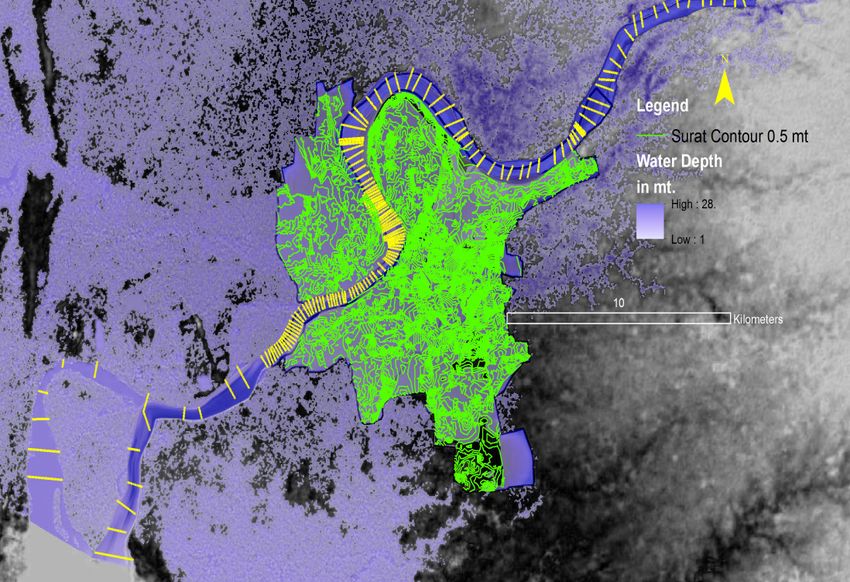
Maximum Water Depth map for Ukai Dam, Lower Tapi BasinWSE and Depth Map • West zone is the low lying area • 4-5 m inundation; release of 25768 m3/s • North Zone is least Maximum Water Surface Elevation map Maximum Water Depth map
Velocity and Arrival Time Map
 • Velocity of water marked 0.5 to 1 m/s
 • 90-95 % of West zone under inundation in 30-33 hrs; Release
   of 14429 m3/s from Ukai Dam.
 • Rander road, Morarji roads and rail network during emergency
   exit or Emergency Action

Maximum Velocity map             Maximum Arrival Time map
Validation
Validation
Limitation
• It is assumed that the hydrological processes like infiltration,
  evaporation and precipitation directly on the river are small and are
  assumed to be neglected. Although the dry soil and heavy precipitation
  at LTB can affect the simulation results.
• The bank protection work located in HEC-RAS model is based on
  Google earth image and expert advice. Although a GPS survey is
  required to find the actual length and position of flood retaining
  structures.
• LU/LC is produced by the help of IRS P6 LISS III data of 2005–2006
  periods; it has significant chances to change the LU/LC in the last
  decade which will affect the roughness coefficient (‘n’) of the
  floodplain. In this condition, it will affect depth, duration, velocity,
  recession and arrival time of the flood.
• Aggradational and degradational features and the related its time
  series analysis for flood inundation mapping are not performed in this
  research because none of the stations are available at D/S of Ukai dam
  on
Conclusions
• Ukai dam and its prepared EAP in preset study is an
  important case study for developing of an EAP for any other
  large dams in India under the DRIP project.

• The HEC-RAS version 5.0.3 is applicable tool to develop the
  Water Surface Elevation (WSE), Depth, Velocity and Arrival
  time map for similar case worldwide.

• Presently, at 14,429.68 m3/s, major zones of Surat city are safe
  against flood inundation. If water rises and accelerates
  gradually then the same inundation conditions will be followed
  as in 2006. It shows that present levees are not enough to fully
  protect the Surat city against 25,770 m3/s release from Ukai
  Dam
Conclusions
• The flood maps overlaid on Google Earth Image is
  efficient techniques to prepare the escape routes thus
  applicable to prepare the detail EAP
References
1.   Agnihotri P, Patel J (2008) Preparation of Flood Reduction Plan for Surat City and
     Surrounding Region (India) International Journal on Transactions on Fluid
     Mechanics:116-125
2.   CWC 2016. Guidelines for Developing Emergency Action Plan for Dams,Government
     of India, Central Water Commission, Central Dam Safety Organisation, New Delhi,
     pp:1-76. (https://www.damsafety.in/ecm includes/PDFs/Guidelines_Developing_EAP_Dam.pdf)
3.   Patel D, Patel I (2002) Flood control operation of Ukai multipurpose reservoir issues
     and need Basin-storming session on application of system techniques for water
     resources management in India–Current Trends & Future Directions:13-31
4.   Patel DP, Srivastava PK (2013) Flood Hazards Mitigation Analysis Using Remote
     Sensing and GIS: Correspondence with Town Planning Scheme Water Resources
     Management:1-16
5.   Patel, DP, Ramirez, JA, Srivastava, PK, Bray, M. And Han, D. (2017). Assessment of
     flood inundation mapping of Surat city by coupled 1D/2D hydrodynamic modeling: a
     case application of the new HEC-RAS 5. Natural Hazards, 1-38.
6.   Timbadiya P, Patel P, Porey P (2014) One-dimensional hydrodynamic modelling of
     flooding and stage hydrographs in the lower Tapi River in India CURRENT SCIENCE
     106:708-716
7.   www.google.com
8.   www.google.earth.com
Thank You Dr Dhruvesh Patel Assistant Professor, Civil Engineering Department Pandit Deendayal Petroleum University (PDPU) Gujarat, India Email Id: dhruvesh.patel@pdpu.ac.in
Ph.D. Opportunity
Opportunity
• Full time Ph.D. at PDPU
  (http://www.pdpu.ac.in/admissions-doctoral.html)

• 25000/- per month (1st & 2nd Years)
• 30000/- per month (3rd Year)
PDPU (Travel Support)
• Office of International Relation (OIR)
• (Visa Fees, Registration, Air Fare)
                                           8-13 April, 2018

                                           EGU-2018

                                           Vienna

                                           Austria
                                           (Central Europe)
International Connection • University of Bristol, UK (Prof. Dawei Han) • University of Cardiff, UK (Dr.Michaela Bray) • IH Cantabria, Spain ( Dr. Cristina) • University of Bern, Switzerland (Dr. Jorge)
www.serbonline.in
  SERB Overseas Visiting Doctoral Fellowship (SERB-OVDF)

• Monthly fellowship amount equivalent to US $
  2000,
• one-time     Contingency    /    Preparatory
  allowances of Rs. 60,000/- to cover visa fee,
  airport transfer charges, medical insurance
  etc.
www.ugc.ac.in/ugc_ic.aspx
          (University Grants Commission)
• International Cooperation Notices
  - Commonwealth Academic Fellowship
  (www.cscuk.dfid.gov.uk/apply/scholarships-uk-citizens/india)

   1) Ph. D. Program (3 years)
   2) Ph. D. Split Program (1 year)
   3) £ 900- 1300
   4) £ 400-500 (For Attending Conference)
www.pmrf.in (PMRF - Prime Ministers Research Fellowship) • Ph.D. program in one of IITs/IISc 1) Full time Ph. D. Program 2) 70,000/- per month (1st & 2nd years) 3) 75,000/- per month (3rd Year) 4) 80,000/- per month (4th & 5th Years) 5) 2,00,000/- per Year (Contingency)
National Connection
• ISRO (Submitted Project on Flood Assessment;
  Under review)
• GUJCOST (Submitted project on Water
  Quality; Under review)
• SERB ( Project under preparation, Flood risk )
• Irrigation Department, Government of Gujarat
Research & Project Opportunity
Useful Website
           (Travel Grant & Project)
•   www.serb.gov.in/formats.php
•   www.inspire-dst.gov.in/faculty_scheme.html
•   www.dst.gov.in/whats_new/advertisements.htm
•   www.csir.res.in/home.asp
•   www.aicte-india.org/ridschemes.htm
•   www.ukieri.org
•   www.ugc.ac.in/ugc_ic.aspx
www.gujcost.gujarat.gov.in (Gujarat Council of Science & Technology) • Research Development-Minor Project - Maximum up to Rs. 10 lacs (3 Years) • Seminar/Symposia/Workshop - Minimum participants: 30 - Maximum days : 5-6 - Grant up to Rs. 30-40/- Thousand
www.serb.gov.in/formats.php
    (Science and Engineering Research Board)
• Start-Up Research grant (Young Scientists)
• Implementation of Project
• International Travel Support (ITS)
• Assistance to professional bodies & Seminars/
  Symposia
• Fellowships (1. Ramanujan Fell. 2. J B Bose
  National Fell.)
www.inspire-dst.gov.in/faculty_scheme.html
(INSPIRE Faculty Scheme)
• Indian Origin
• Ph.D.
• Max. 32 years
• 1000 / year
• Rs 5 lakh per year up to 5 yearswww.dst.gov.in/whats_new/advertisements.htm (Department of Science & Technology) • DST Research Fellowship • Awards/Prizes • Fast Track Young Scientist & Women Scientist Project (Age up to 35 years) • DST International Travel Support - Age up to 35 - Young Scientist (Air fare, Registration Fees, Visa Fees)
www.csir.res.in/home.asp
 (Council of Scientific and Industrial Research)
• Career & Opportunity
  - Junior Research Fellowship
  - International Travel Support (50%)
  - Young Scientist Awards
www.aicte-india.org/ridschemes.htm
   (All India Council for Technical Education)
• AICTE Quality Improvement Schemes
  - Faculty Development Programme (FDP)
  - Career Award for Young Teachers (CAYT)
  - Travel Grant (TG)
  - Seminar Grant (SG)
www.ukieri.org
  (UK-India Education and Research Initiative)
• Innovation Partnerships
• Project & Faculty exchange ( 1 -3 Months)
ConsultancyOpportunity
Consultancy work
• DRIP (Dam Rehabilitation and Improvement
  Project) (5,247 Major dam In India)
• Irrigation Department, GoG
• Gujarat Water Infrastructure limited
• Central Water Commission (CWC)
• Municipal Corporation
• Smart city project India
1D/2D Coupled Modeling

• Step 4: RAS Mapper (Out Put)
You can also read