OREM CITY
OREM PARKS AND RECREATION 2021
←
→
Page content transcription
If your browser does not render page correctly, please read the page content below
OREM CITY OREM PARKS AND RECREATION 2021
SURVEY METHODOLOGY

 ✉      Sampling frame of adults from the Orem City utility database,
        supplemented with likely renters and young residents from the Utah Voter
        File, were invited to participate in the survey via email.

22%
        In total, 11,537 emails were sent to randomly selected households and
        2,548 residents responded. This results in an overall qualified response
        rate of 22%.

± 2.3
        2,548 interviews among a population of approximately 70k adult
        residents (see Orem Utah Census Quick Facts) results in a margin of
        error for the survey of plus or minus 2.3 percentage points.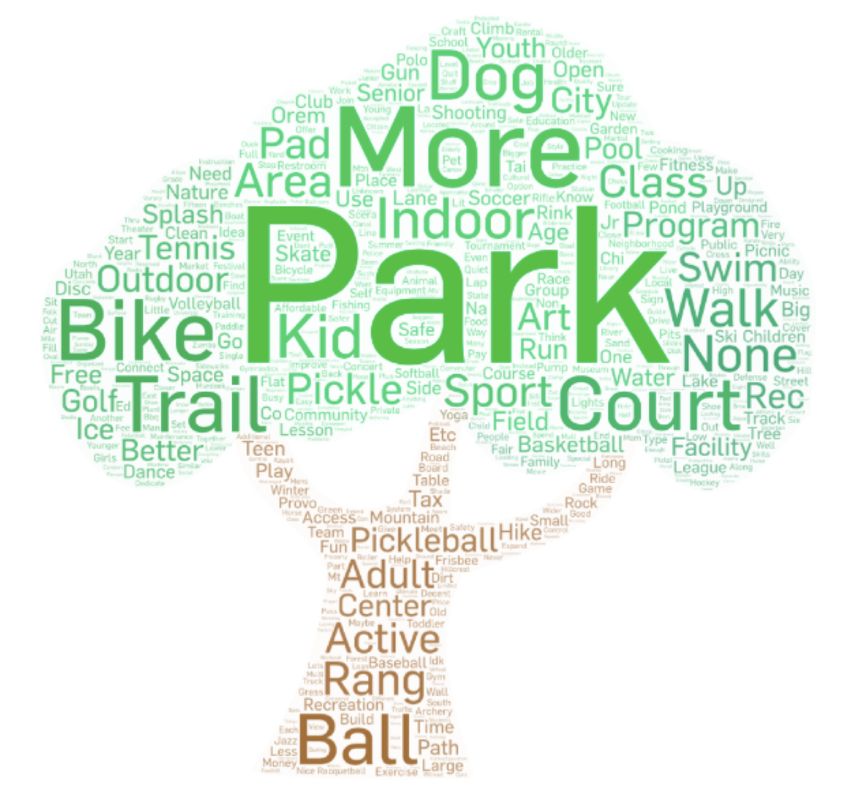
5
         1   Majority of respondents say the CARE Tax should be used
             to “upgrade existing parks”
                 Eighty percent said the tax should be used to upgrade existing parks; 20%
                 expressed interest in using it to build new parks.

         2   Orem Parks usage has recently grown among residents
             and is currently high
                 Nearly two-thirds of respondents said they visit Orem parks at least once a
                 month. Possibly a combination of new pandemic habits, and new arrivals.

         3   Walkability of parks is most important to respondents

                 Parks such as City Center, Bonneville, and SCERA remain popular. To nearly
                 three fourths of respondents, a park’s walkability from their house is ”very
                 important.”

         4   Respondents reported a mix of formal/informal recreation
             facilities usage

                 While pass the ownership rate for the Orem Fitness Center increased from 2017
                 to this year, it remained at 41%. Most respondents reported a mix of doing
                 recreational activities at other facilities and using trails.

         5   City trail usage has also increased so that almost half of
             respondents use trails a few times a month or more often

                 Most respondents use Orem trails either for walking or jogging (63%) or for
                 recreational biking (30%)

FINDINGS TO REMEMBER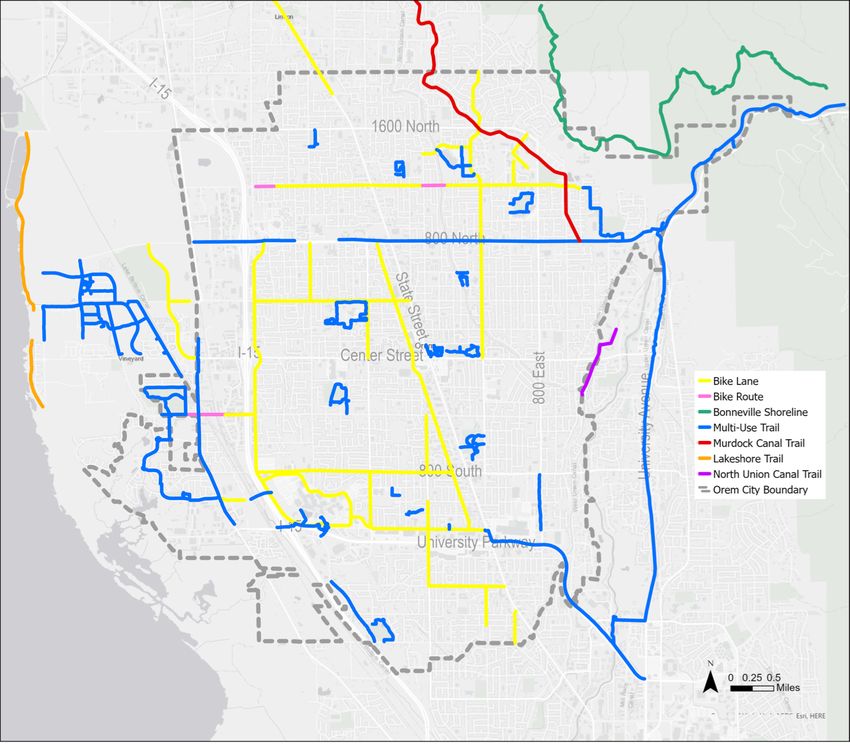
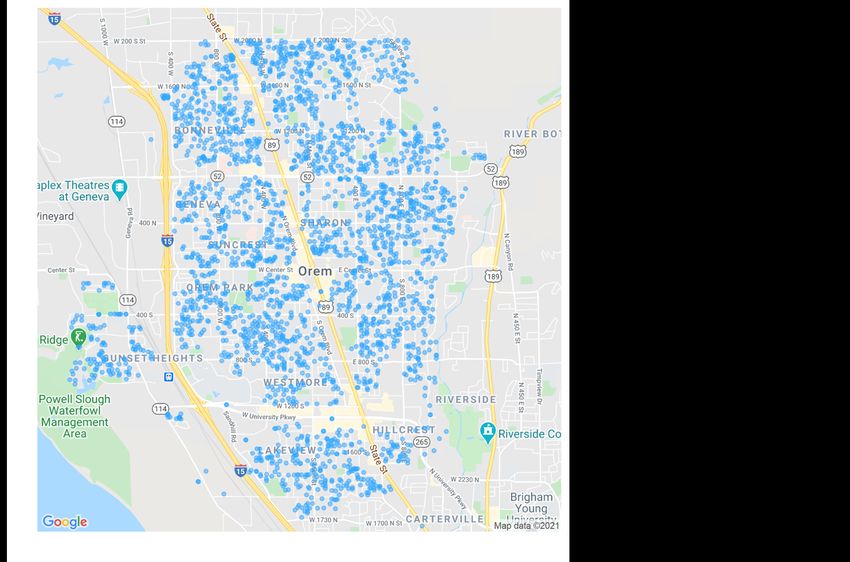
SAMPLE GEOGRAPHIC DISTRIBUTION
Using address information from our sample, we were able to map a rough geographic distribution of our
respondents’ location. While our sample composition is not entirely representative on all factors, our sample does
represent a wide geographic subset of the Orem metropolitan area.

                                                                       From our original sample of
                                                                       11,537, 2,697 opened our
                                                                       invitation email to the survey.
                                                                       Of those, 2,548 responded
                                                                       that they lived in Orem and
                                                                       went on to complete or
                                                                       partially complete the survey.

                                                                       Mapping their responses
                                                                       shows that our sample is
                                                                       geographically representative
                                                                       of the entire Orem area.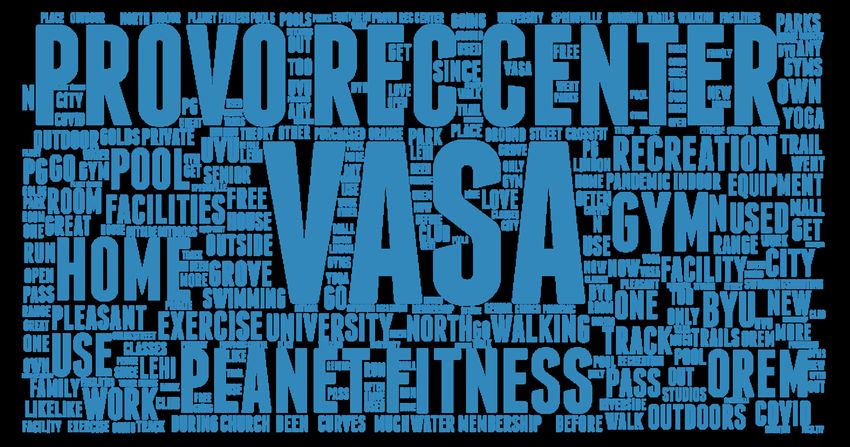
OREM QUALITY OF LIFE
The vast majority of residents still report high levels of life quality in Orem. The average is stead and even slowly
increasing – from 77 in 2015, to 80 in 2017, to 81 in our latest iteration.

Q            “All things considered, on a scale from 0 to 100, with 0 being very low and 100 being very
             high, how would you rate your overall quality of life in Orem?” (n = 2,470)
                                                                                               81

                            % WONG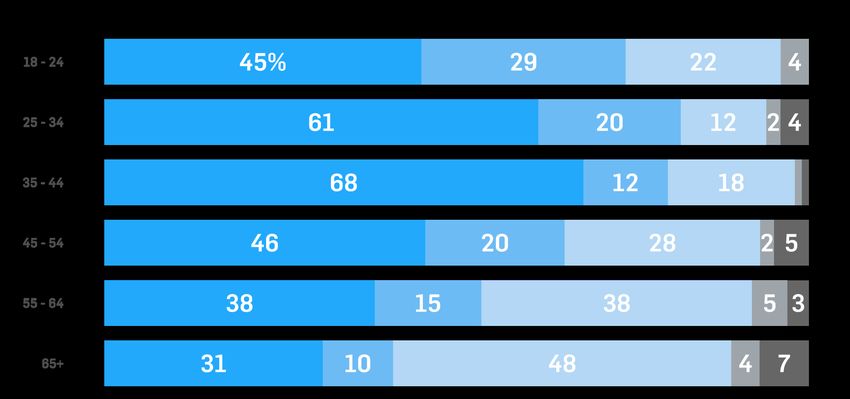
CITY DIRECTION,
   PRIORITIES
CARE TAX OPINIONS
Regarding the CARE Tax, the majority of Orem residents say tax funds would be better used upgrading and
maintaining existing recreational facilities and spaces rather than building new ones. This is consistent with findings
from 2014, when we first studied Orem residents’ preferences for CARE tax spending.

Q            “The portion of the CARE tax dedicated to recreation helps to provide budget for
             spending on parks, fields, and recreational facilities in Orem City. In your opinion, which
             of the following is a better use of the recreation portion of CARE tax funds?” (n = 2,351)

               Upgrading and maintaining Building new parks, fields, and
       existing parks, fields, and facilities facilities

                           % WONG
CARE TAX OPINIONS BY AGE
CARE Tax opinions as reported in the previous slide are mostly consistent across age groups, with the exception of
middle-aged respondents who are slightly more willing to say the CARE tax should be used to build new recreational
Q
amenities. This might be due in part to the fact that they are more likely to be parents.
“The portion of the CARE tax dedicated to recreation helps to provide budget for
spending on parks, fields, and recreational facilities in Orem City. In your opinion, which
of the following is a better use of the recreation portion of CARE tax funds”? (n = 2,351)
Upgrading and maintaining existing Building new parks, fields, and
parks, fields, and facilities facilities
% WONG
18 - 24 25 - 34 35 - 44 45 - 54 54 - 65 65+OREM CITY PARKS
PARK USE FREQUENCY
Nearly 2 in 3 Orem City residents visit city parks at least once a month. This represents a 7-percentage point change

  Q
from 2017.

                “How often do you use or visit Orem City parks?” (n = 2,239)

                                                                                               (+9)

                                                  (-2)

                            %
                                                                    (-5)

                                                                              SHIFT FROM 2017
                                                                              driven in part by decrease in
                                                                              student residents (largely ages
                                                                              18-24), who were most likely to
                                                                              visit parks once a month to a few
                            (+1)
                                                                              times a year; also likely a result
                                                                              of increased outdoor recreation
                                                                              during the COVID-19 pandemic.
PARK USE FREQUENCY BY AGE RANGE
Not unlike the previous iteration, younger residents in general are more likely to use Orem City parks more
frequently. That is especially true for middle-aged residents (likely parents), around 80 percent of which use Orem
Q
parks at least once a month.
“How often do you use or visit Orem City parks?” (n = 2,239)
A few times a month
Once a month A few times a year Once a year Never use or visit
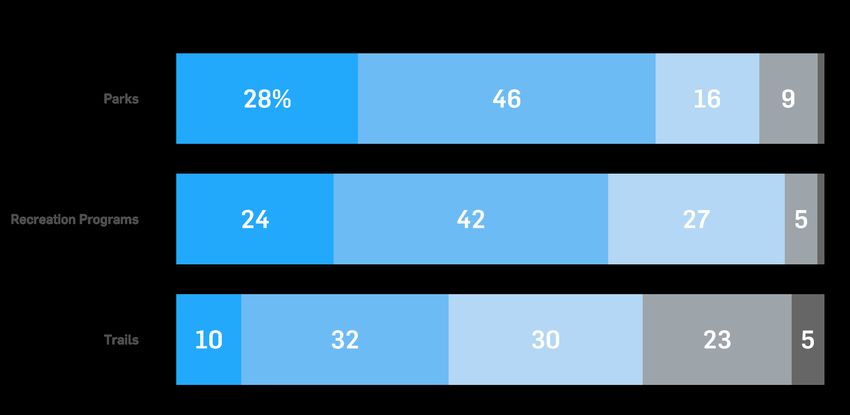
or moreADEQUATE PARKS, TRAILS, & REC AVAILABILITY
A solid majority of residents agree that the city provides enough parks and recreation programs. Only 42% of
residents agree, however, that the city provides enough trails. The number of people who strongly agree that the city
provides an adequate amount of parks has declined since 2017, potentially as a result of the increased park use over
Q
the past year.
“Do you agree or disagree with each of the following statements: the City of
Orem provides an adequate amount of…” (n = 2,244)
Strongly agree Somewhat agree Neither Somewhat disagree Strongly disagree
(-13) (+8) (+8) (+3)
(+1) (+1)
(-4) (+3) (+5)INDIVIDUAL PARK USAGE
The patterns from 2017 have remained relatively consistent with only two noticeable exceptions: Orem Fitness
Center is no longer the most popular recreational facility, and Community Park has also increased significantly in
Q
relative standing, being now more popular than SCERA Park or Nielsen’s Grove.
“Which Orem City park, field, or recreational facility does your household use most often?”
(n = 2,173)
TOP 5
BOTTOM 5PARK CHOICE REASONING
Proximity to a park remains the most important reason residents reported for using the park(s) that they us. The
relative importance of various factors have stayed fairly consistent since 2017.
Q ”What is the most important reason that you use your most utilized park most often?”
(n = 2,181)
(+3)
(+3)
(+1)
(+4)
(+3)
PARTICIPATION
(+1)
(+1)
(+1)
(-1)
(+2)REASONS FOR NOT USING PARKS
A relatively miniscule proportion of residents reported not using parks at all. Still, the solid majority of those
mentioned not being interested or not having the time. But other factors – such as lack of facilities, safety concerns,
Q
or lack of information – were also selected.
”Which of the following reasons best explains why you do not use or visit Orem City Parks?”
(n = 46)
PARTICIPATION
POTENTIAL FOR GROWTH
ATTRACTION VALUE
LONG TERM PROJECTS
GRANT DEPENDENCE
HISTORICAL OR CULTURAL SIGNIFICANCE
GROUP STATUSPARK IMPROVEMENTS
“Restrooms” remains the most commonly-requested improvements to parks, though it is down 3 percentage points
from the 2017 survey. Maintenance/cleanliness upgrades and sports facilities have gained significantly in popular
Q
request since 2017.
“What improvements should be made to your most utilized park? Select up to three”
(n = 2,138)
(-3)
(+2)
(+4)
(+7)
(-10)
(-5)
(+3)
(+3)
INCREASE FROM 2017
in proportion of residents who
specified improvements they
would like to see to the parks
they use or visit most frequently
(i.e., decline in “no improvements
needed” responses).ALTERNATIVE PARKS
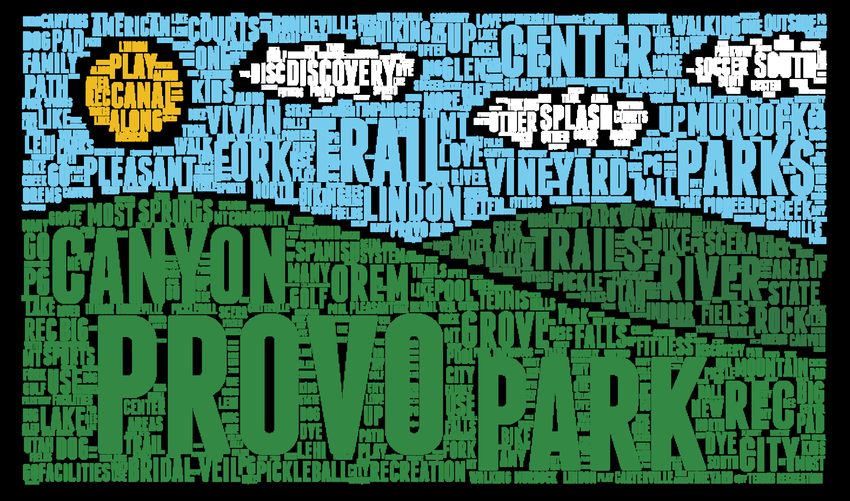
We asked respondents about alternative parks that they visit outside of Orem. Generally, the word Provo came up
most often, but various specific parks in Provo that were mentioned include Vivian Park, Bridal Veils, and certain
Q
trails.
“Which community parks, fields, or recreational facilities outside of Orem if any, do you use
most often for recreation?” (n = 1,448)PARKS THAT OREM SHOULD EMULATE
Below are selected verbatim responses from the question shown below. Various names of nearby parks are
mentioned explicitly, and disparate reasons include shaded areas, places to sit, and accessibility to all kinds of
visitors.
Q “Are there any parks, fields, or recreational facilities in other cities that you think Orem
should emulate? Why?” (n = 1,247)
Provo’s pool and kid Draper dog park, it New There is a park in St George… where the
play area. It beats has good seating Vineyard playground equipment is on the inside
Orem’s even after and is also a more park with of a smaller track. I love that the kids
renovations. It’s not natural-looking dog splash past can play on the playground while the
even close. park like Orem’s. and adults walk around the track- all while
basketball being able to keep an eye on the kids.
courts
Adventure Heights in Spanish
The new
Fork... Even the City Center Park in Spanish Fork has a park
pickleball
Orem, the All Together park, is a more helpful to people with
facility in Trailside Park in Park
good blueprint to follow, with the disabilities. Many would
Spanish City, this park has so
exception that it needs shade and a use them if they were more
fork many amazing things
few more places for parents to sit. available. to offer the
community and help
No, I like Orem's parks ...
My kids love a park up in Bountiful
Murdoch Canal or any promote healthy
called Creekside Park. The water
they are well cared for features are really fun in the summer, other separate from lifestyles.
but year round the trails they've built
and easily accessible among the trees is incredible.
automobile trafficWALKING DISTANCE OF PARKS
Most residents still say that having a park within walking distance is at least ”very” if not “extremely” important. This
proportion has in fact increased by 14 percentage points since 2017.
Q “Thinking more generally, in your opinion how important is it to have public parks within
walking distance of your home (i.e. within half a mile or 10 minutes)?” (n = 2,104)
72%
of respondents said having a
park within walking distance is
”very”, if not “extremely”
important (+14 since 2017)OREM FITNESS CENTER & RECREATION
RECREATIONAL IMPROVEMENTS
Respondents could only select one option, and over a third selected improving trails and trail amenities. Building
additional outdoor sports courts was also selected by 1 in 5 respondents. Many of the response options were new, but
we have shown changes from the 2017 survey results where applicable.

Q            “If Orem were to provide upgraded or expanded recreational opportunities and you had to choose
             just one, which of the following options would you prefer?” (n = 2,259)”

                                                   (+4)

                                           (-1)
HOUSEHOLD RECREATIONAL ACTIVITIES
Children have higher participation rates in general in recreational activities (especially in organized sports), but
activities such as weightlifting, yoga, shooting, aerobics, and golf appear to be more popular among adults.
Pickleball and skiing, while popular among a smaller proportion of respondents, are the activities with the most
Q
participation parity for all ages.
“For the adults in your household, what sports or other activities do they regularly do for exercise or recreation? Please select
all that apply.” (n = 1,808)
“For the children under 18 in your household, what sports or other activities do they regularly do for exercise or recreation?
Please select all that apply.” (n = 828 respondents with children under 18 in household)
Adults ChildrenFITNESS CENTER [FORMER] PASS OWNERSHIP
Ownership of Fitness Center passes has increased significantly – by about 17 percentage points since our 2017
survey. Though the question text does not tease out the distinction between current and past usage of the fitness
center, it is encouraging that the enthusiasm and market for fitness center usage has increased.
Q “Do [or did] you have a pass to the [former] Orem Fitness Center[, either prior to the
facilities being closed for renovation or to access the temporary fitness facilities while
the Orem Family Fitness Center was being completed]?” (n = 2,099 in 2021 survey)
Yes NoUSAGE FREQUENCY
The significant change in Orem Fitness Center usage from 2017 to now is born out in this frequency question. The
proportion of those who use (or used) the Fitness Center multiple times a week has tripled, and the proportion of
Q
those who say they visit a few times a year or less frequently has shrunk considerably.
How often did you use or visit the former Orem Fitness Center? (n = 933)
(+24)
(+14)
(-20)
(-31)
(+4) (+6)
(-2)NON-PARTICIPATION REASONS
Similar patterns of reasons given appear in this survey as with 2017; namely, lack of interest, or admission fees. Aside
from these, certain “Other” reasons persist, including the Fitness Center being too busy, that a respondents had only
recently moved to Orem, or would rather exercise outside.
Q
“Which of the following reasons best explains why you did not use the former Orem Fitness
Center?” (n = 1,148)
“OTHER” REASONS
INCLUDE
“Too busy/crowded”
“Only recently moved to Orem”
“Would rather exercise outside”ALTERNATIVE FITNESS CENTERS
When asked about alternative fitness centers that residents use instead of the Orem Fitness Center, a mix of formal
and informal options were brought up. Among formal fitness centers, VASA, the Provo Rec Center, and Planet
Q
Fitness were mentioned most often. People also mentioned their own homes, trails, and personal fitness regimens.
“Which gym or fitness facility other than the Orem Fitness Center, if any, do you use most
often?” (n = 1,687)PLANNED FUTURE FITNESS CENTER USAGE
We asked about planned future fitness center participation once the center is open for use. Swimming remains the
most popular option as was observed in 2017. Indoor track, cardio exercise, and weight training have all grown in
Q
relative popularity, even above certain sports that used to be popular on this ranking.
“Which fitness/recreation activities do you or members of your household plan on participating in
once the new Orem Family Fitness Center is open for use? Select all that apply.” (n = 824)
“Have you purchased, or do you plan to purchase a pass to the new Orem Family Fitness Center for the
grand re-opening of the remodeled facilities in March?” (n=2,055)
61% No
10% Yes: have purchased
29% Yes: plan to purchaseCITY TRAIL USE
OVERALL USAGE
Almost half of respondents used Orem trails a few times a month or more. Only 3% never use or visit Orem trails.

Q            How often do you or members of your household use trails in Orem? (n = 2,239)

                                                        INCREASED TRAIL USE FROM 2017
                                                        here again we see the impacts of the rise in outdoor
                                                        recreation during the COVID-19 pandemic, with two-
                                                        thirds of residents indicating that they use trails in
              (+17)                                     the City at least monthly.

                                                          (-7)

                                    (+7)

                                                                                (-2)                 (-12)
REASONS FOR TRAIL USE
The Provo Canyon Trail and Murdock Canal Trail are the most-used trails for Orem residents. A majority of
Q
respondents use trails for walking, and 30% use them for recreational biking.
Which Orem trail or bike path do you use most often? (n = 1,595)
Which of the following reasons best explains why you use the trails in Orem? (n = 1,656)WHY RESPONDENTS DON’T USE TRAILS
Of those who do not use trails in Orem, 7% say it is due to a lack of information about trails.
Q Which of the following reasons best explain why you do not use the trails in Orem? Select
up to three. (n = 394)
“Other” reasons include:
-inability to use trails due to age or
health
-Not knowing where trails are
-Lack of interest in trailsTRAIL TYPE PREFERENCE
Residents generally prefer more natural surface and asphalt trails. 44% of residents say Orem has enough concrete
Q
trails.
Please indicate whether you would like Orem to increase the number of each of the
following types of trails in the city, or if you think the current number of each type of
trails is sufficient. (n = 1,753/1,817)
Orem has enough of these trails Orem needs more of these trails Orem has too many of these trails
(-15) (-8)
(-7)
%
(-8)
(-10)
(-1)
(-2) (-1) (+0)NEW TRAIL PREFERENCE
Almost an equal proportion of respondents want new trails for recreation to be added along the North Union Canal
Q
and Bonneville Shoreline trail systems. 19% had other ideas of where to put new trails.
If Orem were to increase the number of trails for recreation in the city, where would you
most like to see new trails added? (n = 1,646)
42%
Extend the North Union Canal trail system
39%
Extend the Bonneville Shoreline trail system
19%
Other, including requests for bike paths, trails
connecting existing trails to neighborhoods, and
the expansion of the Lakeshore and Murdock
Canal trailsTRAIL IMPROVEMENTS
Trail connection, using trails to link neighborhoods, and restrooms stand out as the primary trail improvements
Q
residents desire.
Which, if any, of the following improvements should be made to the trails in Orem?
Select up to three. (n = 3,338)
(-8)
(-9)
(-5)
(-10)
(-3)
(-3)
(-2)
(-1)
(-2)
(-3)
(-6)
(+0)
(-5)
(-3)TOTAL FUNDING ALLOCATION
Residents’ preferences are to upgrade walking and bike trails in addition to funding existing parks and playgrounds.
Q
Athletic fields for games and practice are the least-supported amenities.
Suppose you had $100 to spend on additional parks, recreational programs, facilities, or
trails in Orem. How would you divide your $100 among the various projects, exhibits,
events, and performances that could be funded? (n = 1,905)
% >$0
(+7.52) 62.4%
(+8.42) 56.3
(-1.88) 35.6
(+2.65)
34.4
(+5.87) 29.6
(+2.95)
25
(+2.25)
27.2
(+1.22)
21.7
(+0.03)
10.8NEW ACTIVITY PREFERENCE
Top words mentioned by respondents include “park,” “trail,” “bike,” and “court.”
Q Please suggest up to five (5) recreational activities, programs, or facilities not currently
offered by the City that you feel are most needed in the Orem community. (n = 2,079)
“More bike
lanes or multi- “More dog parks or
use sidewalks” dog-friendly
sections of parks”
“Big ,open,
quiet natural
spaces” “More indoor
sports facilities
for winter
“More pickleball time”
courts”DEMOGRAPHICS
RESPONDENT DEMOGRAPHICS
  A majority of survey respondents are white. 68% of respondents either have a four year college degree or post
  graduate degree. Only 6% of respondents fell in the 18-24 year old age group.

                    RACE (n = 1,826)
                                                                                  GENDER (n = 1,839)
         White                                            91%

       Hispanic         5                                                                                  52% Male

          Asian     2                                                                                      47% Female

Pacific Islander    1                                                                                      1% Other

          Other         3

                   0% American Indian / Native American
                   0 %Black / African American
                                                                                  AGE GROUPS (n = 1,772)
                                                                                    22
                                                                                            20                          20
                            EDUCATION (n = 1,827)                                                   17
                                                                                                               15
                High school graduate 3%
                       Some college 15
                                                                           6%
              Two year college degree 11
             Four year college degree 42
                Post graduate degree 26
Vocational school or technical school 3                                  18-24    25-34   35-44   45-54     55-64      65+
RESPONDENT DEMOGRAPHICS
Over half of respondents are employed by someone else. 79% are either married or living with a partner. 12% are
making less than $40,000 per year, and 37% are making over $100,000. Compared to 2017 data, our updated panel
recruits are significantly less likely to be student residents. This is a direct function of our sampling frame.
EMPLOYMENT STATUS (n = 1,830)
MARITAL STATUS (n = 1,812)
Employed by someone else 55%
Retired 19
Self-employed 14 79%
Homemaker 8 of respondents are
Unemployed 2 married or living
INCOME (n = 1,692) Student 2 with a partner
21%
of respondents are
either single,
widowed, or
divorcedRESPONDENT DEMOGRAPHICS
86% of respondents own or are buying their own home. 31% of respondents have lived in Orem for over 30 years,
while 23% have lived in Orem for less than 5 years. Half of respondents live in households without kids under 18.
OWN VS. RENT (n = 1,859)
86% Own or buying home
8% Renting home or
apartment
5% Living with parents or TIME LIVED IN OREM (n = 1,855)
otherwise rent free
1% Other
CHILDREN IN HOUSEHOLD (n = 1,844)
51%
12 12 12
4 5
Zero One Two Three Four FiveKyrene Gibb | Partner, Vice President of Research
kyrene@y2analytics.com | 801.406.7877You can also read