Warehouse and Distribution Centres: 2018 Best Practice - Avery Weigh-Tronix
←
→
Page content transcription
If your browser does not render page correctly, please read the page content below
Warehouse and Distribution Centres:
2018 Best Practice
Discover the latest industry trends and find out how to improve
your key metrics
Stewart Campbell, Avery Weigh-Tronix

Read this whitepaper to discover:
»»   The latest trends and challenges within warehouse and distribution centres
»»   The top 10 metrics keeping warehouse managers up at night
»»   Industry benchmarking – how your performance compares to other DCs
»»   How to improve your key performance metrics (including order picking accuracy,
     contract employees to total workforce, and on-time shipments)
»»   The latest innovations within the warehouse and DC industry
»»   How to combat the trade-off between effectiveness and efficiency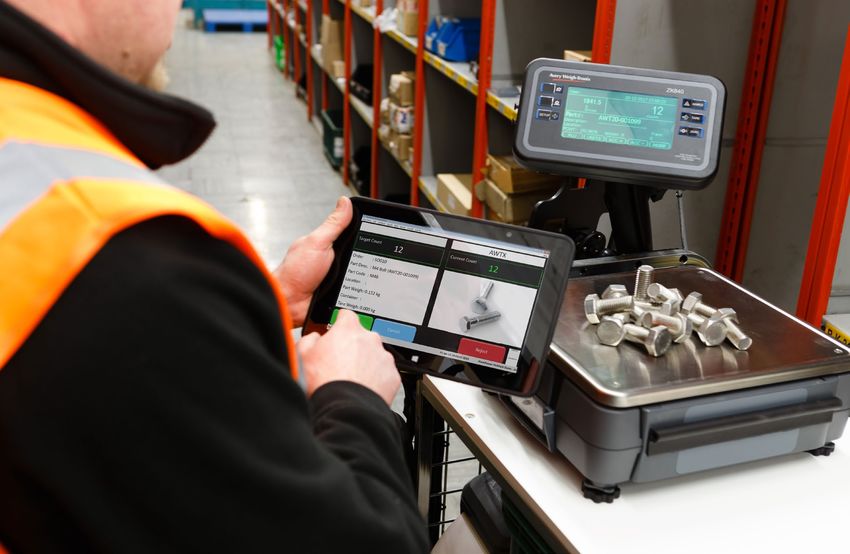
Introduction
Warehouses and distribution centres (DCs) play a key part in the supply chain. However, in such a fast-paced
environment it can be challenging for warehouse managers to continually deliver successful performance figures
against key metrics.
This whitepaper delves into the common metrics used within warehouses and DCs, and offers advice and guidance
on how these metrics can be improved.
The whitepaper references data from the ‘DC Measures 2018 Trends and Challenges’ report, written by the
Warehousing Education and Research Council (WERC). The purpose of the WERC report is to provide an annual
snapshot which shows how warehouse and DC practices are changing. The report surveyed warehouse and DC
professionals to determine their performance levels and common trends and challenges within the industry.

Warehouse and distribution centres: 2018 trends and challenges
Each year brings the industry a new set of trends and challenges, and 2018 was no different. The four major trends
identified by the WERC report in 2018 were performance gaps, lack of consistency, technology opportunities and
people development.
Performance gaps                                               Technology opportunities
The biggest trend identified was the closure of                Technology within the supply chain is becoming
performance gaps between ‘best-in-class’ performers            increasingly important. Many companies are starting
(respondents with performance in the highest quintile)         to focus more on digital transformation, with
and ‘major opportunity’ performers (respondents with           respondents planning to implement social media,
performance in the lowest quintile).*                          mobile technologies, cloud-based services and big data
                                                               practices.
Best-in-class performers have reached their plateau of
productivity, and it will now cost more, take                              However, there is still a way to go to improve
more resource and require more risk                                            on technology as the study found 35%
taking to continue to improve.                                                     of distribution centres don’t use a
                                                                                      warehouse management system
Whereas major opportunity                                                                (WMS) and 25% don’t use
performers found it easier to                                                             barcode scanners!
improve their practices and
make themselves more
competitive in the market.
                                                                                                   People development
Lack of consistency
                                                                                                 People continue to be
Many respondents have                                                                            the driving force behind
struggled to consistently                                                                       the supply chain and
maintain performance                                                                           not surprisingly, strong
on most of the measures                                                                       performance results came from
within the survey (best-in-                                                                 the companies who invested in
class respondents saw a 50%                                                               and focussed on their people first.
performance decline from 2017).
                                                                                 A further trend was found within
Reasons for such a decline include a lack of                               UK warehouses where managers were
basic technologies, issues with speed and accuracy, and        concerned over the poor availability of labour as a direct
the lack of capital resources to invest in critically needed   result of Brexit.
infrastructure.
Consistency is key, and to drive it warehouses and DCs
need to focus on continuous improvement processes to
                                                               *For more information on quintile performance, see page 4
maintain their performance levels. Failure to do so can
lead to a ‘see-saw’ effect, where management’s struggle
between time and resource can see performance
statistics improve in one area while dropping in another.

                                                          2
The top 10 metrics keeping warehouse managers up at night
Unsurprisingly, different warehouses and distribution centres each employ a different set of metrics to monitor their
performance. The respondents in the WERC report listed a total of 34 metrics used to measure their performance
levels.

Table 1 displays the top 10 metrics being managed in                        Interestingly, contract employees to total workforce
warehouses and distribution centres and how these                           jumped from the 48th place in 2016 to the 4th top metric
have changed since the 2016 study. The top three                            in 2018, perhaps unsurprising given the current shifting
metrics - average warehouse capacity used, order picking                    demographics within the UK workforce and the effects
accuracy and peak warehouse capacity - indicate that                        of Brexit impacting on the availability of labour.
capacity and quality are currently taking priority for
warehouse managers.

            Top 10 metrics                                                            2018        2017         2016
            1. Average Warehouse Capacity Used                                          1           1            2
            2. Order Picking Accuracy (percent by order)                                2           2            3
            3. Peak Warehouse Capacity Used                                             3           4            7
            4. Contract Employees to Total Workforce                                    4           7           48*
            5. On-time Shipments                                                        5           3            1
            6. Overtime Hours to Total Hours                                            6           6           45*
            7. Part Time Workforce to Total Workforce                                   7           5           46*
            8. Cross Trained Percentage                                                 8          12           49*
            9. Annual Workforce Turnover                                                9          25           20
            10. Inventory Count Accuracy by Location                                   10          10           19
           *In 2016, the total number of metrics in the study totalled 55                                       Table 1

                                                                       3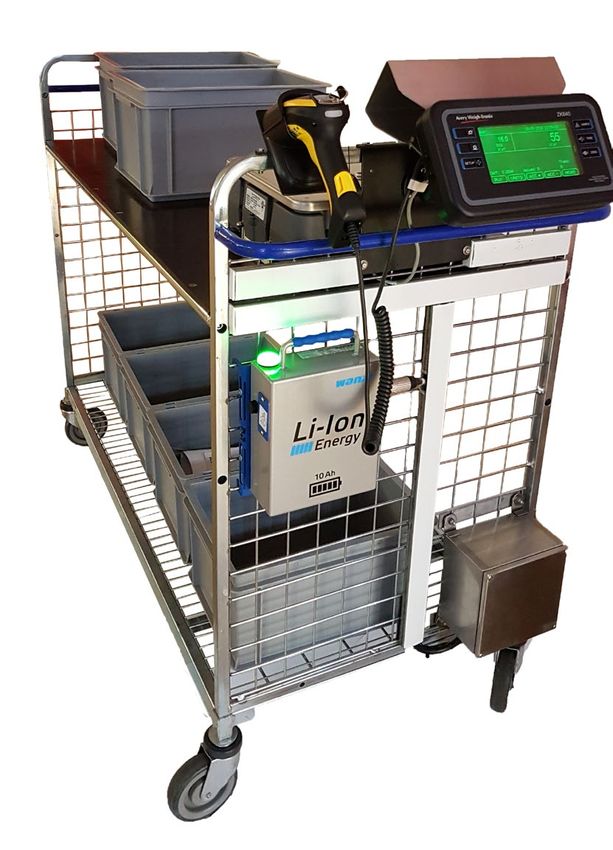
Benchmark your performance
Do you know how your performance compares to other warehouses or distribution centres?
Table 2 displays industry benchmarking data from the results of the WERC report. The data is reported using a ‘quintile’
format which presents the results on a five-point maturity scale; from ‘major opportunity’, through ‘disadvantage’,
‘typical’, ‘advantage’, and finishing on ‘best-in-class’. The position on the maturity scale reflects where the respondents
are situated in their journey towards best practice.
How to use the data
Use the data in table 2 to benchmark your company                         However, if on-time shipments are above 99.8% then this
performance against other warehouses and DCs – all                        would fall within the top quintile of the results and can
you need to know is your performance figures for each                     be considered best-in-class.
metric.
                                                                          The median performance for on-time shipment data is
For example, if your on-time shipment performance is                      98.20%.
below 94% then this falls in the bottom quintile (20%)
of the results and would indicate there is a major
opportunity for improvement.

                                             Quintile performance classification for metrics
 Customer Metrics                              Major Opportunity        Disadvantage        Typical      Advantage     Best-in-class    Median
 On-time Shipments                                Less than 94%            >= 94 and        >= 97.56     >= 99 and       >= 99.8%       98.20%
                                                                           < 97.56%        and < 99%      < 99.8%
 Total Order Cycle Time                        Greater than 48 hours     >=24 and < 48     >= 9.8 and    >= 3.76 and    < 3.76 hours      16
                                                                                              < 24          < 9.8
 Internal Order Cycle Time                       Greater than 35.2      >= 18 and < 35.2    >= 5.88       >= 2 and       < 2 hours        8
                                                      hours                                 and < 18       < 5.88
 Outbound Metrics                              Major Opportunity        Disadvantage        Typical      Advantage     Best-in-class    Median
 Lines Picked and Shipped per Hour             Less than 12 per hour    >= 12 and < 26     >= 26 and     >= 47.6 and    >= 92.8 per       35
                                                                                             < 47.6        < 92.8          hour
 Orders Picked and Shipped per Hour           Less than 2.76 per hour     >= 2.76 and       >= 6.08      >= 15 and     >= 35 per hour     10
                                                                             < 6.08         and < 15        < 35
 On-Time Ready to Ship                            Less than 94%         >= 94 and < 98%    >= 98 and     >= 99 and       >= 99.8%        99%
                                                                                             < 99%        < 99.8%
 Capacity/Quality Metrics                      Major Opportunity        Disadvantage        Typical      Advantage     Best-in-class    Median
 Inventory Count Accuracy by Location             Less than 90%         >= 90 and < 97%    >= 97 and     >= 99 and      >= 99.888%      98.40%
                                                                                             < 99%       < 99.888%
 Order Picking Accuracy (Percent by Order)        Less than 98%         >= 98 and < 99%    >= 99 and     >= 99.5 and     >= 99.9%       99.30%
                                                                                            < 99.5%       < 99.9%
 Employee Metrics                              Major Opportunity        Disadvantage        Typical      Advantage     Best-in-class    Median
 Overtime Hours to Total Hours                 Greater than 14.98%        >= 8.76 and       >= 5 and      >= 2 and         < 2%         6.75%
                                                                           = 4 and < 20%      >= 0 and      >= 0 and         < 0%         1.00%
                                                                                              < 4%          < 0%
 Contract Employees to Total Workforce           Greater than 30%       >= 10 and < 30%     >= 0.52       >= 0 and         < 0%         5.00%
                                                                                           and < 10%      < 0.52%
 Perfect Order Index Metrics                   Major Opportunity        Disadvantage        Typical      Advantage     Best-in-class    Median
 Percent of Orders with On-time Delivery         Less than 89.7%          >= 89.7 and      >= 94 and     >= 97.3 and      >= 99%        95.20%
                                                                             < 94%          < 97.3%        < 99%
 Percent of Orders Shipped Complete              Less than 90.2%          >= 90.2 and      >= 96.5 and    >= 98.64       >= 99.5%       97.70%
                                                                            < 96.5%         < 98.64%     and < 99.5%
Table 2

                                                                  4
Improve your performance
How did your performance figures compare to the                How can order picking accuracy be improved?
industry? Did you identify areas for improvement within           »»   Voice-to-pick systems give instructions to the
your operations?                                                       pick operator through a headset. Pick operators
Of course, it’s easy to identify the areas for improvement,            are directed to a location within the warehouse,
but a different story implementing processes and                       where they verify the item’s code before the
practices to improve performance levels.                               item is picked.

The following section of the whitepaper gives advice              »»   Pick-to-light systems work in a similar way
and guidance on how to improve the following metrics;                  to voice-to-pick systems; instead of verbal
                                                                       instructions, they use a light over the correct bin
    »»   Order picking accuracy                                        in the racking system to alert the pick operator’s
                                                                       attention.
    »»   Inventory count accuracy by location
                                                                       Both systems get the pick operator to the
    »»   On-time shipments                                             correct location quickly. However, they do not
                                                                       account for human error and cannot verify the
    »»   Employee metrics (contract employees to                       operator picked the correct quantity from the
         total workforce, overtime hours to total hours,               correct bin.
         part-time workforce to total workforce)
                                                                  »»   Slowing down the pick process to give pick
                                                                       operators more time to spend verifying correct
                                                                       parts and quantities is an option, as speed is a
Order picking accuracy                                                 key factor influencing accuracy. However, this
                                                                       approach has cost implications as businesses
Order picking accuracy has appeared in the top 3 metrics
                                                                       then need to increase labour to cope with the
since 2016, and for good reason.
                                                                       reduced number of picks which is not usually a
Picking the wrong item or miscounting quantities can                   viable option. There is a fine balance between
cost business hundreds of thousands of pounds a                        accuracy and speed.
year in correction costs or contract penalties as well
                                                                  »»   Automation such as robots and carousel
as the negative impact on customer service metrics.
                                                                       systems can reduce human error and increase
After the picking stage, dispatching the wrong order can               efficiency, but automation will not complete the
have an impact on reputation or result in loss of repeat               full picking process and requires huge amounts
business, while dealing with return shipping and the                   of capital expenditure to implement.
resulting customer complaints takes time and money.
These issues have a huge impact on the bottom line of a
business and are usually a result of human error.                  “There is a danger with automation...
                                                                              it is inflexible.”
                                                                   Contract Logistics Solutions Director
  “It costs ten times as much to bring an
   incorrect order back as just to send.”
   Contract Logistics Solutions Director                          »»   There are emerging technologies that
                                                                       combine pick accuracy improvements
                                                                       without compromising on speed. The Mobile
                                                                       Picking Solution has recently been launched by
                                                                       Avery Weigh-Tronix, it brings technology to the
                                                                       point of pick, to eliminate manual counting and
                                                                       verify pick accuracy. It also integrates seamlessly
                                                                       with other pick management systems (such as
                                                                       voice-to-pick and pick-to-light)to make them
                                                                       even more accurate and efficient.

                                                           5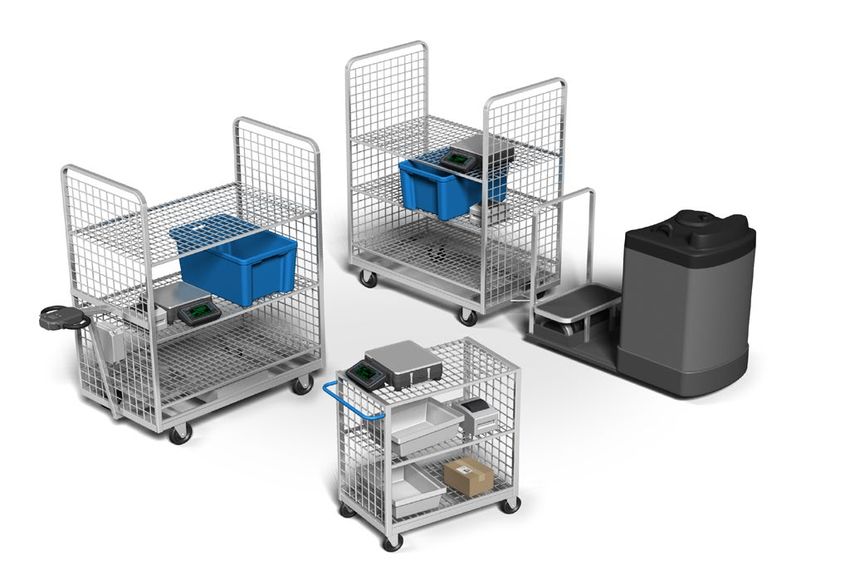
Inventory count accuracy by                                    On-time shipments
location                                                       Recent years have seen a shift in consumer behaviour as
                                                               more people switch to buying online. As order deadline
Managing inventory levels can be a thankless and
                                                               times get later and later but retailers still guarantee
labour-intensive task, but it is extremely important for
                                                               next day delivery, the impact is felt at the distribution
warehouse managers to keep aware of stock levels.
                                                               centre where warehouse managers are tasked to reduce
How can inventory count accuracy by location be                order to dispatch times while maintaining accuracy.
improved?
    »»   Holding inventory audits during scheduled
         shut downs is a common way to keep track                “One of the challenges for us is to try
         of stock levels. However, this method incurs             and improve our pick rate, but at the
         revenue loss during the closed period and can          same time improve our pick rate without
         mean paying overtime rates to employees.              causing service inaccuracy issues, which
    »»   A similar option involves employing IPS               end up in credits, which cost us money.”
         or audit teams who are dedicated to stock               Operations and Commercial Manager
         checking, although this requires an investment
         in people.
                                                               How can on-time shipments be improved?
    »»   Some distribution centres implement
         procedures to verify stock levels as they arrive         »»   Increase pick operator numbers. An increased
         at goods-in, but these procedures don’t count                 workforce means more picks – or does it?
         stock once it’s made it to the racking. They also             With all the HR factors involved with hiring
         don’t solve the problem of miscounts by pick                  new employees, together with expected
         operators.                                                    labour shortages, it’s not always the easy or
                                                                       cost-effective option to add to headcount.
    »»   The Mobile Picking Solution is an innovative
         solution for managing inventory and                      »»   Open regional warehouses. Locally based
         replenishment. It carries the technology and                  warehouses can bring businesses closer to their
         tools required to allow pick operators to                     customer base and make delivery times shorter,
         verify inventory in real time and compare the                 which eases the pressure on the distribution
         results with stock levels within the warehouse                centre. However, investments in property
         management system (WMS), alleviating the                      require huge amounts of planning and capital
         need to have a dedicated audit process or                     expenditure.
         take time out for wall-to-wall stock checks.
                                                                  »»   The Mobile Picking Solution improves
                                                                       on-time shipments by reducing mistakes at the
                                                                       point of pick. The system delivers a minimum
                                                                       achievable accuracy of 99.75% while
                                                                       increasing average picks per hour by 10%.

                                                           6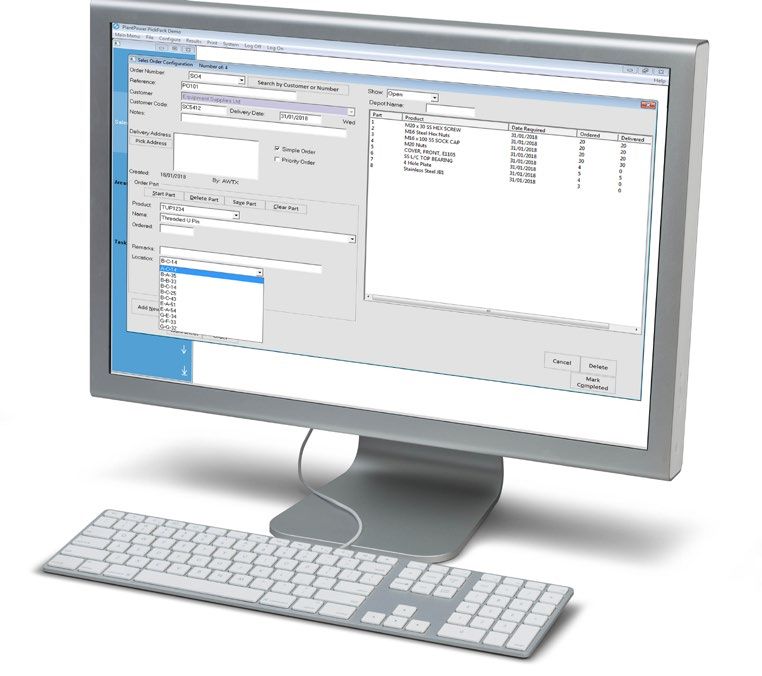
Employee metrics
Three of the top 10 metrics in the WERC report were         How can employee metrics be improved?
employee related: contract employees to total workforce,       »»   Overtime hours to total hours can be reduced
overtime hours to total hours, and part time workforce to           by simply removing overtime as an option,
total workforce.                                                    however in practice this is likely to have a
These statistics are unsurprising given the current                 negative effect on morale and could also have a
shifting demographics within the UK workforce,                      negative impact on the output of the operation.
including a shortage of workers and an aging                   »»   Another way to improve employee metrics is to
population. Brexit has also had a huge impact on                    stagger shift start and end times to provide a
warehouses and DCs as the availability of overseas                  compliment of normal hours workforce across
workforce has decreased dramatically.                               more hours in the day. This does command an
Despite these issues, people are the critical link                  investment in management time to optimise
that keep the supply chain running with 71% of                      schedules so be prepared to devote your time to
respondents ranking their employees as their                        make the shift pattern change happen.
primary importance.                                            »»   The Mobile Picking Solution makes pick
                                                                    operations more efficient by increasing the
                                                                    average number of picks per cycle, meaning less
                                                                    pick operators are needed to deliver the same
                                                                    result. This reduces the need for overtime hours,
“That’s still probably the biggest labour                           and the need to employ agency or part-time
challenge in a warehouse operation - it’s                           staff who tend to be more expensive and not as
the picking. And equally, that’s the area                           efficient as contracted employees.
     where you could get it wrong.”
  Head of Warehouse and Distribution                                However, if agency or part-time staff are
                                                                    required, the Mobile Picking Solution can ensure
                                                                    pick accuracy, with features including displaying
                                                                    a picture of the picked item and showing
                                                                    red/green signals which indicate when a correct
                                                                    pick count has been achieved.

                                                        7
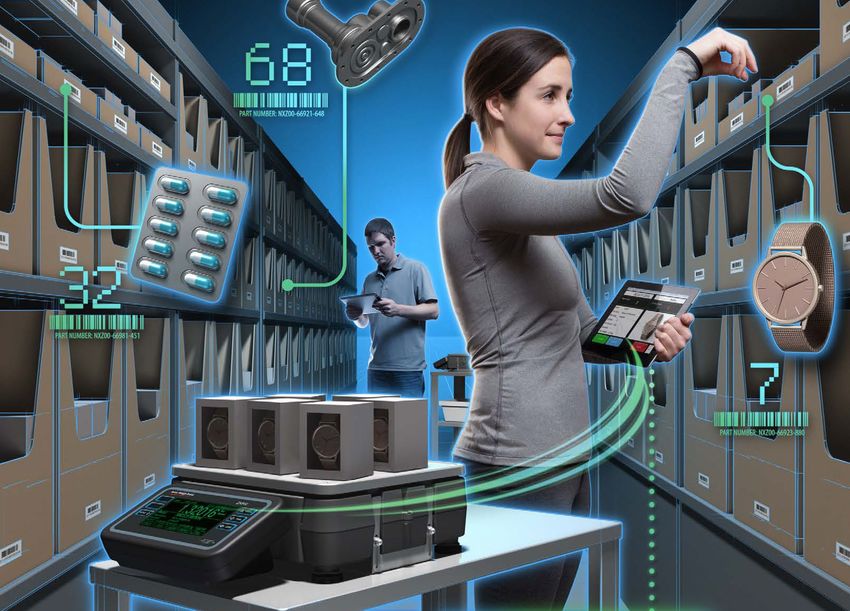
Improve your performance with
the Mobile Picking Solution

The Mobile Picking Solution (MPS) workstation from
Avery Weigh-Tronix is a mobile system that brings
technology to the point of pick, to eliminate manual
counting and verify pick accuracy.
The Mobile Picking Solution development was driven
by market research and specifically designed to solve
the common pain points found in warehouses and
distribution centres.
The system comes equipped with a high-resolution
Avery Weigh-Tronix ZK840 advanced counting scale,
barcode scanner, battery power supply and printer.
This combination means that verifying pick accuracy
(part and quantity) is as simple as scanning and placing
parts on the scale.

Accuracy or speed?
The MPS workstation combats
the dreaded trade-off between
accuracy and speed as it promises
improvements to both; delivering a
minimum achievable accuracy of
99.75% while increasing average
picks per hour by 10%.

Fast payback
Small changes in accuracy can generate large savings        What’s next?
which impact on a business’s bottom line. Where
payback on options like automation is calculated in         The Mobile Picking Solution guarantees a minimum
years, payback on the MPS is calculated in months           achievable accuracy of 99.75%, while increasing average
thanks to immediate cost savings via reduced errors         picks per hour by 10%.
and increased pick operator speed.
                                                            Speak to our experts about how to improve your picking
                                                            accuracy without compromising on speed.
Guaranteed uptime                                           To arrange a free demonstration,
In a world where everything is time critical and            email info@awtxglobal.com or call us on 0845 307 0314
efficiency is key, you need to guarantee your equipment
will be working as and when you need it!
With many warehouse operations running 24/7 to meet         References
the expectations of consumers, it is imperative that
                                                            Tillman, J., Manrodt, K., and Williams, D. (2018), WERC DC Measures:
your equipment doesn’t let you down. When the worst         2018 Trends and Challenges, Warehousing Education and Research
happens, Uptime Select™ service plans from Avery            Council, USA “O
Weigh-Tronix maximise uptime and minimise disruption
to keep your business running.

                                                        8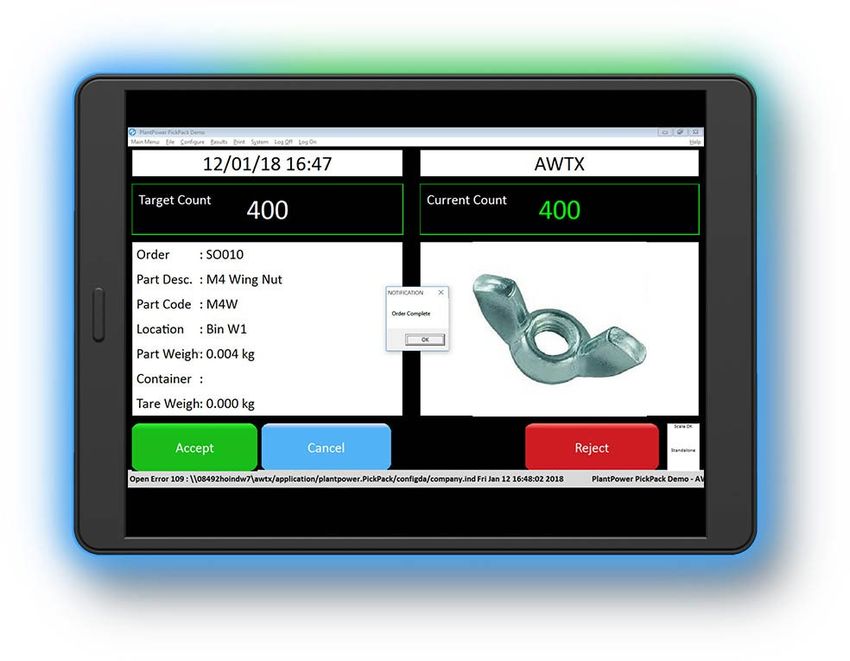

You can also read