MODELLING THE EFFECTS OF AL2O3-SIO2 NANOCOMPOSITE ADDITIVE IN BIODIESEL-DIESEL FUEL ON DIESEL ENGINE PERFORMANCE USING HYBRID ANN-ABC
←
→
Page content transcription
If your browser does not render page correctly, please read the page content below
DOI: 10.2478/ata-2021-0004

    Maryam Jabraeili et al.                                                           Acta Technologica Agriculturae 1/2021

                                              Acta Technologica Agriculturae 1
                               Nitra, Slovaca Universitas Agriculturae Nitriae, 2021, pp. 20–26

            Modelling the Effects of Al2O3-SiO2 Nanocomposite
       Additive in Biodiesel–Diesel Fuel on Diesel Engine Performance
                            using Hybrid ANN-ABC

        Maryam JABRAEILI, Razieh POURDARBANI*, Bahman NAJAFI, Ali NEMATOLLAHZADEH
                                        University of Mohaghegh Ardabili, Ardabil, Iran

Yearly, large amounts of waste cooking oil are produced, which are discharged to urban sewage system. However, majority of them
is recyclable and can be re-used as biodiesel fuel. When using biodiesel fuels, one way to improve the engine performance is to
use nano additives. This study investigates the biodiesel fuel with different ratios of Al2O3-SiO2 nanocomposite additive (Al0%-
Si100%, Al25%-Si75%, Al50%-Si50%, Al75%-Si25% and Al100%-Si0%) at full load and four different nanocomposite concentrations (30, 60, 90
and 120 ppm). The Hybrid ANN-ABC modelling was conducted for two cases: a) finding and applying the most effective properties
as network inputs; and b) total properties as inputs showed that the most effective properties have higher performance. The
fuels B5Al60Si60 and B5Al9Si21 showed the highest brake power; the fuels B5Al0Si60 and B5Al120Si0 showed the lowest brake power,
indicating that the interactions of nanoparticles in the composite mode had positive effects on brake power. The performance
improvement using nano-composite additive was more than that of the nanoparticles individually.

Keywords: brake power; biofuel; performance; oil

The decline in fossil energy sources and their environmental         and Saravan (2017) reported significant increase in thermal
impacts have led communities to consider renewable                   efficiency and a slight decrease in harmful emissions (such as
energy alternatives. One of these renewable sources is               CO, HC and soot) using Al2O3 NPs additive to the B20 biodiesel
biodiesel fuel, which has various methods of production;             blend. Prabu and Anand (2015) reported an improvement in
and various experiments have been conducted on its effects           performance of a single-cylinder diesel engine when they
on diesel engine performance and emissions (Alibaba et al.,          used Al2O3 and CeO2. Aghbashlo et al. (2019) investigated
2020; Čedík et al., 2018). Furthermore, nano-based science is        the effect of diesel-biodiesel fuel with CeNPs additive (0 and
rapidly advancing in all fields, including biofuels. Diesel fuel     90 ppm) on engine performance. The results showed that
shows a different behaviour when combined with additives,            engine load and fuel type strongly influence the exergy-
which can improve the performance and emission in specific           based stability indices. In general, increasing the engine
cases (Khalife et al., 2017).                                        load continuously decreases the exergy efficiency. Their
     Sajith et al. (2010) investigated the effect of                 proposed blended fuel showed much better environmental
Cerium oxide nanoparticles (CeNPs) on biodiesel in single-           performance than pure diesel fuel.
cylinder direct injection diesel engines at 1500 rpm. An                 According to previous research, performance
increasing trend in the physical and chemical properties             improvement using nanoparticle additives to biodiesel fuel
of fuel, such as flash point, viscosity and oscillation, was         is obvious, however, there is lack of information in terms of
observed. The results showed that there was an average               direct addition of nanocomposites to diesel-biodiesel fuel.
reduction of 25% in HC emissions. CeNPs additive reduced             Therefore, this study investigates the addition of Al2O3-SiO2
NOx emissions by 30%. However, the effect of fuel additives          nanocomposite (at different ratios) to disesel-B5 blended
on CO reduction was not significant. Bhagwat et al. (2015)           fuel and its effect on diesel engine performance.
investigated graphene nanoparticles additive to diesel-
-biodiesel blended fuel (25 and 50 ppm) in a single cylinder
diesel engine. Fangsuwannarak and Triratanasirichai (2013)
                                                                                      Material and methods
evaluated the properties of biodiesel and TiO2 additive
impacts on the diesel engine. The results showed that                                  Fuel sample preparation
the performance and emissions were improved; the fuel                Biodiesel fuel was produced from waste cooking oil by
quality increased by 0.1%. In addition, kinematic viscosity          transesterification, and conventional Iranian diesel fuel was
was decreased and cetane number was increased. Silva et              used for referential purposes. Fuel specifications complied
al. (2015) used TiO2 nanoparticles additive in diesel engine.        with ASTMD 6751-20a. After ensuring that the produced
The results show improvement in fuel properties. Aalam               biofuel meets the required standards, the diesel-biodiesel

 Contact address: Razieh Pourdarbani, University of Mohaghegh Ardabili, Department of Biosystem Engineering, Ardabil, Iran

  20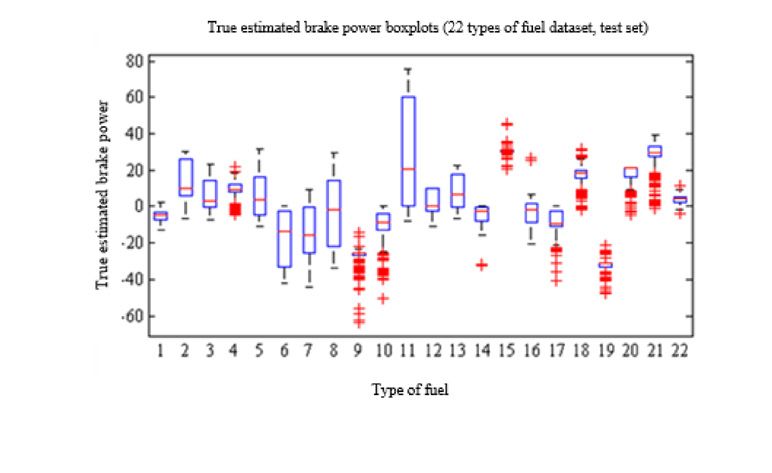
Acta Technologica Agriculturae 1/2021                                                                Maryam Jabraeili et al.

Table 1        Fuel samples and ratio of nanoparticle composition
 No.          Sample                Final ppm         Al (ppm)         Al%             Si (ppm)             Si%         Biodiesel%
                                                                                                                             5
 1            B5Al30Si0                30               30              100                0                 0

 2            B5Al21Si9                                 21              75                 9                 25
 3            B5Al15Si15                                15              50                15                 50
 4            B5Al9Si21                                  9              25                21                 75
 5            B5Al0Si30                                  0               0                30                100
 6            B5Al60Si0                60               60              100                0                 0               5
 7            B5Al42Si18                                42              75                18                 25
 8            B5Al30Si30                                30              50                30                 50
 9            B5Al18Si42                                18              25                42                 75
 10           B5Al0Si60                                  0               0                60                100
 11           B5Al90Si0                90               90              100                0                 0               5
 12           B5Al63Si27                                63              75                27                 25
 13           B5Al45Si45                                45              50                45                 50
 14           B5Al27Si63                                27              25                63                 75
 15           B5Al0Si90                                  0               0                90                100
 16           B5Al120Si0              120               120             100                0                 0
 17           B5Al84Si36                                84              75                36                 25
 18           B5Al60Si60                                60              50                60                 50
 19           B5Al36Si84                                36              25                84                 75
 20           B5Al0Si120                                 0               0               120                100
 21                B5                                    ---             0                ---                0               5
 22                D                                     ---             0                ---                0               0

blended fuel was prepared (B5). Different ratios of Al2O3 and          was the single-cylinder Kirloskar Oil Engines Ltd made in
SiO2 were composited at 30, 60, 90 and 120 ppm. Desired                India (Fig. 1) that was coupled to a jb/t-200 power generator,
concentrations of each nanoparticle were measured by                   which was connected to a load cell by an arm. The electricity
digital scale (Sartorius Corporation) and added to the fuel,           generated was transmitted to a power heater consumer. As
and an ultrasonic probe (Ultrasonic Homogenizer 300R) was              the power consumption changed, the engine came under
used for homogenization. Different capacities of ultrasonic
waves were tested in order to disperse these nanoparticles,
and finally, ultrasonic waves of 400 W were used for each
sample for 3 minutes. Ultimately, the 22 fuel samples (Table
1) were prepared for the experiments. The nanoparticles
were made in Merck CO. The physical properties of these
nanoparticles are presented in Table 2. The engine tested

Table 2        Characteristics of the nanoparticles used
 Characteristics                             SiO2              Al2O3
 Pure (%)                                    99.5               99
 Size (nm)                                      20              20
                           2   -1
 Specific surface area (m ∙g )                210              200
 The amount of O2 (%)                        53.26             47.07
 The amount of minerals (%)                  46.74             52.93
 Manufacturing country                      Germany          Germany   Fig. 1   Diesel engine test stand

                                                                                                                                 21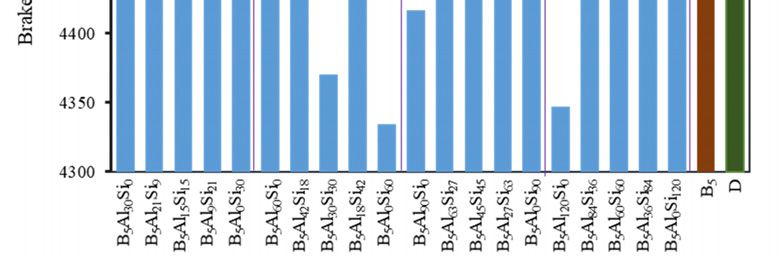
Maryam Jabraeili et al.                                                        Acta Technologica Agriculturae 1/2021

a load. Fuel consumption was also measured by a graduated          identifying the food sources, the bees return to the hive
cylinder. These experiments were performed under full load         and inform other bees, so-called ‘scout bees’ that are sent
conditions at a constant speed of 1,500 rpm.                       to these areas to check the amount of nutrients in areas and
                                                                   their quality, and then return to the hive. This will continue
          Modelling using artificial neural network                until the food source is identified in great quantity and
                                                                   quality. This operation in the optimization mode means
Extracted properties of each sample fuel                           finding the optimal points (Hussain et al., 2016). The ANN-
The properties used as predictor inputs were fuel type;            MLP has 5 adjustable parameters including the number
density; cloud point; viscosity; flash point; heating value;       of neurons; number of layers; transfer function; back
oxygen in the exhaust gases; and oil temperature and               propagation training function; back propagation weight/
relative humidity of the outdoor air.                              bias learning function, optimal values of which guarantee
                                                                   high performance (Table 4).
   Method for the most efficient property selection
Since the measurement of all properties is costly and time         Table 4       Values of hidden layer of MLP-ANN for prediction
consuming, finding the most effective among all properties                       of brake power using total properties
can be both time and cost effective. For this reason, a hybrid      Features                                The value or type
Artificial Neural Network – Differential Evolution (ANN-DE)                                                    of feature
was used to select the most effective properties. Similarly
                                                                                                                first layer: 6
to many other optimization algorithms, the DE algorithm is          Number of neurons                         second layer: 9
based on population and random behaviour proposed by                                                           third layer: 18
Storn and Price (1996). This algorithm consists of two basic
steps of initialization and evolution. While the optimization       Number of layers                                 3
problem does not have any basic information, it must first                                                   first layer: netinv
generate a random population and then, to optimize the              Transfer function                      second layer: satlins
problem, the population members are improved through                                                        third layer: compet
mutation, and selection process is conducted until the              Back propagation network training
                                                                                                                 traingdx
optimization is achieved. In order to select the effective          function
feature, the extraction feature was firstly considered              Back-propagation weight/bias
a vector. Subsequently, other vectors of different sizes were                                                    learnlv1
                                                                    learning function
selected using DE algorithm and sent to ANN. Artificial
Neural Network – Multi Layer Perceptron (ANN-MLP) divides                    Brake power prediction using the most
all data into three categories; 1) the first contains 70% of the                     effective properties
data for training, 2) the second contains 15% of the data
                                                                   The method used for this section is the same as in the
for validation, and 3) the third contains 15% of the data for
                                                                   previous section. Table 5 gives the optimal structure of the
testing. Finally, the mean squared errors of each vector are
                                                                   hidden layers of MLP-ANN arranged by ABC algorithm.
sent to the ANN-MLP using the DE algorithm. Each vector
with the least MSE was selected as the effective property.
                                                                   Table 5       Hidden layer of MLP-ANN to predict brake power
Table 3 shows the ANN-MLP properties used to select the
                                                                                 using the most effective properties
effective properties.
                                                                                                            The value or type
                                                                    Features
Table 3        Configuration of hidden layer ANN used to select                                                of feature
               the most effective properties                                                                   first layer: 14
                                                                    Number of neurons                        second layer: 18
 Features                               The value or type
                                                                                                              third layer: 13
                                           of feature
                                                                    Number of layers                                 3
 Number of neurons                              10
                                                                                                              first layer: radbas
 Number of layers                                1
                                                                    Transfer function                      second layer: hardlim
 Transfer function                            tansig                                                         third layer: radbas
 Back-propagation training                                          Back propagation network training
                                              trainlm                                                            traingda
 network function                                                   function
 Back-propagation weight/bias                                       Back propagation weight/bias
                                             learngdm                                                            learnlv2
 learning function                                                  learning function

   Predicting the brake power using total properties                           Performance evaluation parameters
Hybrid Artificial Neural Network – Artificial Bee Colony                              of hybrid ANN-ABC
(ANN-ABC) was used to predict the brake power of different         Performance evaluation parameters of hybrid ANN-ABC
fuels. Hybrid ANN-ABC algorithm is inspired by the way of          to predict the brake power include the coefficient of
bee behaviour in nature. In the beehive, a number of bees          determination (R2); sum squared error (SSE); mean absolute
are tasked with searching for food sources, which means            error (MAE); mean square error (MSE); root mean square
producing initial responses in the optimized state. After          error (RMSE) (Sabzi et al., 2013; Javadikia et al, 2018).

  22
Acta Technologica Agriculturae 1/2021 Maryam Jabraeili et al.
training. The coefficient of regression value is above 0.999
Results and discussion for the best training mode. MES, RMES, MAE, SSE and R2 were
0.0061, 0.0782, 0.0407, 0.094 and 0.9706, respectively.
Performance of hybrid ANN-ABC in predicting brake Fig. 5 shows the actual value versus the mean value of
power at 1000 iterations using total properties brake power (test set) by the hybrid ANN-ABC using the most
effective properties in the best state of training. According
According to Fig. 2, the coefficient of regression is above to Fig. 5, the actual and estimated values are close together,
0.982. MES, RMES, MAE, SSE and R2 for the best training indicating that the proposed method can predict the brake
condition were 0.0091, 0.0956, 0.0533, 0.1188 and 0.9636, power using the most effective properties.
respectively. Fig. 3 represents the actual value versus
the estimated value of the brake power using the total Comparison of the brake power predicted using total
properties in the best state of training, indicating that properties and the most effective properties
the actual and estimated values are close to each other in
Table 6 gives the mean and standard deviations of
majority of samples.
performance evaluation parameters in estimating the brake
Performance of hybrid ANN-ABC in brake power power for two different input sets, including the total and
prediction in the best state of training using the most most effective properties at 1000 iterations. As it can be
observed, the performance of the most effective properties
effective properties
is higher than in the other mode, i.e., the expected brake
Fig. 4 shows the scatter plot regression analysis estimated by power is closer to the actual value due to the contradiction
the hybrid ANN-ABC using the most effective properties and between the total properties.
the actual brake power of different fuels in the best state of
Fig. 2 Scatter plot regression analysis estimated by the hybrid
ANN-ABC using the total properties and the actual Fig. 4 Scatter plot regression analysis estimated by the hybrid
brake power of different fuels in the best state of ANN-ABC using the most effective properties and
training actual brake power of different fuels in the best state of
training
Fig. 3 Actual value versus estimated value of the brake power Fig. 5 Actual value versus the mean value of brake power by
by the hybrid ANN-ABC using the total properties in hybrid ANN-ABC using the most effective properties in
the best state of training the best state of training
23Maryam Jabraeili et al. Acta Technologica Agriculturae 1/2021
Table 6 Comparison of predicted brake power using the total properties and most effective properties at 1000 iterations
Properties Criterion MSE RMSE MAE SSE R R2
Total properties Mean 0.0278 0.1598 0.1228 0.3611 0.9545 0.9114
SD 0.0139 0.0474 0.0429 0.1809 0.0188 0.0360
Effective properties Mean 0.0126 0.1076 0.0712 0.1645 0.9792 0.9590
SD 0.0067 0.0326 0.0267 0.0909 0.0104 0.0203
Table 7 Actual value, mean and standard deviation of the predicted brake power value of the 22 fuel samples using the total
and most effective properties
Fuel no. Measured value Predicted value using total properties Predicted value using the most effective properties
1 4477.33 4482.66 ±2.256 4476.59 ±3.38
2 4486.46 4473.28 ±10.66 4490.98 ±7.19
3 4498.65 4492.85 ±7.91 4496.34 ±3.66
4 4551.22 4541.52 ±4.61 4542.03 ±8.62
5 4440.55 4435.79 ±10.15 4433.11 ±12.23
6 4462.015 4479.66 ±15.57 4464.86 ±4.08
7 4471.13 4485.16 ±14.04 4473.71 ±4.00
8 4370.33 4371.34 ±17.74 4372.64 ±4.31
9 4492.66 4519.92 ±5.86 4494.76 ±4.76
10 4334.57 4345.56 ±9.13 4336.98 ±4.68
11 4416.33 4388.40 ±28.54 4420.58 ±18.96
12 4501.82 4498.96 ±5.82 4503.27 ±3.63
13 4504.87 4497.44 ±8.48 4494.76 ±4.76
14 4507.92 4512.59 ±6.29 4502.19 ±6.98
15 4507.92 4477.18 ±2.05 4503.66 ±3.61
16 4346.73 4351.00 ±6.14 4349.413 ±9.16
17 4477.33 4485.42 ±5.49 4488.28 ±7.25
18 4560.47 4542.90 ±4.65 4557.88 ±6.59
19 4507.92 4539.98 ±4.17 4505.39 ±28.84
20 4514.14 4495.78 ±5.61 4522.91 ±26.59
21 4538.87 4510.45 ±6.65 4533.75 ±10.72
22 4486.56 4482.84 ±2.17 4489.481 ±12.14
Table 7 gives the actual value, mean and standard Effects of different ratios of Al2O3-SiO2 composite
deviations for the predicted brake power of 22 fuel samples additive to diesel-biodiesel fuel on brake power
using two different sets, including the total and most In this study, Al2O3 and SiO2 nanoparticles had similar size
effective properties selected by the hybrid ANN-ABC. Since and specific surface area. Therefore, the chemical properties
each execution contains 9 test samples, there would be 9,000 of nanoparticles are expected to be the only factors affecting
in 1,000 iterations, and since there were only 22 samples, the fuel properties and exhaust gases. Considering the Fig.
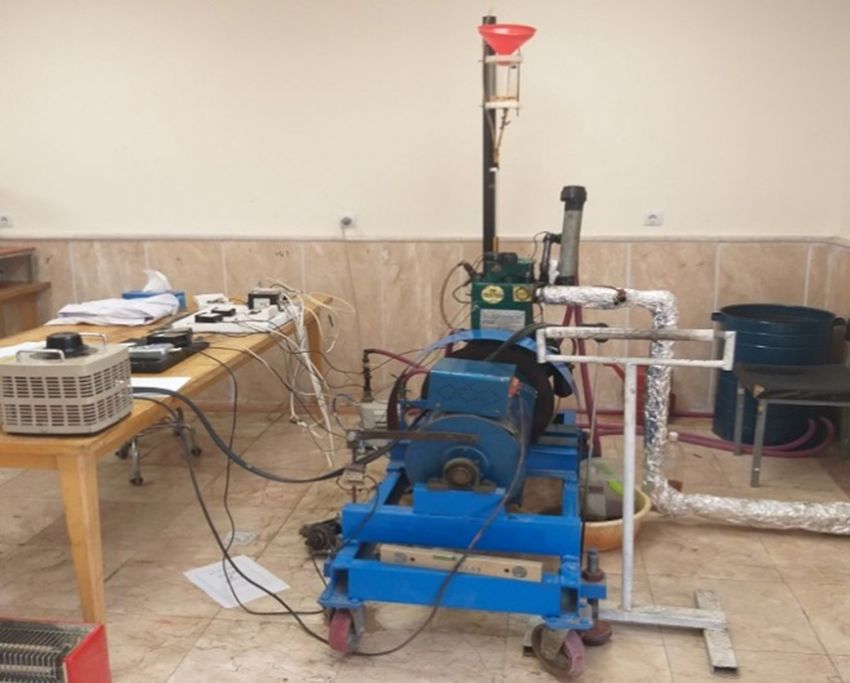
there would be more than 409 iterations per sample. Finally, 7, it is clear that B5Al60Si60 and B5Al9Si21 samples have the
Fig. 6 illustrates the actual brake power minus the brake highest brake power, and B5Al0Si60 and B5Al120Si0 have the
power estimated by hybrid ANN-ABC for 22 fuels using the lowest brake power. Sample B5 improved the brake power
total and most effective properties. Fig. 6 utilizes the most compared to pure diesel fuel because of its oxygen content.
effective properties as inputs, and the samples have more At the concentration of 30, 60 and 90 ppm, the highest
compact box diagrams than the other mode, indicating that brake power was obtained in sample B5Al9Si21 (70% SiO2,
the most effective properties have higher performance than 30% Al2O3 and 5% biodiesel). At 120 ppm, the highest brake
total properties. power was obtained in the B5Al60Si60 sample, i.e., addition of
Al2O3-SiO2 composite has improved the brake power more
24Acta Technologica Agriculturae 1/2021 Maryam Jabraeili et al.
than separate addition of either Al2O3,
or SiO2. The nanoparticle interactions
in the composite had positive effects
on the brake power. Therefore, at
30 ppm, the brake power increased
with increasing Si/Al ratio; however,
at zero alumina content, the brake
power decreased. This may be due to
the elimination of the catalytic effect
of Al2O3 nanoparticles. At 60 ppm,
a similar increase was observed, with
a significant decrease in brake power
at 50% of the nanoparticles, which
could be due to the accumulation of
SiO2 nanoparticles around the Al2O3,
preventing catalytic activity. On the
(a)
contrary, at 90 ppm, the increasing
trend in brake power at high ratios of
Si/Al has reached an almost constant
value, which could be due to the
catalytic compensation of alumina
by the silica nanoparticles oxygen.
However, at 120 ppm, when the
nanoparticles were 50% (B5Al60Si60),
the increasing trend in brake power
was associated with a jump, which
could be a result of facilitating the
dispersion and stabilization of Al2O3
nanoparticles by SiO2 nanoparticles.
In general, the effect of Al2O3 and SiO2
nanoparticles can be a result of the
simultaneous effect and sometimes
aspects such as (1) the catalytic
(b) properties of Al2O3 nanoparticles; (2)
(b)
oxygen supply by nanoparticles for
Fig. 6 (a) Box diagrams of brake power for 22 fuel samples using total properties, (b)
CO oxidation and against the oxygen
Box diagrams of brake power for 22 fuel samples using effective properties
uptake for NO reduction; and 3) SiO2
nanoparticles accumulation away from
Al2O3 nanoparticles, which prevents
the catalytic activity (Bielanski and
Haber, 1990).
Conclusion
Currently, one of the most important
challenges is to maximize the brake
power in diesel engines. The modelling
results of brake power by ANN-ABC
using the effective properties as the
network input indicate that these
samples had more compact box
diagrams than the ones used for the
total properties, suggesting the high
performance.
The results showed that the highest
brake power was obtained in B5Al9Si21
at 30, 60 and 90 ppm. At 120 ppm, the
highest brake power was obtained
in B5Al60Si60, leading to an increase
Fig. 7 Effect of different ratios of Al2O3-SiO2 nano-composite additive to diesel- of 1.44% in torque and an increase of
biodiesel fuel on brake power 1.64% in the braking power relative to
diesel fuel. On the other hand, it must
25Maryam Jabraeili et al. Acta Technologica Agriculturae 1/2021
be mentioned that, unlike nano-alumina, there was no HUSSAIN, A. – ZHANG, M. – ÜCPUNAR, H. K. – SVENSSON, T. –
regular decreasing or increasing trend at different ratios of QUILLERY, E. – GOMPEL, N. – IGNELL, R. – GRUNWARD, I. C. 2016.
30, 60, 90 and 120 with the addition of nanosilica. In contrast Ionotropic chemosensory receptors mediate the taste and smell of
to alumina nanoparticles, silica nanoparticles improved the polyamines. In PLoS Biology, vol. 14, no. 5, e1002454.
performance of diesel engine and achieved acceptable JAVADIKIA, H. – SABZI, S. – ARRIBAS, J. 2018. An automatic and non-
intrusive hybrid computer vision system for the estimation of peel
success in improving the level of produced pollutants. The
thickness in Thomson orange. In Spanish Journal of Agriculture, vol.
interactions between the nanoparticles in the composite
16, no. 4, 15 pp.
state had positive effects on the brake power.
FANGSUWANNARAK, K. – TRIRATANASIRICHAI, K. 2013.
Improvements of palm biodiesel properties by using nano-TiO2
References additive, exhaust emission and engine performance. In Optics &
Mechatronics, no. 43, pp. 111–118.
AALAM, C. S. – SARAVANAN, C. G. 2017. Effect of nano metal oxide KHALIFE, E. – TABATABAEI, M. – NAJAFI, B. – MIRSALIM, S. M. –
blended Mahua biodiesel on CRDI diesel engine. In Ain Shams GHAREHGHANI, A. 2017. A novel emulsion fuel containing aqueous
Engineering Journal, vol. 8, no. 4, pp. 689–696. nano cerium oxide additive in diesel–biodiesel blends to improve
diesel engine performance and reduce exhaust emissions: Part II –
AGHBASHLO, M. – TABATABAEI, M. – KHALIFE, E. – NAJAFI, B. –
Exergetic analysis. In Fuel, vol. 205, pp. 262–271
MIRSALIM, M. – MOHAMMADI, P. – ROODBAR, T. – KHOUNANI, Z.
2019. A novel emulsion fuel containing aqueous nano cerium PRABU, A. – ANAND, R. B. 2015. Emission control strategy by adding
oxide additive in diesel–biodiesel blends to improve diesel engines alumina and cerium oxide nano particle in biodiesel. In Journal of
performance and reduce exhaust emissions: Part II – Exergetic Energy Institute, vol. 89, no. 3, pp. 366–372.
analysis. In Fuel, vol. 205, pp. 262–271. SABZI, S. – JAVADIKIA, H. – RABBANI, H. – ADELKHANI, A. 2013. Mass
ALIBABA, M. – POURDARBANI, R. – KHOSHGOFTARMANESH, modeling of Bam orange with ANFIS and SPSS methods for using
M.H. – OCHOA, G.V. – DUARTE FORERO, J. 2020. Thermodynamic, in machine vision. In Measurement, vol. 46, no. 9, pp. 3333–3341.
exergo-economic and exergo-environmental analysis of hybrid SAJITH, V. – SOBHANN, C. B. – PETERSON, G. P. 2010. Experimental
geothermal-solar power plant based on ORC cycle using emergy investigation on the effect of cerium oxide nanoparticle fuel
concept. In Heliyon, vol. 6, no. 4, e03758. additive on biodiesel. In Advances in Mechanical Engineering, vol.
ASTMD 6751-20a. Standard Specification for Biodiesel Fuel Blend 47, no. 1, pp. 7–16.
Stock (B100) for Middle Distillate Fuels. Available at: https://www. SILVA, R. D. – BILNU, K. G. – BHAT, T. 2015. Performance and
astm.org/Standards/D6751.htm emission characteristics of a C.I. engine fuelled with diesel and TiO2
BIELANSKI, A. – HABER, J. 1990. Oxygen in Catalysis. Boca Raton: nanoparticles as fuel additive. In Materials Today: Proceedings, vol.
CRC Press, 488 pp. 2, no. 4, pp. 3728–3725.
BHAGWAT, V. A. – PAWAR, C. – BANAPURMATH, N. R. 2015. Graphene STORN, R. – PRICE, K. 1996. Differential evolution – a simple and
nanoparticle – biodiesel blended diesel engine. In International efficient heuristic for global optimization over continuous spaces. In
Journal of Engineering Research & Technology (IJERT), vol. 4, no. 2, Journal of Global Optimization, vol. 11, pp. 341–359.
75–78. nnn
ČEDÍK, J. – PEXA, M. – PETERKA, B. – HOLŮBEK, M. – MADER, D. –
PRAŽAN, R. 2018. Effect of biobutanol-sunflower oil-diesel fuel
blends on combustion characteristics of compression ignition
engine. In Acta Technologica Agriculturae, vol. 21, no. 4, pp.
130–135.
26You can also read