Mathematical Optimisation Model for Management of Sago Palm Plantation Expansions
←
→
Page content transcription
If your browser does not render page correctly, please read the page content below
109

 A publication of

 CHEMICAL ENGINEERING TRANSACTIONS
VOL. 78, 2020 The Italian Association
 of Chemical Engineering
 Online at www.cetjournal.it

Guest Editors: Jeng Shiun Lim, Nor Alafiza Yunus, Jiří Jaromír Klemeš
Copyright © 2020, AIDIC Servizi S.r.l.
 DOI: 10.3303/CET2078019
ISBN 978-88-95608-76-1; ISSN 2283-9216

 Mathematical Optimisation Model for Management of Sago
 Palm Plantation Expansions
Jaya Prasanth Rajakala, Denny K. S. Ngb, Raymond R. Tanc, Viknesh Andiappanb,
Yoke Kin Wana,*
a
 School of Engineering, Faculty of Innovation and Technology, Taylors University, Lakeside campus, No 1 Jalan Taylors,
 47500, Subang Jaya, Selangor, Malaysia
b
 School of Engineering and Physical Sciences, Heriot-Watt University Malaysia, 62200, Putrajaya, Wilayah Persekutuan
 Putrajaya, Malaysia
c
 Chemical Engineering Department, De La Salle University, 2401 Taft Avenue, 0922 Manila, Philippines
 yokekin.wan@taylors.edu.my

Sago palm is an important indigenous crop grown in Southeast Asia. Its main product, sago starch, has the
potential to be an alternative source of starch when compared to traditional starch derived from maize, sweet
potato, cassava etc. Despite its potential, sago has remained as wild forest trees in swampy areas and
unutilised for decades. Recently, Malaysia and Indonesia have shown interest in establishing estate
plantations of sago palms. Although such a development may be welcomed, it is advisable to exercise caution
during expansion of sago plantations. It is highly likely that unplanned expansions may result in large scale
clearing of the tropical and peatland forests that are densely concentrated. In this respect, the vulnerability of
these sensitive ecosystems during sago plantation expansions must be carefully accounted for. Therefore, in
order to ensure planned and minimal sago plantation expansion, decision support tools that help to strategies
land use changes (LUC) is crucial. Thus, this work presents a mathematical optimisation model of the type
mixed integer linear programming (MILP) to plan for sago plantation expansions. The proposed model
determines whether land expansion would be required when demands increase, accounting for the cost
involved in expansion. A simple sago value chain has been solved to illustrate the proposed model . The
results show that the optimised results avoided 4.3 % - 9.3 % of possible land area under expansion; 2.96 –
4.05 times of CO2 emission and 120.16 % - 189.14 % of cost savings.

1. Introduction
Sago starch is a potential and emerging alternative to traditional starch varieties. Sago starch is produced
from sago palms. The commercial cultivation of sago palm has led to the development of sago plantations.
The demand for sago starch is expected to increase due to favourable government policies and market
dynamics, especially in the south Asian and Asia Pacific region (Mohamad et al., 2016). Considering these
developments, there may arise a need in the future for expanding the sago plantations to cater to this
increased demand. Under this circumstance, it becomes very important to strategies the expansions to have
minimal environmental impact from LUC (Sheikhi et al., 2018). It can be noted that few previous works have
attempted to optimise the land use. Accorsi et al. (2015) developed a model to solve land allocation problem in
agro value chains. Li et al. (2019) proposed a model for agricultural energy-water-food (EWF) nexus
management, in which, optimisation of land allocation for agriculture is also addressed. Hao et al. (2017)
developed an optimisation model for spatial spread of different crops within a region to effectively utilise the
land and water resources. It can be noted that most of the works were involved in optimising the allocation of
existing land resources for different land uses (Wosten and Ritzema, 2001); but very limited works have
attempted to optimise the expansion of new lands (only if required) into the agro value chain. The current work
aims to address this research gap by developing a model that aids decision maker to plan sago plantation
expansions based on the forecasted demand for sago starch. The optimisation of expansion is achieved by
minimising the expansion cost and carbon penalty cost. The carbon penalty cost is levied due to emissions

Paper Received: 14/04/2019; Revised: 13/08/2019; Accepted: 26/08/2019
Please cite this article as: Rajakal J.P., Ng D.K.S., Tan R.R., Andiappan V., Wan Y.K., 2020, Mathematical Optimisation Model for Management
of Sago Palm Plantation Expansions, Chemical Engineering Transactions, 78, 109-114 DOI:10.3303/CET2078019
110

from LUCs. Th cost minimisation indirectly promotes minimum usage of new lands for expansion and
avoidance of excessive land disturbance and associated biodiversity loss due to unplanned expansion. In
fact, Van Fan et al. (2019) emphasised on the need for more efficient management of virgin resources in order
to reduce pollution. Moreover, the current approach contains novel binary formulations that are analogous to
decision-making approaches in utility systems (Velasco-Garcia et al., 2011), making the model simpler and
more efficient when compared to other previous works. Furthermore, the approach uses cost for minimising
expansions, making it more relevant in decision making especially in developing countries. The next section
defines problem and the superstructure of sago value chain. Next, Section 3 explains the mathematical model
formulation for this work. Following this, an illustrative case study is presented in Section 4. Lastly, Section 5
draws on the conclusions and future work.

2. Sago plantation expansion
The problem statement that the current work aims to address is discussed in this section. Figure 1 illustrates a
general representation of a sago value chain. As shown in Figure 1, a set of existing sago plantations and
potential lands for sago plantation development ∈ with area and plantation density , is considered in
the value chain. The potential lands for sago plantations p are selected such that they are within the 100 km
radius of the sago mill s. The sago plantations yield sago logs as the primary product of harvest and is
transported to the sago mills. At the sago mills ∈ , the sago logs are processed to produce sago starch as
the final product. As discussed, the expected increase in sago starch demand may lead to unplanned
excessive deforestation for expansion of sago plantations. Therefore, to ensure minimal sago palm plantation
expansions, a simple model is proposed.

Figure 1: Generic superstructure of sago value chain

The proposed model is developed based on the general superstructure presented in Figure 1. Superstructure
optimisation has been used in many other works such as life cycle optimisation (Wan et al., 2014) and
biorefinery design (Ng et al., 2015). The next section further describes the general mathematical model
formulation.

3. Mathematical model formulation
This section presents the mathematical formulation in developing the model to represent the sago value chain
shown in Figure 1. It also presents the equations used for estimating the expansion cost and the carbon
penalty cost. The following sub sections discuss the equations in detail.
3.1 Material flow balance
The sago plantation and the potential lands for plantation ∈ with area (ha) has plantation density of ,
(palms/ha) in the time period t. The plantations ∈ have sago palms with varying maturity at any time period
t. The sago palms are harvested when they reach maturity, usually 9 y to 12 y. The amount of sago palms
harvested in the period t, , should be less than the total available sago palms, , and is shown in Eq(1),

 , ≥ , ∀ ∀ (1)

where, , (palms/ha/y) is the number of palms harvested from the total available palms in plantation When,

 , (t/palm/y) is the yield of sago logs - and , is the growth factor of the planation ∈ during the period
111

 _
t, then the total amount of sago logs harvested from the plantation in the period t, , can be determined
as shown in Eq(2).
 _

 , = , , , , ∀ ∀ (2)

where, , is the binary variable activated for those plantations that are part of the value chain. It is explained
in detail at section 3.3. The growth factor, , is a parameter keyed in by the decision maker based on the
soil, climate and hydrology factors over the entire sago palm growth cycle. The parameter values vary
between 0 to any number. For example, if the value is 1.5, then the growth is 50% better than the baseline

period. The total quantity of sago log yield from all the plantations ∈ in the period t, (t/y) can be
determined as shown in Eq(3)

 _
 = ∑ , ∀ (3)
 =1

The harvested sago logs collected from all plantations ∈ are then transported to the sago mills ∈ as
shown by Eq(4).

 = ∑ ∑ , , ∀ (4)
 =1 =1

where, , , (t/y)
 is the quantity of sago logs transported from plantation p to sago mill s with total capacity,
 (t/y) during the period t and is presented in Eq(5).

 ≤ ∑ ,s, ∀ ∀ (5)
 =1

In the sago mills ∈ , the sago logs are processed to produce sago starch. The quantity of sago starch
produced from all the sago mills during the period t, ℎ (t/y) can be determined as shown in Eq(6).

 ℎ
 ℎ = ∑ ∑ ,s, ∀ (6)
 =1 =1

where, ℎ is the conversion factor for the sago logs at the sago mill s to sago starch. The model optimises
the sago plantation expansion depending on the expected increase in sago starch demand. This demand is
given as a constraint as shown in Eq(7)

 ℎ = ℎ ∀ (7)

where, ℎ is the expected increased demand for sago starch at time period t.
3.2 Expansion optimisation
The model optimises the land for expansion based on the binary formulation which was previously used by
Rajakal et al. (2019). The binary equations provide a simpler approach to optimise land selection compared to
other previous works related to land allocation. The following equations, Eq(8), Eq(9) and Eq(10) present the
binary formulation,
 ℎ
 , −1 × , =0 ∀ ∀ (8)

 ℎ
 , − , ≤0 ∀ ∀ (9)

 ℎ
 , + , −1 − , ≥0 ∀ ∀ (10)
 current
The parameter, Y , −1 indicates if the plantation p is existing at the period previous to t. Value “1” is keyed in
to the existing plantations and value “0” to the potential plantations by the decision maker at the start of the

optimisation. The binary variable, , indicates the status of the plantations and the potential lands after
optimising the expansion to meet the demand expected for the period t. Here, value “1” is given to all the
 ℎ
plantations in the value chain but “0” to the potential new lands at the period t. , is also a binary variable
which is assigned value “1”only for those plantation p that are newly added to the value chain in the period t.
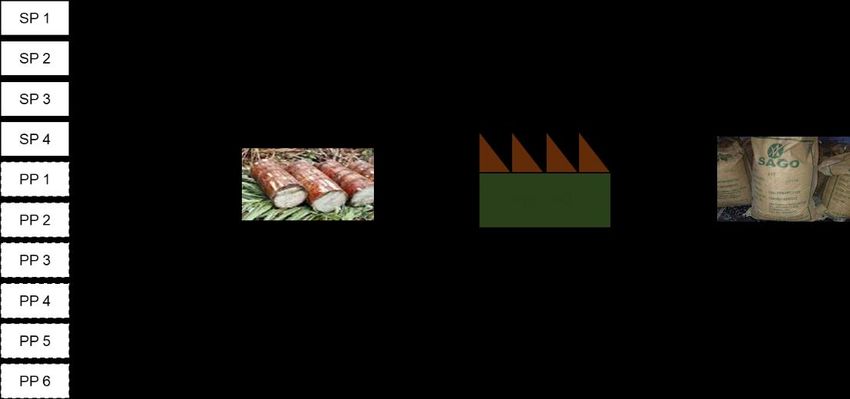
112

 ℎ
 , helps to ascertain the expansion cost and optimise the lands for expansion. Table 1 shows the
 ℎ
working of the binary formulation and the logic for assigning the values for , . The working of the above
equation is explained more briefly by Rajakal et al. (2019).
 ℎ
Table 1: Likely outcomes for the binaries , −1 , , and ,
 ℎ
 , −1 , ,
0 0 0
0 1 1
1 0 0
1 1 0

3.3 Carbon footprint estimation
LUCs typically involves either emission or sequestration of CO2 and it depends upon the nature of LUC. For
example, LUCs of tropical or peat lands to sago plantations results in emission whereas conversion of
grasslands or barren lands results in sequestration. The carbon footprint from the LUCs for sago plantation
expansion can be estimated as shown in Eq(11). Carbon footprint accounting is widely seen as a metric for
environmental and climate change impacts (Jamaludin et al., 2019)
 LUC ℎ
 Emission = ∑ =1 A C , , ∀ (11)
 LUC
where C ,t (tCO2-eq /ha/y) is the annualised CO2 emission from per hectare of potential land p due to LUC to
sago plantation. The carbon emissions are accounted into the expansion cost in the form of carbon penalty
cost. This is achieved by multiplying a cost penalty factor, CPenalty (USD/ tCO2-eq) to the total emissions from
plantation p and then accounting it while estimating the expansion cost. The carbon penalty cost due to

carbon footprint, (USD) associated with planation p due to LUC emissions can determined as
shown in Eq(12),
 LUC ℎ Penalty Period
 = ∑ =1 Cp,t , C T ∀ (12)
where, T Period is the number of years considered for estimating the carbon footprint from the period t in which
the expansions is initiated.
3.4 Expansion cost
As discussed previously the expansion costs considered in the current work are deforestation, planting and
carbon penalty costs due to carbon emissions. These costs are one-time upfront investment in developing a

new sago plantation and do not recur periodically. The expansion cost, (USD) can be
determined as shown in Eq(13).
 ℎ
 = ∑ =1[ + ] × × , ∀ (13)

where,
 (USD/ha) is the cost of land clearing of potential land p for sago plantation,

(USD/ha) is the cost of planting of sago palms at the potential land p and , is the binary variable used for
land selection. The deforestation and planting costs are taken from the works of Abdul Samad et al. (2009)
and Latif et al. (2003).
3.5 Objective function
The sago plantation expansion is optimised by minimising the expansion cost and carbon penalty cost as
presented in Eq(14). A plantation expansion always results in cost which is typically a one-time initial
investment on the land resource. The expansion costs and the carbon penalty cost are influenced by the area
of the lands for expansion and not by other factors like market dynamics, yield, etc. Therefore, minimising the
expansion cost indirectly results in minimising the land expansions. When the expansions are minimum there
is obviously less stress on natural resources and the environment.

 ( + ) ∀ (14)

4. Illustrative case study
A case study of a sago mill company in Malaysia is presented in this section to illustrate the developed
approach shown in Section 3. Figure 2 shows the superstructure of the considered sago mill company. The
113

sago mill has annual maximum production capacity ( ) of 8,250 t of sago starch. The existing sago
plantations supply 21,825 t of sago logs annually to the sago mill. The annual production of sago starch is
4,365 t. PP 1 – 6 are potential new lands identified for sago plantation expansion to meet any increase in
demand for sago starch. The identified potential lands are secondary tropical forests and swampy peat lands.
The area is defined as fixed input values and is presented in Table 2. The deforestation and planting costs of
secondary tropical forest and peat lands are also presented in Table 2. The conversion factor of harvested

sago palms to sago logs at the plantations, , (t/palm/y) is taken as 0.50 and the conversion factor of sago
logs to sago starch at the sago mill, ℎ is taken as 0.20 (Wan et al., 2015). The number of palms
harvested from the plantations, , (palms/ha/y) is taken as 100. The growth factor , of the sago
 LUC
plantations are presented in Table 2. The annual carbon emission C ,t from tropical forests and peat lands
are taken as 14.04 tCO2-eq /ha/y and 69.04 tCO2-eq /ha/y. This was obtained by annualising the carbon
footprint estimated for 50-year timeframe by Fargione et al. (2008). The cost penalty, CPenalty is fixed as USD
10 per tCO2-eq emission and the time period, T Period is taken as 25 y. A mixed integer linear programming
(MILP) model was developed to solve this case study. The model contained 100 continuous variables, 66
fixed parameters and 113 constraints. The model was solved via LINGO version 18.0. A global optimum
solution was obtained within negligible time.

Figure 2: Sago value chain considered in illustrative case study

Table 2: Plantations – Area, Distance to sago mill, Deforestation and Planting cost
Potential new Current land use Area Land clearing cost Planting cost Growth factor
lands (ha) (USD/ha)a (USD/ha)b
PP 1 Tropical forest 130 1,010 1,500 1.2
PP 2 Tropical forest 120 1,010 1,500 1.05
PP 3 Peat land 160 885 2,000 1.1
PP 4 Peat land 105 885 2,000 1.2
PP 5 Tropical forest 85 1,010 1,500 1.2
PP 6 Peat land 75 885 2,000 0.9

The expansion analysis is carried out for an increased sago starch demand. It is expected to increase by
6,800 t/y in the next 5 y considering 10 % annual increase in demand (Xtstarch =6,800 t). As discussed above,
the existing sago plantations support sago starch production up to 4,365 t/y from the 21,825 t of harvested
sago logs. The potential lands for sago plantation PP 1, PP 2, PP 3, PP 4, PP 5, and PPNL 6 can yield 7,800
t/y, 6,300 t/y, 8,800 t/y, 6,300 t/y, 5,100 t/y and 3,376 t/y of sago starch. The optimised results have the
potential plantations NL 1 and NL 5 selected for expansion. The combination of plantations PP 2 – PP 4 and
PP 3 – PP 6 can support sago starch production of 2,520 t/y and 2, 435 t/y and are supposed to be
appropriate to meet the deficit in production (2,435 t/y). However, the PP 1 – PP 5 combination is selected for
expansion due to minimum expansion cost. The total cost (expansion cost and carbon penalty cost) of the
combination PP 1 - PP 5, PP 2 - PP 4, and PP 3 - PP 6 is 1.29 x 10⁶ USD; 2.84 x 10⁶ USD and 3.73 x 10⁶
USD. The optimised selection of PP 1 – PP 5 combination compared to PP 2- PP 4 and PP 3 – PP 6 has
resulted in possible avoidance of 4.3% and 9.3% of expansion in land area. This includes 105 ha to 235 ha of
possible expansions into more sensitive swampy peat lands. This is achieved because the expansion cost
involved for peat land is 12.5 % more than the tropical forest. Therefore, by minimising expansion cost and the
114

carbon penalty cost the model selects the minimum land area that would be needed to meet the demand. The
carbon emission from the optimised selection is 3018.6 tCO2-eq/y whereas the annual emissions from PP 2 –
PP 4 and PP 3 – PP 6 combination is 8934 and 12239.8 tCO2-eq. The optimisation has resulted in avoidance
of 5915.4 – 9221.2 tCO2-eq/y.

5. Conclusion
A MILP model is presented in this work to analyse the minimum expansion required for sago plantations. The
novel contribution of this work is minimal land expansion achieved by minimising the costs associated with
expansion, which includes deforestation, planting and carbon penalty costs due to emissions from LUC. By
considering cost, the model is more practically relevant to developing countries where cost is a major criterion
in decision making compared to other environmental indicators. A case study involving a sago mill company is
solved to illustrate the model. The current work can be extended to other agro value chains as well. The case
study considers only secondary tropical forests and peat lands for expansion though other land types can also
be taken for expansion analysis. Furthermore, environmental and social indicators can also be considered for
future scope of work.

Acknowledgement
Jaya Prasanth Rajakal and co-authors gratefully acknowledges the support provided by the Taylor’s Ph.D.
Scholarship Programme (TUFR/2017/001/01). The technical support from LINDO systems is also
acknowledged.

References
Abdul Samad A. R., Othman M. S., Zariyawati M. A., 2009, A comparison analysis of logging cost between
 conventional and reduce impact logging practices, Journal of Economics and Management, 3(2), 354-366.
Accorsi R., Cholette S., Manzini R., Pini C., Penazzi S., 2016, The land-network problem: Ecosystem carbon
 balance in planning sustainable agro-food supply chains, Journal of Cleaner Production, 112, 158-171.
Fargione, J., Hill, J., Tilman, D., Polasky, S., Hawthorne, P., 2008, Land clearing and the biofuel carbon
 debt. Science, 319, 1235-1238.
Hao L., Su X., Singh V., Ayantobo O., 2017, Spatial Optimization of Agricultural Land Use Based on Cross-
 Entropy Method, Entropy, 19(11), 592.
Jamaludin, N.F., Ab Muis, Z., Hashim, H., 2019, An integrated carbon footprint accounting and sustainability
 index for palm oil mills, Journal of Cleaner Production, 225, 496-509.
Rajakal J. P., Ng D. K. S., Tan R. R., Andiappan V., Wan Y. K, 2019, A mathematical optimisation model for
 analysis of minimal cropland expansion in agro value chains, Sustainable Production and Consumption.
Latif J., Mohd N. M., Tayeb D. M., Kushairi D. А, 2003, Economics of higher planting density in oil palm
 plantations, Oil Palm Industry Economic Journal, 3(2), 32-39.
Li M., Fu Q., Singh V. P., Ji Y., Liu D., Zhang C., Li T., 2019, An optimal modelling approach for managing
 agricultural water-energy-food nexus under uncertainty, Science of the Total Environment, 651, 1416-
 1434.
Mohamad N. H., Yaakub A. N., Hamdan A., Asmah, D., 2016, Commercialization of sago through estate
 plantation scheme in Sarawak: The Way Forward, International Journal of Agronomy, 2016.
Ng L. Y., Andiappan V., Chemmangattuvalappil N. G., Ng, D. K. S, 2015, Novel methodology for the synthesis
 of optimal biochemicals in integrated biorefineries via inverse design techniques, Industrial & Engineering
 Chemistry Research, 54(21), 5722-5735.
Van Fan, Y., Lee, C.T., Lim, J.S., Klemeš, J.J., Le, P.T.K., 2019, Cross-disciplinary Approaches Towards
 Smart, Resilient and Sustainable Circular Economy, Journal of Cleaner Production, 208, 1482 – 1491.
Velasco-Garcia P., Varbanov P. S., Arellano-Garcia H., Wozny G., 2011, Utility systems operation:
 optimisation-based decision making, Applied Thermal Engineering, 31(16), 3196-3205.
Wan Y. K., Ng R. T. L., Ng D. K. S., Tan R. R., 2014, Life Cycle Optimisation of a Sustainable Sago Value
 Chain, Chemical Engineering Transactions, 39, 1537-1542.
Wan Y. K., Ng R. T. L., Ng D. K. S., Aviso K. B., Tan R. R., 2016, Fuzzy multi-footprint optimisation (FMFO)
 for synthesis of a sustainable value chain: Malaysian sago industry, Journal of Cleaner Production, 128,
 62-76.
Wösten, J. H. M., Ritzema, H. P., 2001, Land and water management options for peatland development in
 Sarawak, Malaysia, International Peat Journal, 11, 59-66.
You can also read