Tumor infiltrating lymphocyte clusters are associated with response to immune checkpoint inhibition in BRAF V600E/K mutated malignant melanomas ...
←
→
Page content transcription
If your browser does not render page correctly, please read the page content below
www.nature.com/scientificreports

                OPEN             Tumor infiltrating lymphocyte
                                 clusters are associated
                                 with response to immune
                                 checkpoint inhibition in BRAF
                                 V600E/K mutated malignant
                                 melanomas
                                 Sebastian Klein1,4*, Cornelia Mauch2, Klaus Brinker3, Ka‑Won Noh1, Sonja Knez2,
                                 Reinhard Büttner1, Alexander Quaas1 & Doris Helbig2*

                                 Patients with metastasized malignant melanomas (MM) are regularly treated with immune checkpoint
                                 inhibitors (CPI). Within our study, we evaluated the predictive value of tumor infiltrating lymphocyte
                                 (TIL) clusters in primary MM and its association to molecular subtypes to predict response to CPI
                                 treatment. A cohort of 90 MM patients who received CPI treatment were collected from a single
                                 center, as well as a validation cohort of 351 patients from the TCGA database (SKCM) who received
                                 standard of care. A deep-convolutional-neural network (U-Net) was trained to detect viable tumor
                                 areas on H&E whole-slide-images, following a quantitative detection of TILs with help of a separate
                                 additional neural network. The number of TIL clusters was associated with response to CPI in 90 MM
                                 patients (AUC = 0.6), even more pronounced within the sub-cohort of BRAF V600E/K-mutated MM
                                 patients (AUC = 0.7, n = 32). Interestingly, the TIL clusters in NRAS-mutated as well as wildtype MM
                                 (BRAF-wt, NRAS-wt) tumors, did not demonstrate a predictive value of CPI response (AUC = 0.5,
                                 n = 25). Moreover, PD-L1 expression had a limited predictive value within our cohort. In parallel, within
                                 an independent cohort of MM patients (TCGA, n = 351), the number of TIL clusters was associated
                                 with improved survival in BRAF V600E/K mutated MM (p < 0.0001, n = 164) but neither in NRAS-mutated
                                 (55.7 months vs. 63.0 months, respectively, p = 0.590, n = 85) nor BRAF/NRAS-wildtype MM patients
                                 (52.4 months vs. 47.4 months, respectively, p = 0.581, n = 104). While TILs in MM have been associated
                                 with improved survival, we show—for the first time—that TIL clusters are associated with response to
                                 immunotherapy in BRAF V600E/K mutated MM.

                                 Abbreviations
                                 CNN	Convolutional neural network
                                 CPI	Immune checkpoint inhibitor
                                 CTLA-4	Cytotoxic T-lymphocyte-associated antigen 4
                                 MM	Malignant melanoma
                                 PD-1/PD-L1	Programmed death 1/programmed death-ligand 1
                                 TIL	Tumor-infiltrating lymphocyte

                                 Immune checkpoint inhibitors (CPI) targeting the programmed death 1/programmed death-ligand 1 (PD-1/
                                 PD-L1), as well as the cytotoxic T-lymphocyte-associated antigen 4 (CTLA-4), have demonstrated promising

                                 1
                                  Institute of Pathology, University Hospital Cologne, Cologne, Germany. 2Department of Dermatology,
                                 University Hospital Cologne, Kerpener Strasse 62, 50937 Cologne, Germany. 3Hamm-Lippstadt University of
                                 Applied Sciences, Hamm, Germany. 4Present address: Gerhard‑Domagk‑Institute of Pathology, University
                                 Hospital Münster, Albert‑Schweitzer‑Campus 1, Gebäude D17, Münster, Germany. *email: sebastian.klein@
                                 ukmuenster.de; doris.helbig@uk‑koeln.de

Scientific Reports |   (2021) 11:1834              | https://doi.org/10.1038/s41598-021-81330-4                                         1

                                                                                                                                    Vol.:(0123456789)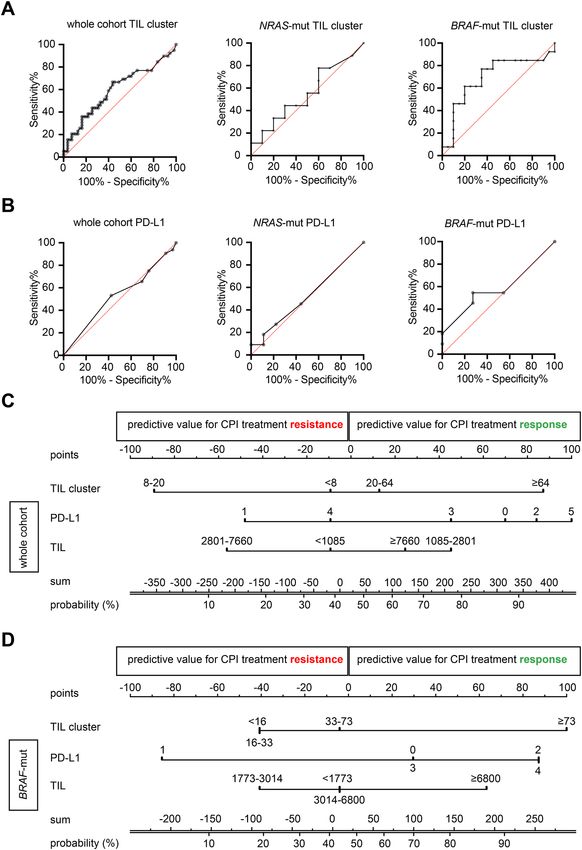
www.nature.com/scientificreports/
and durable antitumor activity, and revolutionized the treatment of metastasized malignant melanoma (MM)
patients1–3. However, a relevant fraction of patients does not benefit from monotherapy or even combined CPI
regimens. Despite controversial study results, CPI treatment responses have been shown to correlate with certain
quantitative markers, such as PD-L1 expression levels, as well as tumor mutational b urden2–7.
Meanwhile, the quantitative assessment of tumor infiltrating lymphocytes (TILs) has been associated with
M8–10. In addition, increased numbers of TILs were linked to response to interferon-
a favorable prognosis in M
alpha treatment in patients with advanced stage M M11. However, to the best of our knowledge, the prognostic
value of TIL quantification from H&E images to immune checkpoint inhibition in MM remains elusive.
To explore the predictive value of quantitative assessment of TILs in malignant melanoma as well as regard-
ing treatment response to CPI, we analyzed a cohort of 90 individuals treated with CPI at a single center, real
world data and validated our findings within an independent cohort of 351 cases of malignant melanomas from
the TCGA database.
Results
Detection of viable tumor areas and tumor infiltrating lymphocyte clusters using digitized
H&E whole‑slide images. To allow a controllable and efficient detection of viable tumor areas and to
avoid a bias of necrotic tumor regions with an accumulation of inflammatory cells, we trained a U-Net deep
convolutional neural network for segmentation of tumor regions using digitized whole-slide images (Fig. 1A).
Subsequently, we generated a neural network to detect TILs within areas of viable tumor cells (Fig. 1A).
Then, we calculated the distribution of TILs within areas of viable tumor cells by using a clustering algorithm
(Fig. 1B–E)12. In addition to a quantitative assessment of TILs, TIL clusters would allow a qualitative assessment
of TIL distribution within MM tumors.
Predictive value of tumor infiltrating lymphocyte clusters within BRAF V600E/K mutated mela‑
noma patients receiving CPI. Having built a deep learning-based CNN for tumor segmentation, as well
as a neural network for detection of TILs, we applied this method to a cohort of 90 malignant melanoma patients
that received immune-checkpoint inhibition (CPI; Table 1) from a single center. Here, the overall predictive
relevance to CPI response of TIL clusters was low (AUC = 0.6, n = 90; Fig. 2A). However, in 32 cases of BRAF
V600E/K mutated MMs, there was a higher predictive value for TIL clusters (AUC = 0.7, n = 32). Within NRAS-
mutated MMs, there was no predictive value of TIL clusters (AUC = 0.5, n = 25).
To compare the predictive value of TIL clusters to CPI treatment, TILs and PD-L1 (Fig. 2B; Table 2), we
generated a nomogram for the whole cohort of MM patients (n = 90) as well as BRAF V600E/K mutated MMs
(n = 32). Here, TIL clusters showed an improved predictive value compared to TILs in the whole cohort as well
as within BRAF V600E/K mutated MMs (Fig. 2C,D). Interestingly, TIL clusters did reveal a predictive value for
both response- and resistance to CPI treatment. There was a correlation between the number of TIL clusters
and response to CPI treatment within BRAF V600E/K mutated MM (Fig. 2D). Elevated numbers of TIL clusters
(above 33) showed a higher probability of response to CPI treatment. Conversely, categorial assessment of PD-L1
showed that scoring of either 2 or 4 were associated with response, while PD-L1 scoring of 1 was linked to resist-
ance to CPI treatment (Fig. 2D). This effect was even pronounced within the whole cohort of MM patients, as
scoring of either 1 or 4 was associated with resistance to CPI treatment, compared to response to CPI treatment
(scores of 3, 0 and 2; Fig. 2C).
Prognostic value of tumor‑infiltrating lymphocyte clusters in molecular subtypes of malig‑
nant melanomas. To validate whether TIL cluster counts were associated with a favorable prognosis
within molecular subtypes of MM, we analyzed an independent cohort of 351 patients from the TCGA data-
base. Interestingly, within BRAF V600E/K mutated MM tumors, the number of TIL clusters was associated with
improved survival (median overall survival rate BRAF V600E/K with low clusters: 48.2 vs. BRAF V600E/K with
high clusters: 86.9 months, p < 0.0001, n = 164; Fig. 3) but this effect was not seen in neither NRAS-mutated MM
patients, (55.7 months vs. 63.0 months, respectively, p = 0.590, n = 85) nor wildtype MM patients (52.4 months
vs. 47.4 months, respectively, p = 0.581, n = 104).
Discussion
There is a clinical need to explore prognostic biomarkers for immune response to immune checkpoint inhibi-
tion in solid cancers—especially within MM—where alternative treatment strategies for molecular subtypes are
available, but CPI treatment may be associated to long-term remission. Here, BRAF V600-mutated MM may
reveal additional treatment options with BRAF and MEK i nhibitors13.
Within our study, we highlight the predictive value of quantitative TIL cluster characterization to CPI
response within BRAF V600-mutated MMs. Recently, there were two clinical trials performing subgroup analy-
ses concerning response rate, progression-free and overall survival including the BRAF mutation s tatus2,3. In
a study by Larkin et al.2, the median overall survival among patients with BRAF-mutated MM was longer in
the Nivolumab-plus-Ipilimumab group (more than 60.0 months; 95% CI, 50.7 to not reached), the Nivolumab
group (45.5 months; 95% CI, 26.4 to not reached) and the Ipilimumab group (24.6 months; 95% CI, 17.9–31.0)
compared to patients without BRAF-mutated MM (Nivolumab-plus-Ipilimumab group: 39.1 months; 95% CI,
27.5 to not reached, Nivolumab group: 34.4 months; 95% CI, 24.1–59.2, Ipilimumab group: 18.5 months; 95%
CI, 14.1–22.7). However, the median progression-free survival was only longer among patients with BRAF muta-
tions in the combination treatment group compared to patients without BRAF mutations (16.8 months; 95% CI,
8.3–32.0 versus 11.2 months; 95% CI, 7.0–18.1). On the other hand, Robert et al. 3 reported that response rates
Scientific Reports | (2021) 11:1834 | https://doi.org/10.1038/s41598-021-81330-4 2
Vol:.(1234567890)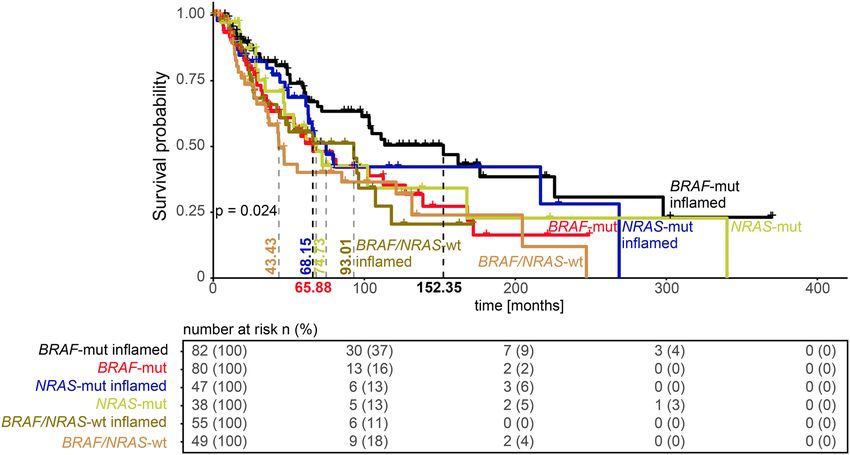
www.nature.com/scientificreports/
Figure 1. Detection of viable tumor areas and TIL clusters using regular H&E whole-slide-images of malignant
melanomas. Illustration of tumor segmentation using regular H&E stains of cases of malignant melanoma,
with visualizations of TIL detection and TIL clustering using single images and combined overlays. (A) H&E
stains of one representative case of malignant melanoma with segmentation of viable tumor areas with help
of a deep convolutional neural network (U-Net). The yellow line represents the segmentation of tumor area,
while necrotic areas are left out. (B) Subsequent TIL detection within viable tumor areas and illustration of TILs
using a density heatmap where red indicates high density of TILs and blue indicates low density, according to
the legend. (C) Visualization of TIL cluster detection. Black circles indicate individual TILs and colored areas
highlight distinct TIL cluster that had been assigned using HDBSCAN12. (D) Overlay of the images from panels
A-C with transparent layers combining H&E image, TIL density heatmap and TIL clusters. (E) Panel of BRAF-
mut (V600E/K) NRAS-mut and BRAF/NRAS-wildtype samples, where the overlay is shown in the upper panel
and the given TIL density heatmap, TIL clustering and H&E images are shown below.
of patients receiving either Ipilimumab or Pembrolizumab were similar in patients with tumors with or without
BRAF V600E/K mutations.
Given the mounting evidence for TILs as a potential biomarker, our study supports to consider the feature
of TIL clusters as a predictive marker for prognosis and response to CPI in MM. Assessing TILs through deep
learning showed a predictive value in BRAF V600E/K melanomas that received CPI treatment from a single
center. These results emphasize the relevance for future studies to potentially deploy TIL clusters as a biomarker
Scientific Reports | (2021) 11:1834 | https://doi.org/10.1038/s41598-021-81330-4 3
Vol.:(0123456789)www.nature.com/scientificreports/
Ipilimumab + Nivolumab
Ipilimumab (n = 40) Pembrolizumab (n = 32) Nivolumab (n = 11) (n = 7)
Mean applications
3.6 ± 0.7 (1–4) 7.9 ± 5.8 (1–23) 8.7 ± 5.2 (3–17) 3.5 ± 0.8 (2–4)
received ± SD (range)
Treatment response
Complete response 2 (5.0%) 0 0 0
Partial response 7 (17.5%) 11 (34.4%) 5 (45.5%) 2 (28.6%)
Stable disease 3 (7.5%) 5 (15.6%) 0 0
Progress 28 (70.0%) 16 (50.0%) 6 (54.5%) 4 (57.1%)
Not evaluable 0 0 0 1 (14.3%)
Stopped treatment due to side
4 (10.0%) 1 (3.1%) 2 (18.2%) 1 (14.3%)
effects
Table 1. CPI treatment results.
for BRAF V600E/K mutated MM, where either immunotherapy or targeted therapies may be considered as treat-
ment regimens.
Material and methods
Patient and tumor characteristics. 90 patients with metastasized MM diagnosed at the University Hos-
pital Cologne receiving first line CPI treatment were included in our study. All patients underwent a clinical
follow-up according to the current treatment guidelines for MM. 40 patients were treated with Ipilimumab
(44.4%; 3 mg/kg body weight every 3 weeks), 32 patients were treated with Pembrolizumab (35.6%; 2 mg/kg
every 3 weeks) and 11 patients were treated with Nivolumab (12.2%, 3 mg/kg body weight every 2 weeks). Other
7 patients (7.8%) received Ipilimumab 3 mg/kg in combination with Nivolumab 1 mg/kg body weight every
3 weeks. Treatment response was categorized as disease control (partial/complete response or stable disease)
versus disease progression according to RECIST criteria (Table 1). In general, there were more patients with
disease control under Nivolumab and Pembrolizumab versus Ipilimumab (Table 1). Termination of treatment
due to side effects was the highest in the Nivolumab (18.2%) and combination treatment group (14.3%; Table 1).
There were no significant differences in sex, patient age at initial diagnosis or treatment initiation, tumor depth,
localization, or subtype as well as mutation (BRAF, NRAS mutation or wildtype) and PD-L1 status in the differ-
ent monotherapy groups. The small group of combination therapy (n = 7) contained more male patients harbor-
ing melanomas with higher Breslow index. Cases from the TCGA database received standard of care, which did
not include CPI treatment at the time of sample processing.
Molecular subtyping of MM samples. Molecular subtyping of single center cases of malignant melano-
mas was conducted using a targeted panel sequencing approach, covering NRAS (exon 2, 3, 4) and BRAF (exon
11, 15) among other genes as described previously14–16. Activating mutations for BRAF and NRAS were anno-
tated for both TCGA and internal data17–19. Absence of known activating mutations in either BRAF or NRAS
was considered as wildtype (BRAF/NRAS-wildtype; BRAF-wt/NRAS-wt), while cases with either BRAF or NRAS
activating mutations were considered as BRAF-V600E/K or NRAS-mutated (BRAF-mut/NRAS-mut).
Whole‑slide‑images and processing. Regular H&E stained slides, following standard protocols, were
scanned using a NanoZoomer S360 (Hamamatsu Photonics) whole-slide scanning device at a 40X magnifica-
tion, as well as slides from the TCGA database being scanned 20X using Leica Aperio slide scanning devices. All
digitized slides were evaluated for image quality and included, if more than 90% of the tissue area was in focus.
All tumors investigated were primary melanomas excised before beginning of the CPI treatment.
Image segmentation, object detection and clustering. A U-Net was trained to detect vital tumor
areas on H&E MM virtual whole slide images20. For this purpose, images were annotated using whole slide
images by a trained pathologist. To generate a training dataset that would reflect the heterogeneity that can be
observed within MM tumors, 92 image tiles (10,000 × 10,000 pixels, resized to 1000 × 1000 for further training
purpose) from a total of 35 cases were used, with an image patch size of 256 pixels for the network to be pro-
cessed. Training was performed using TCGA cases, as well as cases from a set of internal cases, while all cases
were independent to the test set. Training was done on a NVIDIA RTX 6000 using the PyTorch framework and
Adam as an optimizer. Several augmentation steps were applied, including grey-scale augmentation with a ten
percent probability21. For TIL object detection, we followed a similar approach that has already been published22.
To efficiently identify the number of TIL clusters, we used the HDBSCAN a lgorithm12.
PD‑L1 expression on tumor cells. A tumor cell was considered PD-L1 positive if the cell membrane was
partially or completely stained, whereas cytoplasmic PD-L1 staining was not considered as a specific immune
signal. The tumor proportion score was determined as previously published23.
Statistical analysis. The area under the receiver-operator-curve (ROC curve) was calculated based on
the overall ability of the given attributes to discriminate between patients that either responded or progressed
Scientific Reports | (2021) 11:1834 | https://doi.org/10.1038/s41598-021-81330-4 4
Vol:.(1234567890)www.nature.com/scientificreports/
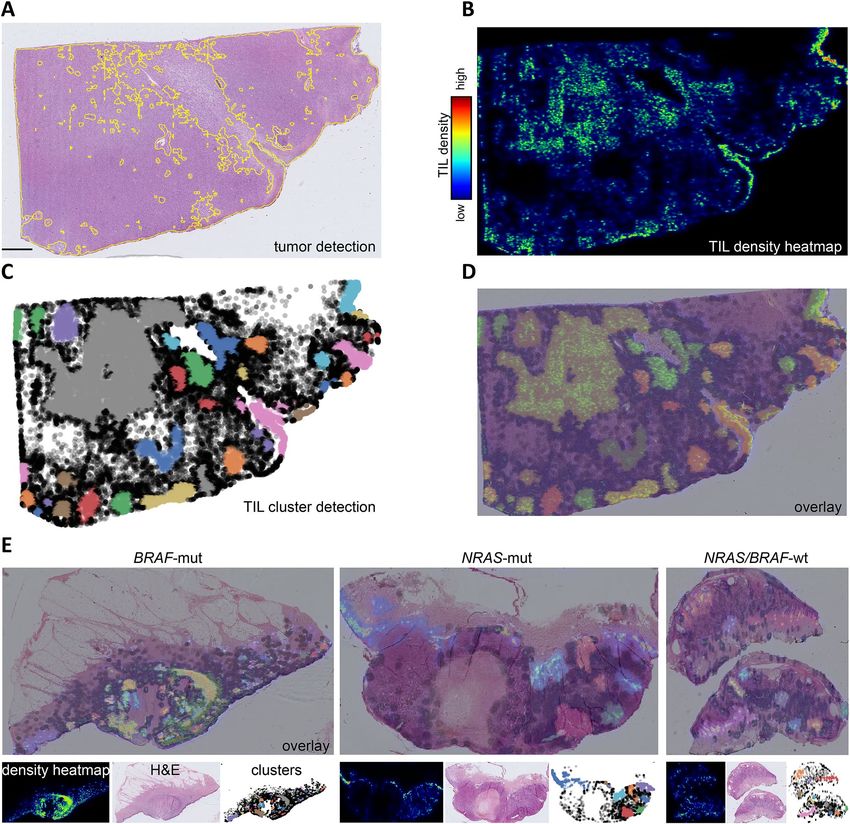
Figure 2. Predictive value of TIL clusters in malignant melanoma subsets. Overview of predictive value of TIL
clusters according to molecular subtypes of malignant melanoma using individual ROC curves and a nomogram
combining several attributes and their predictive value to predict response to CPI treatment. (A) Area under the
curve for TIL clusters for different mutation types of MM tumors (BRAF-mut; BRAF V600E/K). (B) Area under
the curve for PD-L1 scoring for different MM mutation subtypes. (C) Nomogram for the whole cohort of MM
patients (n = 90). (D) Nomogram for the BRAF-mutated (BRAF-mut; BRAF V600E/K) sub cohort (n = 32) of MM
patients. The positive values (points) indicate the prediction towards responses, while negative values reflect the
predictive value for therapy resistance.
Scientific Reports | (2021) 11:1834 | https://doi.org/10.1038/s41598-021-81330-4 5
Vol.:(0123456789)www.nature.com/scientificreports/
Disease control (complete/partial response, stable disease) Treatment non-responders (progress) p
All CPI treatments (n = 78)
PD-L1
Positive 13 14 0.447
Negative 20 31
All anti-PD-1 treatments (nivolumab, pembrolizumab, ipilimumab + nivolumab)
PD-L1
Positive 8 8 1.0
Negative 15 15
Ipilimumab
PD-L1
Positive 5 6 0.215
Negative 5 16
Nivolumab
PD-L1
Positive 0 1 1.0
Negative 5 5
Pembrolizumab
PD-L1
Positive 7 5 0.654
Negative 9 9
Ipilimumab + Nivolumab
PD-L1
Positive 1 2 1.0
Negative 1 1
Table 2. Predictive value of PD-L1 score concerning treatment outcome.
Figure 3. Prognostic value of TIL clusters within molecular subtypes of malignant melanomas. Kaplan–Meier
curve of TCGA MM patients (n = 351) stratified for mutational subtypes (BRAF-mutated, NRAS-mutated, and
BRAF/NRAS wildtype). Inflamed tumors are indicated according to their molecular subtype, while inflamed
tumors are defined as tumors with TIL clusters above the median value as a cutoff. The median survival time
for each molecular subtype and inflammatory status is provided using a vertical line and indicated in letters
according to their color code. The risk table is shown below for the given subgroups.
under immune-checkpoint inhibition therapy. To visualize the effects of the attributes on the class probabilities
(response/progress under therapy), we generated a nomogram using a Naïve-Bayes classifier that was trained
on the attributes of treatment results as described p reviously24. Statistical analysis was performed with Python
(version 3.7, https://www.python.org/), R, the R Project (version 4.0.3, https://www.r-project.org/) and the sta-
tistical software package IBM SPSS (version 25.0). Statistical testing was carried out by using X2 test, Fisher’s test
Scientific Reports | (2021) 11:1834 | https://doi.org/10.1038/s41598-021-81330-4 6
Vol:.(1234567890)www.nature.com/scientificreports/
or Student’s t-test. Survival rates were calculated by the Kaplan–Meier method and compared using log-rank.
p < 0.05 was considered to be significant.
Ethics approval. The study protocol conformed to the ethical guidelines of the 1975 Declaration of Helsinki
and was approved by the Ethics Committee of the Medical Faculty of University of Cologne (Registration No.
08-144). Informed consent has been obtained.
Data availability
Data supporting the findings of this manuscript are available from the corresponding author upon reasonable
request.
Received: 12 November 2020; Accepted: 5 January 2021
References s
1. Hodi, F. S. et al. Improved survival with ipilimumab in patients with metastatic melanoma. N. Engl. J. Med. 363, 711–723. https://
doi.org/10.1056/NEJMoa1003466 (2010).
2. Larkin, J. et al. Five-year survival with combined nivolumab and ipilimumab in advanced melanoma. N. Engl. J. Med. 381, 1535–
1546. https://doi.org/10.1056/NEJMoa1910836 (2019).
3. Robert, C. et al. Pembrolizumab versus ipilimumab in advanced melanoma (KEYNOTE-006): post-hoc 5-year results from an
open-label, multicentre, randomised, controlled, phase 3 study. Lancet Oncol. 20, 1239–1251. https://doi.org/10.1016/S1470
-2045(19)30388-2 (2019).
4. Goodman, A. M. et al. Tumor mutational burden as an independent predictor of response to immunotherapy in diverse cancers.
Mol. Cancer Ther. 16, 2598–2608. https://doi.org/10.1158/1535-7163.Mct-17-0386 (2017).
5. Herbst, R. S. et al. Predictive correlates of response to the anti-PD-L1 antibody MPDL3280A in cancer patients. Nature 515,
563–567. https://doi.org/10.1038/nature14011 (2014).
6. Patel, S. P. & Kurzrock, R. PD-L1 expression as a predictive biomarker in cancer immunotherapy. Mol. Cancer Ther. 14, 847–856.
https://doi.org/10.1158/1535-7163.Mct-14-0983 (2015).
7. Taube, J. M. et al. Association of PD-1, PD-1 ligands, and other features of the tumor immune microenvironment with response
to anti–PD-1 therapy. Clin. Cancer Res. 20, 5064–5074. https://doi.org/10.1158/1078-0432.Ccr-13-3271 (2014).
8. Azimi, F. et al. Tumor-infiltrating lymphocyte grade is an independent predictor of sentinel lymph node status and survival in
patients with cutaneous melanoma. J. Clin. Oncol. 30, 2678–2683. https://doi.org/10.1200/jco.2011.37.8539 (2012).
9. Clemente, C. G. et al. Prognostic value of tumor infiltrating lymphocytes in the vertical growth phase of primary cutaneous mela-
noma. Cancer 77, 1303–1310. https://doi.org/10.1002/(SICI)1097-0142(19960401)77:7%3c1303::AID-CNCR12%3e3.0.CO;2-5
(1996).
10. Saltz, J. et al. Spatial organization and molecular correlation of tumor-infiltrating lymphocytes using deep learning on pathology
images. Cell Rep. 23, 181-193.e187. https://doi.org/10.1016/j.celrep.2018.03.086 (2018).
11. Moschos, S. J. et al. Neoadjuvant treatment of regional stage IIIB Melanoma with high-dose interferon Alfa-2b induces objec-
tive tumor regression in association with modulation of tumor infiltrating host cellular immune responses. J. Clin. Oncol. 24,
3164–3171. https://doi.org/10.1200/jco.2005.05.2498 (2006).
12. McInnes, L., Healy, J. & Astels, S. hdbscan: hierarchical density based clustering. J. Open Sour. Softw. 2, 205. https: //doi.org/10.21105
/joss.00205(2017).
13. Eroglu, Z. & Ribas, A. Combination therapy with BRAF and MEK inhibitors for melanoma: latest evidence and place in therapy.
Ther. Adv. Med. Oncol. 8, 48–56. https://doi.org/10.1177/1758834015616934 (2015).
14. Klein, S. et al. Integrative analysis of pleomorphic dermal sarcomas reveals fibroblastic differentiation and susceptibility to immu-
notherapy. Clin. Cancer Res. 26, 5638–5645. https://doi.org/10.1158/1078-0432.CCR-20-1899 (2020).
15. Ihle, M. A. et al. Comparison of high resolution melting analysis, pyrosequencing, next generation sequencing and immunohis-
tochemistry to conventional Sanger sequencing for the detection of p.V600E and non-p.V600E BRAF mutations. BMC Cancer
14, 13. https://doi.org/10.1186/1471-2407-14-13 (2014).
16. Helbig, D. et al. Oncogene and therapeutic target analyses in atypical fibroxanthomas and pleomorphic dermal sarcomas. Oncotarget
7, 21763–21774. https://doi.org/10.18632/oncotarget.7845 (2016).
17. Hoadley, K. A. et al. Cell-of-origin patterns dominate the molecular classification of 10,000 tumors from 33 types of cancer. Cell
173, 291-304.e296. https://doi.org/10.1016/j.cell.2018.03.022 (2018).
18. Chakravarty, D. et al. OncoKB: a precision oncology knowledge base. JCO Precis. Oncol. https://doi.org/10.1200/po.17.00011
(2017).
19. Cerami, E. et al. The cBio cancer genomics portal: an open platform for exploring multidimensional cancer genomics data. Cancer
Discov. 2, 401–404. https://doi.org/10.1158/2159-8290.Cd-12-0095 (2012).
20. Ronneberger, O., Fischer, P. & Brox, T. U-net: convolutional networks for biomedical image segmentation. 2015, pp. 234–241.
https://doi.org/10.1007/978-3-319-24574-4_28 (2015).
21. Klein, S. et al. Deep learning predicts HPV-association in oropharyngeal squamous cell carcinomas and identifies patients with a
favorable prognosis using regular H&E stains. Clin. Cancer Res. https://doi.org/10.1158/1078-0432.CCR-20-3596 (2020).
22. Acs, B. et al. An open source automated tumor infiltrating lymphocyte algorithm for prognosis in melanoma. Nat. Commun. 10,
5440. https://doi.org/10.1038/s41467-019-13043-2 (2019).
23. Scheel, A. H. et al. Harmonized PD-L1 immunohistochemistry for pulmonary squamous-cell and adenocarcinomas. Mod. Pathol.
29, 1165–1172. https://doi.org/10.1038/modpathol.2016.117 (2016).
24. Možina, M., Demšar, J., Kattan, M. & Zupan, B. Nomograms for Visualization of Naive Bayesian Classifier. In Knowledge Discovery
in Databases: PKDD 2004. PKDD 2004. Lecture Notes in Computer Science Vol. 3202 (eds Boulicaut, J. F. et al.) (Springer, Berlin ,
2004). https://doi.org/10.1007/978-3-540-30116-5_32.
Author contributions
S.K. study design, methodical conception, drafting of the manuscript, formal analysis; C.M. formal analysis, data
acquisition; manuscript reviewing K.B. methodical conception, formal analysis, manuscript reviewing; K.W.N.
data acquisition, manuscript reviewing; S.Kn. data acquisition, manuscript reviewing; R.B. data acquisition,
manuscript reviewing; A.Q. study design, data acquisition, manuscript reviewing; D.H. study design, drafting
of the manuscript, formal analysis.
Scientific Reports | (2021) 11:1834 | https://doi.org/10.1038/s41598-021-81330-4 7
Vol.:(0123456789)www.nature.com/scientificreports/
Funding
Open Access funding enabled and organized by Projekt DEAL. Funded by the Deutsche Forschungsgemeinschaft
(DFG, German Research Foundation) - Project-ID 73111208 - SFB 829 (Z4 to D.H. and C.M.). SK, KB, AQ,
RB received funding for this work from the European Union Fonds for Regional development (EFRE) and the
German State of North Rhine Westphalia (NRW).
Competing interests
The authors declare no competing interests.
Additional information
Correspondence and requests for materials should be addressed to S.K. or D.H.
Reprints and permissions information is available at www.nature.com/reprints.
Publisher’s note Springer Nature remains neutral with regard to jurisdictional claims in published maps and
institutional affiliations.
Open Access This article is licensed under a Creative Commons Attribution 4.0 International
License, which permits use, sharing, adaptation, distribution and reproduction in any medium or
format, as long as you give appropriate credit to the original author(s) and the source, provide a link to the
Creative Commons licence, and indicate if changes were made. The images or other third party material in this
article are included in the article’s Creative Commons licence, unless indicated otherwise in a credit line to the
material. If material is not included in the article’s Creative Commons licence and your intended use is not
permitted by statutory regulation or exceeds the permitted use, you will need to obtain permission directly from
the copyright holder. To view a copy of this licence, visit http://creativecommons.org/licenses/by/4.0/.
© The Author(s) 2021
Scientific Reports | (2021) 11:1834 | https://doi.org/10.1038/s41598-021-81330-4 8
Vol:.(1234567890)You can also read