The Lithium-Ion Battery Value Chain - F-Cell Conference Stuttgart October 09, 2012 - Messe Sauber Agentur

Page created by Thelma Armstrong
 
CONTINUE READING
The Lithium-Ion Battery Value Chain - F-Cell Conference Stuttgart October 09, 2012 - Messe Sauber Agentur
The Lithium-Ion Battery Value
Chain
F-Cell Conference

Stuttgart October 09, 2012

                             26_09_12The Lithium-Ion Battery_V06.pptx   1
The Lithium-Ion Battery Value Chain - F-Cell Conference Stuttgart October 09, 2012 - Messe Sauber Agentur
Content

 Introduction
 Global Market Overview on Li-ion Batteries
 Automotive xEV
 Electric Storage Systems (ESS)
 Cell Manufacturing Economics
 Technology Roadmap and Future Trends
 Battery Systems Cost Projections
 Conclusions

                                              26_09_12The Lithium-Ion Battery_V06.pptx   2
The Lithium-Ion Battery Value Chain - F-Cell Conference Stuttgart October 09, 2012 - Messe Sauber Agentur
Introduction

               26_09_12The Lithium-Ion Battery_V06.pptx   3
The Lithium-Ion Battery Value Chain - F-Cell Conference Stuttgart October 09, 2012 - Messe Sauber Agentur
Roland Berger has extensive project experience in all aspects of the
(Automotive) battery market
CLIENTS                 SELECTED PROJECTS
                        > Market and technology studies Li-Ion batteries for raw material suppliers
                          (3 projects with focus battery value chain on Japan, Korea, and China)
                        > Production cost benchmarking for Li-Ion battery materials (cathode, anode, separator, electrolytes)
                        > Market entry studies Cathode Active Materials (CAM)
                        > Acquisition target search for battery materials (CAM, electrolytes)
                        > Market study and partnering strategy for global Japanese manuf. of Li-Ion batteries
                        > Site selection Europe for Japanese Li-Ion manufacturer
                        > Market studies on the global LiB market for passenger cars and commercial vehicles as well as
                          for other industries (High end consumer goods, ESS)
                        > Market entry strategy Europe for Asian battery manufacturer
                        > Strategy development for European battery manufacturer
                        > Strategy development Commercial vehicle for Asian battery manufacturer
                        > Analysis of standardization impact on European Li-Ion-battery market
                        > Trend analysis eMobilty in the Triad for Chinese battery manufacturer / State-owned EV manufacturer
                          association
                        > European key-account strategy for overseas battery manufacturer
                        > Study on use of different battery types for European battery manufacturer association

Source: Roland Berger                                                                               26_09_12The Lithium-Ion Battery_V06.pptx   4
The Lithium-Ion Battery Value Chain - F-Cell Conference Stuttgart October 09, 2012 - Messe Sauber Agentur
Global Market Overview on Li-ion Batteries

                                             26_09_12The Lithium-Ion Battery_V06.pptx   5
The Lithium-Ion Battery Value Chain - F-Cell Conference Stuttgart October 09, 2012 - Messe Sauber Agentur
Worldwide Li-ion battery market by value and volume (2011)

Worldwide Li-ion battery market by volume              Worldwide Li-ion battery market by value
TOTAL CELLS: 4.5 BN                                    TOTAL VALUE USD 9.3 BN

                                        Others                                  Others

                                        4%                                     6%
                              3% 3%                                       3% 2%
                       4%                        25%                                               23%
                                                                         3%
                     4%                                             3%
                                                                   4%
                   5%
                                                                 5%

                 12%
                                                                  13%                                    21%
                                                 23%
                                17%
                                                                                17%

Source: Avicenne Compilations, March 2011                                                26_09_12The Lithium-Ion Battery_V06.pptx   6
The Lithium-Ion Battery Value Chain - F-Cell Conference Stuttgart October 09, 2012 - Messe Sauber Agentur
Battery market by major applications

Li-ion battery sales, worldwide, 2000-2011 [USD m]
10,000

 9,000

 8,000
                                                                                                                                 Others
 7,000

 6,000

 5,000
                                                                                                                                 Portable
 4,000                                                                                                                           PCs

 3,000

 2,000                                                                                                                           Cellular
 1,000                                                                                                                           Phones

       0
               2000          2001           2002   2003   2004   2005   2006   2007   2008   2009       2010          2011

Source: Avicenne Compilations, March 2011                                                      26_09_12The Lithium-Ion Battery_V06.pptx     7
The Lithium-Ion Battery Value Chain - F-Cell Conference Stuttgart October 09, 2012 - Messe Sauber Agentur
Automotive xEV

                 26_09_12The Lithium-Ion Battery_V06.pptx   8
The Lithium-Ion Battery Value Chain - F-Cell Conference Stuttgart October 09, 2012 - Messe Sauber Agentur
There are different options for electrifying powertrains –
Technical layout depending on application and vehicle segment
                                                                                    PURE ELECTRIC DRIVING POSSIBLE
Micro/mild hybrid                            Full hybrid (PHEV option)                                  PHEV                                      EV
Belt-driven             Integrated           Parallel                 Power-split     Second             Serial hybrid     Serial hybrid          Battery
starter-                starter-             hybrid                   hybrid          electric           (parallel option) (range                 electric vehicle
generator               generator                                                     axle                                 extended)

  1)

                                   2)

                                               Mixed operation, incl. long distance                                       Urban/rural             Urban
                                               > Upper medium class/premium class, large SUVs, sports cars,               > Mid-size cars,        > Mini & small
Main applications                                transporters/vans                                                          MPVs, small             cars, small vans,
(vehicle segments)                                                                                                          SUVs, light             mini vans, fun
                                                                                                                            delivery trucks,        cars
                                                                                                                            sports cars
       Engine           Gears            Clutch          HV E-Machine
1) Belt-driven starter-generator   2) Integrated starter-generators

Source: Roland Berger                                                                                                        26_09_12The Lithium-Ion Battery_V06.pptx   9
The Lithium-Ion Battery Value Chain - F-Cell Conference Stuttgart October 09, 2012 - Messe Sauber Agentur
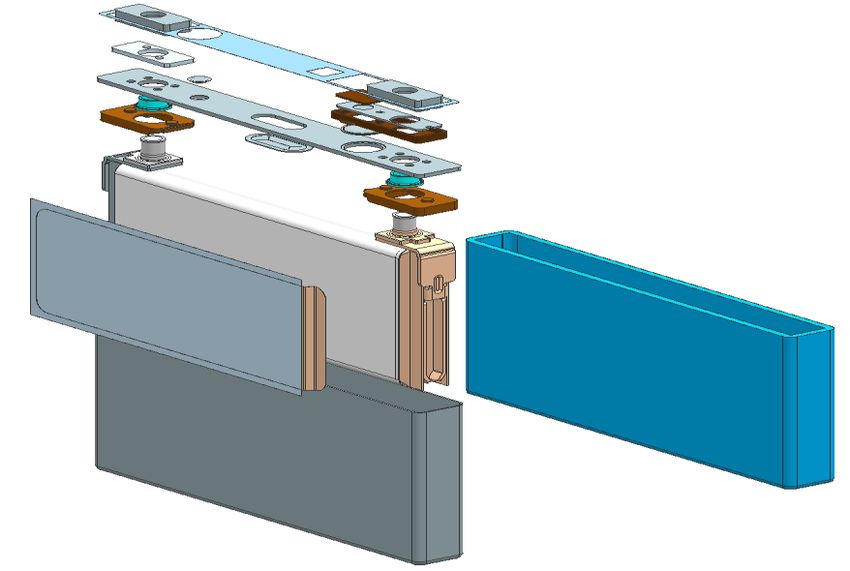
Battery capacity assumptions were used wherever first hand data
was unavailable

Battery specification assumptions
                                                                 BATTERY CAPACITY   BATTERY POWER
Light                   Mild                                          0.5 kWh           40-45 kW
vehicles
                        Full                                          1.4 kWh           40-45 kW
                        PHEV Parallel                                 12 kWh           85-100 kW
                        PHEV serial                                   12 kWh          100-110 kW
                        EV                                            22 kWh          100-110 kW
Buses                   HEV                                           12 kWh             120 kW
                        EV                                            70 kWh             120 kW
Trucks                  MD - HEV                                       9 kWh              90 kW
                        MD - EV                                       70 kWh              90 kW
                        HD - HEV                                      12 kWh             120 kW
                        HD - EV                                       100 kWh            120 kW

Source: Expert interviews, industry reports, Roland Berger analysis                                 26_09_12The Lithium-Ion Battery_V06.pptx   10
Despite stagnating growth in Triad markets, vehicle sales are
developing strongly due to emerging markets' growth

Automotive – End-user user markets
                         Passenger vehicles [m]                              Trucks [m]                                    Buses [m]
Market                   PC + LCV (Class 1-3)                                Class 4+
develop-                                                              89.2
                                                  83.5
ment                           75.8

                                                                                   2.0            2.7             3.4                            0.5              0.6
                                                                                                                                 0.4

                               2011               2015                2020        2011           2015            2020           2011            2015             2020

Comment                  > Global passenger car sales are expected           > Rising global transportation demand will    > Bus sales are largely replacement sales,
                           to grow at 2% and 1% annually through               lead to strong growth especially in heavy     as bus fleets, especially in emerging eco-
                           2015 and 2020                                       truck sales                                   nomies, are being successively upgraded
                         > While TRIAD markets are largely                   > Annual growth between 2011 and 2015         > Annual growth between 2011 and 2015
                           stagnating, China, India and Brazil are the         will be 8%, between 2015 and 2020 a           will be 5%, between 2015 and 2020 a
                           main growth drivers                                 further 5%                                    further 4%

Source: Expert interviews, industry reports, Roland Berger analysis                                                                26_09_12The Lithium-Ion Battery_V06.pptx   11
Hybrids and will be adopted widely on passenger vehicles and
trucks, while plug-in and EV penetrations rates remain lower

Automotive – HEV, PHEV, EV penetration
                        Passenger vehicles [%]                                            Trucks [%]                                            Buses [%]
EV-                                                                             9%
penetra-                                                                      (8 Mio.)

tion                                                                                                                             3%
                                                                                                                                 (0,136 Mio.)

                                         3%                                                           2%
                                         (2.5 Mio.)                     2%
                         2%                                                                           (0,054 Mio.)
                                                                        (~2 Mio. )
                         (1.5 Mio.)                                                                                              1%
                                            1%                                                                                   (0,068 Mio.)                                      0,01%
                                                                             1%                                                                                      0.01%
                                            (0.84 Mio.)                                      0%                                                                                    (0,012 Mio.)
                              0%                                             (~1 Mio. )                        1% (0,027 Mio.)                      0.00%        (0,0005 Mio.)

                                                  (0.4 Mio.)                                                                                                                           0.01%
                                                                                                                                                                                       (0,006 Mio.)
                         2011                   2015                    2020              2011                2015                 2020         2011                2015                 2020

Comment                 > Mild or full hybrids penetration will increase                  > HEVs will be installed on long-haul trucks          > Hyrbid and EV-penetration remains low in
                          strongly as OEMs struggle to meet new                             to lower overall fuel consumptions                    the bus segment, as alternative
                          emission standards                                                                                                      technologies, such as CNG are given
                                                                                          > EVs will be used on in short heavy duty
                                                                                                                                                  preference over hybridization and
                        > PHEV and EV sales remain highly                                   hauling at warehousing facilities
                                                                                                                                                  electrification
                          susceptible to extraneous changes
                                                                                                                                                > No PHEVs in this segment

          HEV            PHEV              EV
Source:   Expert interviews, industry reports, Roland Berger analysis                                                                                   26_09_12The Lithium-Ion Battery_V06.pptx      12
In terms of total energy demand, passenger vehicles will contribute
by far the largest share

Automotive – Total energy demand
                         Passenger vehicles [GWh]                            Trucks [GWh]                                     Buses [GWh]
Market                   PC + LCV (Class 1-3)                                Class 4+
                                                                       45
develop-
ment                                                                   7

                                                                       23
                                                     19
                                                          3
                                                 4
                                                                                                                   4.1
                                 3                   12                15                          2.1                1.2                                            0.01
                                                                                                                                   0.00            0.00
                                                                                   0.2          1.7 0.4         2.9

                               2011               2015                2020        2011            2015            2020            2011             2015             2020

Comment                  > HEVs only account for a small portion of          > HEVs will installed mainly on long-haul        > Hybrid and EV-penetration remains low in
                           the total energy demand                             trucks to lower overall fuel consumptions        the bus segment, as alternative
                                                                                                                                technologies, such as CNG are given
                         > All three segment will grow by between            > EVs will be used mainly on in short heavy
                                                                                                                                preference over hybridization and
                           50% and 70% between 2011 and 2015 and               duty hauling, e.g. at warehousing facilities
                                                                                                                                electrification
                           by up to 50% thereafter
                                                                                                                              > No PHEVs in this segment
     HEV          PHEV           EV

Source: Expert interviews, industry reports, Roland Berger analysis                                                                   26_09_12The Lithium-Ion Battery_V06.pptx   13
In Passenger vehicles, especially Korean manufacturers dominate
the non-captive markets

Key industry participants in 2015 (Passenger vehicles)
Expected 2015 global market share1) [USD based2)]                                         Expected 2015 global market share1) [kWh based]
∑ = USD 8.6 bn                                                                            PHEV and                       Others
                                                                                          EV [kWh]                                28%               28%
                                                                              23%

                                                                                                                                  9%                15%
                                                             16%                                                                       10%
                                                                                                                                              11%
               3)                                                                                                                  3)
                                                       13%

                                               9%                                         HEV [kWh]                                Others                             3)

                                              8%                                                                                        13%
                                                                                                                                 2%                 27%
                                                                                                                               10%
                                         7%
                                                                                                                               11%
                                                                                                                                       12%       24%
                               3%

1) Accuracy level: +/- 2%     2) Market value derived using USD 730/kWh for hybrids, USD 560/kWh for PHEV, and USD 400/kWh for EV in 2015       3) Includes Primearth's share

Source: Roland Berger LiB market model                                                                                                   26_09_12The Lithium-Ion Battery_V06.pptx   14
ESS

      26_09_12The Lithium-Ion Battery_V06.pptx   15
Lithium-ion batteries are still at an early stage of development in
ESS applications and growth patterns remain volatile

ESS – End-user markets and LiB penetration
                         Total newly installed storage                       Newly installed LiB storage
                         capacity [GW]                                       capacity [GW]                                    Average discharge rate [h]
Market                                                                                                                                           4                      4
                                                                      10.9

                                                                                                                               2

                                                   3.4
                                                                                                                  2.6

                                0.1                                                               0.6
                                                                                   0.0

                               2011              2015                 2020        2011           2015            2020         2011               2015                 2020

Comment                  > Strong growth in installation of renewable        > Lithium-ion power are but one in               > Average discharge rates will increase also,
                           energy power plants will create a growing           a range of technologies competing in this        as Lithium batteries are deployed more
                           demand for on-grid energy storage or load-          segment                                          widely in the
                           leveling applications                                                                                6-12 our storage range
                                                                             > Unlike in other segments LiB installation is
                                                                               somewhat volatile depending on projects
                                                                               undertaken in any given year

Source: Expert interviews, industry reports, Roland Berger analysis                                                                   26_09_12The Lithium-Ion Battery_V06.pptx   16
Energy Demand Forecast

Forecast
                         Energy demand [GWh]                                  COMMENT
Market                                                                        > Demand for Lithium-type ESS
                                                                       10.4     applications will grow by 35%
                                                                                annually on average between 2015
                                                                                and 2020

                                                                 2.3

                                     0.0

                                   2011                         2015   2020

Source: Expert interviews, industry reports, Roland Berger analysis                   26_09_12The Lithium-Ion Battery_V06.pptx   17
In terms of GWh RB forecast largely aligned in non-automotive
segments; major difference in automotive segment forecast

GWh forecast comparison with Avicenne
Forecast comparison with Avicenne by seg't [GWh]                        Forecast comparison with Auto vs. Non-auto [GWh]

           2011                         2015             2020                    2011             2015                         2020

                                                        134                                                                  134

                                                                104                                                           49        104
                                                        10
                                                                                                                                         33
                                   66                             0                          66
                                               56                                                        56
                                                        29                                   21          12
                                                                 27                                                           85
     26         26                                      23                26         26                                                  71
                                   19                            4                           45
                                               19                                                        43
     11                                                 18       25       23         24
                11                 14           9

  Roland        Avi-              Roland    Avi-       Roland    Avi-   Roland       Avi-   Roland    Avi-                 Roland       Avi-
  Berger       cenne              Berger   cenne       Berger   cenne   Berger      cenne   Berger   cenne                 Berger      cenne

     E-bikes            Tablets            Notebooks                     Auto
     Power tools        ESS                PHEV                          Non-auto
     HEV                Mobile phones      EV

Source: Roland Berger, Avicenne                                                                          26_09_12The Lithium-Ion Battery_V06.pptx   18
Cell Manufacturing Economics

                               26_09_12The Lithium-Ion Battery_V06.pptx   19
We use a realistic reference cell for our analysis throughout this
study – Over 96 Wh

Typical 96 Wh PHEV cell – Cell specifications
CELL DESIGN
                                                MAIN SPECIFICATIONS
                                                > 26 Ah/3.7 V
                                                > Energy capacity: > 96 Wh
                                                > Specific energy: 135 Wh/kg
                                                > Cell dimensions: 85 x 173 x 21 mm
                                                > Active materials:
                                                  – Cathode: NCM ternary mix
                                                  – Anode: Graphite mixture
                                                  – Electrolyte: EC/DMC/EMC 1m LiPF6
                                                  – Separator: PE (20µm)
                                                > Prismatic Al-housing (0.8 mm) including lid and
                                                  feed-throughs (Al, Cu posts )
                                                > Major area of application in PHEVs

Source: Roland Berger                                                     26_09_12The Lithium-Ion Battery_V06.pptx   20
In a typical 96 Wh PHEV cell cathode material1) accounts for up to
39% of cell material costs

Typical 96 Wh PHEV cell – Cell cost structure 2015
Cell cost breakdown, 2015                                                       Cell material cost split, 2015
Total cost: approximately USD 23.3/cell (~ 243 USD/kWh)                                              USD 13.4/cell

                                      Margin
                                                                                        ~24%
                         SG&A               5%                                       of total cell       39%          Cathode
          Overheads             10%                                                     costs
            Labour     1%
          Energy/ 6%
          Utilities 0%                                                                                   18%          Anode

                                                             58% Raw material                            13%          Electrolyte
       D&A       18%
                                                                                                         19%          Separator
       Equipment                    0%
                                                                                                                      Housing and
                                   2%
             D&A Building                                                                                 11%         feed-througs
               Quality/                                                                               Material cost
               Evironmental                                                                           breakdown

1) Including carbon black content, foil and binder cost

Source: Expert interviews, Roland Berger price calculation                                                26_09_12The Lithium-Ion Battery_V06.pptx   21
... while CAM raw materials nickel, cobalt and manganese and
lithium account for as much as 63% of cathode material cost

Typical 96 Wh PHEV cell – Cathode cost structure (NCM ternary mix CAM) 2015
Cathode cost breakdown, 20151)                                                                            Cathode material cost split, 2015
Total cost: approximately USD 5.22/cell                                                                                               USD 3.28/cell

                       SG&A Margin                                                                                                           20%         Nickel (>99.8%)
             Overheads        5%
                 Labour    7%
           Energy/      1%                                                                                           ~45%
                           0%                                                                                  of total Cathode              33%         Cobalt (>99.3%)
           Utilities 9%
                                                                                                                     costs

                                                                                                                                             7%          Manganese
    D&A         9%
    Equipment         0%                                                                                                                        12% Lithium carbonate
   D&A Building    3%                                          63%                                                                        1%        Carbon black
                                                                       Raw material
    Maintanance 3%
                                                                                                                                             25%         Al foil (20 µ)
      Quality /
      Evironmental                                                                                                                                       PVDF Binder
                                                                                                                                            3%
                                                                                                                                        Material cost
                                                                                                                                        breakdown
1) Carbon black, foil and binder manufacturing costs included in raw material cost, manufacturing costs shown are those of the CAM manufacturer. Excluding carbon black, foil and
   binder cost, raw material share equals 55%

Source: Expert interviews, Roland Berger price calculation                                                                                   26_09_12The Lithium-Ion Battery_V06.pptx   22
According to our bottom-up calculation, declining cell prices will put
pressure on CAM and cell manufacturer margins in 2015

Typical 96 Wh PHEV cell – Cell price breakdown 2015
                                                                                                                                            COMMENT
  Other                              CAM                                                               Cell                       Market
                                                                                                             Cell price
 materials1)        CAM cost        margin                            Cell cost                       margin              Delta   price2)
                                                                                                                                            > For a typical CAM manufacturer
                                     7.5%                                                             6.0 %                                   – Raw materials account for up to
                                                                                                       1.2      23.3      1.3                   55% of total cost
                                                                                  2.3      22.1                                   22.0
                                                                        2.1
                                                                                                                                              – D&A and utilities account for up
                                                           4.3                                                                                  to 25% of total cost
                                                                                                                                            > For a typical cell manufacturer
                 4.6      0.4        0.3       13.4
                                                                                                                                              – Raw materials account for up to
                                                                                                                                                58% of total cost
     8.2                                                                                                                                      – D&A and utilities account for up
                                                                                                                                                to 19% of total cost

    Other      Cathode    CAM        CAM       Cell    Cell D&A       Labor/       Cell   Cell cost    Cell  Cell Price Market    Market
               material   SG&A      margin    material                utilities   SG&A                margin             price     price
                cost                           cost                                                                                         > In view of their limited ability to
   MARGIN PRESSURE                                                                                                                            offset sales price declines, CAM
  > Any price decrease below USD 24 will have direct impact on CAM and cell manufacturer                                                      and cell manufacturers will compete
    margins                                                                                                                                   over a shrinking profit pool

1) Anode, separator, electrolyte, housing         2) Expected market price based on expert interviews

Source: Industry reports, experts interview, Roland Berger analysis                                                                               26_09_12The Lithium-Ion Battery_V06.pptx   23
LCO has the highest material costs, followed by NCA and NCM;
LFP and LMO are the least expensive

Manufacturing cost calculation 2011 [USD/kg]
                                                                                                                                         COMMENT
   TMC1)

             ~42.3         ~30.4          ~30.2         ~28.6         ~27.7        ~16.72)        ~16.2        ~23.9            ~23.5

                             3%                                                      7%            6%                                    > LCO is the most expensive
                                                                                                                 4%              4%
              7%
                            10%           10%            11%           11%           7%                                                    material due to high cobalt content
              7%                                                                                   11%          13%              13%
                            10%           10%            10%           11%
                                                                                                                                         > The material costs of NCA as well
                                                                                     22%
                                                                                                   15%          12%              12%       as all NCM materials are largely
                                                                                                                1%                1%       driven by cobalt (however they
                                                                                                   2%
                                                                                     22%
                                                                                                                                           also have a higher energy density)
             80%                                                                     2%
                                                                                                                                         > The low material costs of LFP are
                            72%           72%            70%           69%                                      65%              64%
                                                                                                                                           partly compensated by higher
                                                                                                   61%
                                                                                                                                           energy costs (+50-100%), higher
                                                                                     39%                                                   investments (+15%) and higher
                                                                                                                                           quality costs
                                                                                                                                         > NCM and NCA have similar equip-
             LCO            NCA           NCM           NCM            NCM          LFP -         LMO         HCMA3) HV spinel4)           ment investments; LMO has signi-
                                          111           523            424         FePO4                                                   ficantly lower material costs and
[USD/
kWh]        ~73.43        ~41.02         ~50.94         ~48.31        ~46.76       ~34.79         ~34.6        ~24.19           ~33.91     investment but is typically only
                                                                                                                                           used in blends with NCM or NCA
1) Total manufacturing costs        2) High quality differences       3) Not available until 2015 4) not available until 2020
      Quality/Environment           Maintenance           D&A Other            D&A Equipment          Energy/Utilities          Labor    Raw materials

Source: Industry reports, experts interview, Roland Berger analysis                                                                                  26_09_12The Lithium-Ion Battery_V06.pptx   24
Falling cobalt prices will favor cobalt-intensive materials, LFP
manufacturing costs are set to increase as energy costs go up

Manufacturing cost calculation 2015 [USD/kg]
                                                                                                                                         COMMENT
   TMC1)

             ~32.5         ~25.5          ~24.5         ~23.7         ~22.8        ~17.52)          ~12.8       ~20.2          ~19

                            4%             4%
                                                                                     7%              8%                             5%   > According to latest analyst reports
                                                                        4%                                        5%         5%
             10%
                            12%
                                                                                     7%              5%                                    the prices of nickel, cobalt and
                                          13%            13%           14%
             10%                                                                                    15%          16%           17%         magananese will decline through
                            12%                                                      21%                                                   2015
                                          13%            13%           14%
                                          2%                           2%                           20%
                                                                                                                 15%           16%       > Largely as a result thereof CAM
                                                                                     22%
                                                                                                                  2%           2%          material costs will decrease by
                                                                                                     3%                                    between 7% and 22% between
                                                                                     2%                                                    2011 and 2015
             73%
                            66%           64%            63%           62%                                                               > The costs of LFP will increase
                                                                                                                 57%           54%
                                                                                                    49%                                    largely as a function of higher
                                                                                     40%
                                                                                                                                           energy and utility costs which
                                                                                                                                           account for 30% of total cost
                                                                                                                                         > If HCMA is ready by 2015, this will
             LCO           NCA            NCM           NCM            NCM          LFP -           LMO        HCMA3) HV spinel4)          offer a significant cost advantage
                                          111           523            424         FePO4                                                   over other CAMs due to higher
[USD/
kWh]        ~56.49         ~34.49        ~38.95         ~36.54        ~35.27        ~34.12          ~27.3       ~20.4        ~27.46        energy density compounded by
                                                                                                                                           lower material cost
1) Total manufacturing costs        2) High quality differences       3) not available until 2015     4) not available until 2020
      Quality/Environment           Maintenance           D&A Other           D&A Equipment           Energy/Utilities       Labor       Raw materials

Source: Industry reports, experts interview, Roland Berger analysis                                                                                      26_09_12The Lithium-Ion Battery_V06.pptx   25
Technology Roadmap and Future Trends

                                       26_09_12The Lithium-Ion Battery_V06.pptx   26
Major innovations in cathode material technology are expected to
emerge only after 2015

 Li-Ion key materials roadmap
                  2000                2005                      2010                 2015                  2020               2025                   2030

                                         NCA                       NCM                 5V spinel                                                            Sulfur

                                         LCO                                           HCMA
Cathode

              LCO                                                                                                                                           Air
                                                                                       LiNiPO4 5V
                                         LMO
                                                                                       LiCoPO4 5V
                                         LFP                                           LiMnPO4 4V

              Graphite                                                                 Soft Carbon                                                          Li metal
Anode

                                                                                       Li4Ti5O12
              Hard
              Carbon                                                                   Graphite + Graphite Si-composites
Electrolyte

              LiPF6 + org.                                                                                   5v electrolyte
              solvents                   Gel-polymer
              (standard                  electrolyte
              electrolyte)                                                                                                     Solid polymer electrolyte
Separator

                                                                   Polyolefin +        Polyolefin +
              Polyolefin
                                                                   ceramic coating     ceramic filler

 Source: Avicenne compilation, Kai-Christian Möller, Frauenhofer ISC                                                                      26_09_12The Lithium-Ion Battery_V06.pptx   27
Battery Systems Cost Projections

                                   26_09_12The Lithium-Ion Battery_V06.pptx   28
Electric Vehicle Battery Systems Cost Comparison and Forecast
(USD/kWh)

Battery system (complete system without charger)     2012             2015                   2020

 Li-ion (includes sophisticated BMS & cooling)              600-750          400-500                   250-300

 NiMH (includes simple BMS & cooling for HEV only)          500-700          400-500                   350-400

 NiCd (includes simple controller)                          400-600          350-450                   300-350

 Lead-acid (includes simple controller)                     220-250          200-220                   180-200

                                                                                 26_09_12The Lithium-Ion Battery_V06.pptx   29
Cost Difference Between Li-Ion and Lead-acid Batteries for Long
Cycle Life Applications

Cost development of Lead-acid vs. Lithium-Ion batteries [USD/kWh]
                             -45%                      -65%                       COMMENT
                                                                                  > The cost factor between lead-
                                                                                    acid and Li-ion batteries will
              1:3
                                                                                    move from 1:3 today to
                     663                                                            1: 1.5 by 2020
                                          1:2                                     > This is a result of the drastic
                                                                                    cost reduction for Li-ion
                                                 450                                battery system costs with an
                                                                    1:1.5           average annual rate of 9-10
                                                                            275     %, whereas lead-acid is
     225                            213                                             limited to 2-3 %
                                                              188

              2011                        2015                      2020
  Lead-acid      Lithium-Ionen

                                                                                          26_09_12The Lithium-Ion Battery_V06.pptx   30
Conclusions

> Hybrid electric vehicle batteries is the fastest growing market segment of the
  total xEV market, with 8 million HEVs and 3 millon EV/PHEVs on the road globally
  by 2020
> The overall growth of the Li-Ion battery market up to 2020 is still dominated by
  consumer batteries with a market share of 63% and 37% for xEV batteries
> Our value chain analysis reveals that cathode materials are the major cost drivers
  but new developments will drive the total battery system cost for Li-ion batteries down
  from 650 USD/kWh today, to about 270 USD/kWh in 2020
> Lower cost combined with excellent cycle and calendar life makes Li-ion batteries a
  competitive candidate in many industrial, grid storage and renewable energy storage
  systems, where lead-acid systems are widely used today

                                                                     26_09_12The Lithium-Ion Battery_V06.pptx   31
Please contact us for further information

CONTACT
                        Dr. Wolfgang Bernhart                            Dr. Franz J. Kruger
                        Partner                                          Senior Advisor

Roland Berger Strategy Consultants GmbH         Roland Berger Strategy Consultants GmbH
Automotive Competence Center                    Automotive Competence Center
Loeffelstraße 46                                Bockenheimer Landstraße 2-8
70597 Stuttgart                                 60306 Frankfurt
Germany                                         Germany
Phone +49 711 3275-7421                         Phone + 49 69 29924-6301
Mobile +49 160 744-7421                         Mobile + 49 172 697 4899
mailto:wolfgang_bernhart@de.rolandberger.com    mailto:franz_kruger@org.rolandberger.com

                                                                                     26_09_12The Lithium-Ion Battery_V06.pptx   32
1. This presentation has been compiled for the exclusive, internal use by our client. Within the framework of the engagement, Roland Berger Strategy Consultants
   ("RBSC") will act solely in the interest of the client. Property rights in favor of third parties will not be constituted and no protective effect shall arise for the benefit of
   third parties

2. The presentation shall be treated as confidential and may not be passed on and/or may not be made available to third parties without prior written consent from
   RBSC. It is not complete without the underlying detail analyses and the oral presentation

3. RBSC does not assume any responsibility for the completeness and accuracy of any documents and information made available to RBSC in the course of the
   project. RBSC assumes that the data and documents provided are complete, comprehensive and that the contents are truthful and exact; a detailed examination has
   only been conducted by RBSC if stated so in the presentation

4. RBSC's scope of services included […]. It has not been examined if […]. This presentation does not confirm whether turnaround is possible or worthwhile. The
   decision over the use, the evaluation of the applicability and the use of the presentation by RBSC are the sole responsibility of the client. The content and scope of
   the presentation is exclusively at the discretion of RBSC

5. This presentation relates only to the position as of [date…] and will not be updated. This presentation has been compiled based on the General Terms and
   Conditions of RBSC as attached to this presentation. Any use of this presentation (or excerpts of it) or its content must only be made within the scope of the General
   Terms and Conditions of RBSC. It is explicitly stated that section 2 no. 2 (no protective effect for the benefit of third parties) and section 9 (limitation of liability) of the
   General Terms and Conditions of RBSC apply. If, notwithstanding the intention of the parties, property rights in favor of third parties shall be constituted, section 334
   BGB (German Civil Code) shall apply mutatis mutandis. Any possible liability to third parties is limited according to section 9 of the General Terms and Conditions of
   RBSC

                                                                                                                                             26_09_12The Lithium-Ion Battery_V06.pptx   33
It's character
  that creates
  impact!

                 26_09_12The Lithium-Ion Battery_V06.pptx   34
You can also read