Kesko - Investor Presentation - Q3/2019 ALL-TIME BEST QUARTER
←
→
Page content transcription
If your browser does not render page correctly, please read the page content below
Q3/2019 ALL-TIME BEST QUARTER
Kesko – Investor Presentation
K Group and Kesko Today

         Biggest in Finland,         Profitable growth     43,000 employees,

    #1   #3 in Northern Europe
         with retail sales of over
                                     strategy in 3 core
                                     divisions
                                                           approx. 1,800 stores and
                                                           comprehensive digital
         €13bn                                             services in 8 countries

         Strong financial            Market cap approx.    World’s most
         position with good          €5.9bn with over      sustainable trading
         dividend capacity           41,000 shareholders   sector company

2
Kesko’s footprint
      K Group’s Retail Sales and Number of Stores

                         Net sales                                      Comparable operating profit

      Speciality  Car trade                                                                                                                                                           Finland
                                                                                Car trade                                                                   Norway
      goods trade €825.6m                     Grocery trade                       €24.9m
           €353.7m
                                                                                                                                 Retail sales *,
                                                  €5,505.0m                                                                                                          Sweden
                                                                                              Grocery trade                          € million     Stores
                                                                 Speciality
                                                                                                €317.8m                                                                                   Estonia
                                                                 goods trade                                  Finland                   10,887      1,593
Building and                                                          €9.3m                                                                                                               Latvia
                                                                                                              Sweden                       474         51
technical trade        €10,641.2m*                                               €446.5m*                     Norway                       769        82
                                                                                                                                                                              Lithuania
   €3,960.4m                                                  Building and
                                                                                                                                           936        58                  Poland          Belarus
                                                              technical trade                                 Baltic countries
                                                                    €130.8m                                   Poland                       239        36

                                                                                                              Belarus                       141       16

      Continuing operations, *rolling 12 months Q3/19
      * Incl. common functions and eliminations €-36.6 m

      3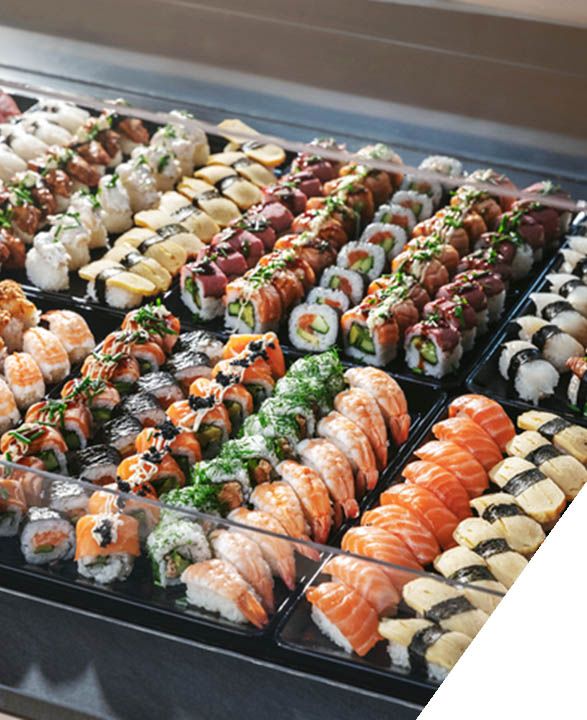
Continuing Our Growth Strategy Implementation

VISION                          We are the customers' preferred choice and the quality leader in the European trading sector

                                                                                                                    Sustainability and
STRATEGIC          Profitable           Business                Quality and                   Best digital                                           One
                                                                                                                    combating climate
FOCUS AREAS         growth               focus              customer orientation               services                                            unified K
                                                                                                                         change

                           Grocery trade                                     Building and technical trade                          Car trade

              •   Most customer-oriented and inspiring food       •   Country focus with specified strategic        •   Increasing business in cooperation with the
                  stores with store-specific business ideas           actions                                           Volkswagen Group
DIVISION
PRIORITIES    •   Profitable development of store network         •   Three customer segments served                •   Increasing own service and mobility
              •   Seamless multi-channel customer                     according their specific customer needs           business
                  experience                                      •   Synergies – within individual countries and   •   Best customer experience – in all channels
              •   Development of the retailer business model          between the operating countries
                  as a competitive advantage                      •   Organic growth and profitability
              •   Significant growth in the foodservice               improvement
                  business                                        •   Selected acquisitions to win a chosen
                                                                      country and segment

VALUE                                                       The customer and quality – in everything we do
4
A Strong and More Focused Company Through Successful
Portfolio Transformation
                                                                                                                                           7/2019            5/2019
                                                                                                                                           VW-, Audi- and    Heinon Tukku*
                                                                                                                                           SEAT-
                                                                                                                                           businesses from   8/2019
 Acquisitions                                                                                             3/2019                           Laakkonen         Konekesko’s
                                                                                                          VW, Audi and      5/2019                           Finnish operations
 Investments in Core Business Operations €2.2bn,                                                          SEAT businesses   Fresks Group
                                                                                                                                           5/2019
                                                                                                          from LänsiAuto                   Onninen
 Divestments €1.0bn                                                                                       and Huittisten                   Sweden’s HEPAC
                                                                                                                            7/2018
                                                                                                          Laatuauto                        business
                                                                        7/2018 &                                            Remaining
                                                                        1/2019            10/2018                           shares of
                                                                        Gipling,          1A Group          2/2018          Konekesko
                                                                        Skattum                             Russian         Baltics*
                                                                        Handel and                          building
                                                                                         6/2017             and home
                                                     6-7/2018           Sørbø            Yamarin boats      improvement
                                                     Reinin Liha and
                                                                                         and Yamaha         trade
                                                     Kalatukku         6/2017            representation
                                                     E. Eriksson       Asko and
                                     12/2016                           Sotka furniture
                                     AutoCarrera     6/2017            trade
                                                     K-maatalous
                           6/2016
                           Onninen   11/2016
  4/2016                             Russian
  Suomen
                           3/2015
                                     grocery trade                                                                                                Divestments
  Lähikauppa
                           Anttila
* Waiting for completion
   5
Kesko’s New Financial Targets

                                                                                                                 Level achieved
    Indicator                                                                                  Target level        in Q3/2019*

    Comparable operating margin, %                                                                    5.0%                   4.2%*

    Comparable return on capital employed, %                                                          11.0%                  9.6%*

    Interest-bearing net debt/EBITDA, excluding                                           at maximum 2.5                       1.0
    the impact of IFRS 16
    * Continuing operations, rolling 12 months

    Kesko’s dividend policy: In the long-term, Kesko aims to distribute a steadily growing dividend of some 60-100% of its
    comparable earnings per share, taking into account the company’s financial position and strategy.

6
Steady Growth Targeted in Dividends
    Dividend policy updated in Q1: In the long-term, Kesko aims to distribute a steadily growing dividend of some
    60-100% of its comparable earnings per share, taking into account the company’s financial position and strategy.
    Dividends will be paid in two instalments, starting with the dividends paid for 2018.
                                                                                         2.50                             2,47
                                                                                                            2.28              2,34
                                                                                                                   2.20
                                                                                                2.01 2.00
                  1.84
                                                       1.68            1.65       1.70
                                    1.47                                   1.50
                                                          1.40
                     1.20               1.20
Pay-out
                    65.3              81.8               83.3             91.1     146.7          99.5         96.6        94.7
ratio, %

Effective
dividend yield,     4.6               4.8                 5.2             5.0        7.7           4.2         4.9         5.0
B share, %

                   2011               2012              2013             2014      2015          2016         2017         2018
                     Comparable earnings per share, Group, €     Dividend, €

7
Sustainability Strategy –
The Environment Is at the Core of Our Corporate Responsibility Work

                                           All electricity we purchase      With 32 solar power       We are constantly working
                                             in Finland is produced      plants, we are the biggest      to improve energy
                                            with renewable energy        producer and user of solar           efficiency
                                                                             power in Finland               at our stores

                                              Our logistics emissions        Our food waste is          We promote circular
                                              are down by 16.8% on          down by 7.3% from          economy through more
                                                    year 2011               the 2013 base level       efficient recycling at our
                                                                                                       stores and for our own
                                                                                                      brand product packaging

8
Kesko’s Responsibility Path

9
GDP and Finnish Consumer Confidence

Expected GDP growth in Kesko’s operating countries                                      Finnish Consumers’ views on economic situation in
                                                                                        one year’s time (balance)
     %                                                                                        %
                                                                                        30
     5
                                                                                                                           Own economy
                                                                                        20
     4
                                                                                        10

     3
                                                                                         0

     2
                                                                                        -10

     1                                                                                                    Finland’s economy
                                                                                        -20

     0                                                                                  -30
          Finland       Sweden     Norway   Estonia     Latvia     Lithuania   Poland

         Source: Bloomberg       2018   2019E   2020E      2021E                              Source: Statistics Finland

10
Change in Buiding volumes in Kesko’s Operating
Countries
Change in building construction volume in Kesko’s operating countries
%
16 Finland
12
Norway €28bn
€35bn Sweden
8
€32bn
4
0
-4
-8
Finland Sweden Norway Estonia Latvia Lithuania Poland Belarus
Baltic
2016 2017 2018 2019E 2020E 2021E
Countries
€8bn
Change in building renovation volume
% Belarus
6
5 €2bn
4
3
2 Poland
1 €35bn
0
-12018 2019E 2020E 2021E
-2
-3
-4
-5
-6
-7
11 Finland Sweden Norway Estonia Latvia Lithuania Poland
Above building construction volume figures from 2018,
Source: Statistics, Forecon Ltd, Euroconstruct Poland and Belaru form 2017New Vehicle Registrations in Finland
Passenger cars Vans Trucks, >6 tonnes
'000 '000 '000
3.1 3.2 3.1
119.0 118.6 120.5 15.5 15.5
109.5 14.5 2.9
106.2 108.8 13.5
2.4
11.4 2.2
10.6
2014 2015 2016 2017 2018 F 2019 2014 2015 2016 2017 2018 F 2019 2014 2015 2016 2017 2018 F 2019
Source: Traficom, Statistics FinlandSix Reasons to Invest in Kesko
1 Growth We have a strong customer and quality driven growth strategy since 2015 with a focus on three core divisions . We seek growth
strategy organically and through acquisitions. Our growth strategy is based on customer-oriented operations and using quality for
differentiation in both our stores and digital channels.
2 Strong market
position
Kesko is one of the leading retail companies in Northern Europe and the largest retail operator in Finland. We strive to be among the
top two operators in all our businesses in order to ensure economies of scale.
Kesko’s strategic objective is to achieve profitable growth in all its businesses. At he end of September 2019, our rolling 12m
3 Long-term
profitability
comparable operating profit was €446.5 million. In 2014, before we adopted our new strategy, it was €233 million. This improvement in
profitability is a result of customer oriented growth strategies in our business divisions, measures taken to improve gross profit, and the
improvement effective management of capital employed. Also cash flow generation is in focus.
4 Attractive
dividends
Kesko has distributed dividends to shareholders uninterrupted since 1968. We target steadily growing dividends and an attractive
dividend yield. Successful strategy implementation provides dividend upside potential.
5 Track-record
in value
Our growth strategy is delivering improving results. Kesko management has demonstrated ability to create value through good
strategic choices and efficient allocation of capital to growth initiatives. Since 2015, the total shareholder return for Kesko’s B-share is
creation 152%.
6 Responsibility Thanks to Kesko’s long-term and comprehensive sustainability work, it is included in prestigious global sustainability indices, such as
the DJSI World and DJSI Europe. Furthermore, we have been counted among the Global 100 Most Sustainable Corporations in the
World list.
13Kesko Q3 2019 All-Time Best Quarter
Highlights Q3/2019

• Another all-time best quarter for Kesko

• Group net sales up by 6.1%

• Market share for K-food stores strengthened further,
  performance particularly strong in the K-Citymarket
  chain

• Growth continued in building and technical trade,
  with profitability improving especially in the Nordic
  countries

• Kesko was again included in the prestigious Dow
  Jones Sustainability Indices

15
Key Performance Indicators – Solid Q3 2019
Profitable growth continued in the third quarter
                                                                                                     Q3/2019           Q3/2018    1-9/2019   1-9/2018

 Net sales, € million                                                                                 2,803.9           2,641.8    7,986.1    7,727.6

 Change in net sales, %                                                                                          6.1        1.8        3.3       -2.4

 Change in net sales, comparable, %                                                                              2.9       3.5         1.6       3.6

 Operating profit, € million                                                                               152.0          137.0      331.9      314.0

 Operating margin                                                                                                5.4        5.2        4.2        4.1

 Finance net, €m*                                                                                          -23.3         -25.3       -70.1      -76.7

 Profit before tax, € million                                                                              129.3          111.2      263.1     234.5

 Earnings per share, basic, €                                                                                1.01         0.81        2.07       1.75
Comparable figures, continuing operations
* Includes interest expenses for lease liabilities of €23.1m (€25.0m) in 7-9/2019, €71.9m (€75.6m) in 1-9/2019

16
Strong Financial Position
Kesko has signed financing agreements totalling €700 million linked to its sustainability targets
30.9.2019 30.9.2018
Liquid assets, €m 171.8 319.2
Interest-bearing net debt excl. lease liabilities, €m 465.1 228.9
Interest-bearing net debt/EBITDA (excl. IFRS 16 impact) 1.0 0.6
Lease liabilities, €m 2,392.3 2,212.7
Continuing operations Q3:
Cash flow from operating activities, €m 191.6 207.8
Cash flow from operating activities (excl. IFRS 16 impact), €m 108.4 130.5
Capital expenditure, €m* 132.2 221.2
* Acquisitions €45.0m (€162.1m)
17Net Sales
Q3 net sales up by 6.1%, comparable growth 2.9%
% Comparable growth Rolling 12 months
€m €m
3.5% 1.9%
33,500
500 3.4% 4.0% 3.5% 3.1% -0.6% 2.1% 2.9% 12,000
12 000
10,382.8 10,641.2
33,000
000 2,781.4 2,803.9 10 000
10,000
2,672.7 2,641.8 2,655.1
22,500
500 2,413.2 2,400.8
8 000
8,000
22,000
000
6 000
6,000
1,500
1 500
4 000
4,000
11,000
000
2 000
2,000
500
0 0
Q1/18 Q2/18 Q3/18 Q4/18 Q1/19 Q2/19 Q3/19 2018 Q3/19
Continuing operations
18Operating Profit
Q3 operating profit up by €15 million
+ €15.0m Rolling 12 months
€m €m
446.5
160 152.0 450 428.5
137.0 400
140 122.5
113.2 114.5 350
120
300
100
250
80 63.8
57.5 200
60
150
40 100
20 50
0 0
Q1/18 Q2/18 Q3/18 Q4/18 Q1/19 Q2/19 Q3/19 2018 Q3/19
Operating 5.2% 4.4%
2.6% 4.2% 4.3% 2.4% 5.4% 4.1% 4.2%
margin
Comparable operating profit, continuing operations
19Investments in Line with Growth Strategy
ROCE 9.6%
Investments 1-9/2019 ROCE, Comparable, rolling 12 months
1-9/2019, €m
25
Acquisitions in building and technical
290 20.8
trade and car trade
20
Store sites 110
15 14.2
13.1
Kruunuvuoren Satama, store sites 86 10.9
9.8 9.6
10
7.9 7.6
IT and other investments 117
5
Total 603
0
Grocery trade Building and Car trade Group, continuing
technical trade operations
2018 Q3/19
20Outlook Estimates for the outlook for the net sales and comparable operating profit for Kesko Group's continuing operations are given for the 12-month period following the reporting period (10/2019-9/2020) in comparison with the 12 months preceding the end of the reporting period (10/2018-9/2019). The outlook estimate includes the impact of IFRS 16 Leases on the Group’s comparable operating profit for both the 12-month period following the reporting period as well as the 12-month period preceding the reporting period. The general economic situation and the expected trend in consumer demand vary in Kesko's different operating countries. Uncertainty related to general economic development has grown in Kesko’s operating countries and the pace of economic growth is expected to slow down. In the Finnish grocery trade, intense competition is expected to continue, but the market is expected to grow. In the Northern European construction market, new building volumes are expected to normalise from the high levels of peak years, and the focus to shift to renovation building. In the Finnish car trade, the market is expected to be lower than average. Kesko continues the determined customer-oriented transformation of its business and execution of its strategy. In comparable terms, the net sales for continuing operations for the next 12 months are expected to exceed the level of the previous 12 months. The comparable operating profit for continuing operations for the next 12-month period is expected to exceed the level of the preceding 12 months. 21
GROCERY TRADE
Sales Grew, Market Share Strengthened and
Profitability Improved Further
Grocery Trade in Brief

• Over 1,200 stores in the retailer business model   Net sales
                                                     Rolling 12 months Q3/19

• Market share 36.1%                                 Liukuva 12 kk
                                                                                     Other
                                                                          Kespro
                                                                                                       K-Citymarket,
• Some 1.2m customers visit K-food stores daily                                                            food

• K-food store chains are K-Citymarket,
  K-Supermarket, K-Market and Neste K
                                                                                   €5,505.0m
  service stations
                                                               K-Market                                      K-Citymarket,
                                                                                                               non-food
• Kespro is the leading foodservice provider
  in Finland
                                                                                             K-Supermarket

23
Success Stories in Grocery Trade Strategy Execution K-retailer entrepreneurship and store-specific business Rebranding and store Acquisition of Suomen ideas, multi-store model modernisations Lähikauppa New digital services and Differentiation through Market share growth Developing foodservice food online own brand products business 24
Grocery Trade Net Sales
Q3 net sales and market share growth continued strong

     %   Comparable growth                                                               Rolling 12 months
 €m                                                                                      €m          5.1%     3.9%

 22,000
   000                                                                                             5,385.7   5,505.0
                7.4%          2.9%      6.2%      4.2%      0.4%      7.0%      3.7%
                                                                                          5 000
                                                                                         5,000

     11,500
       500                                       1,429.8             1,408.6   1,402.7
                             1,327.3   1,352.4
               1,276.2                                     1,263.9                        4 000
                                                                                         4,000

     11,000
       000                                                                                3 000
                                                                                         3,000

                                                                                          2 000
                                                                                         2,000
      500
                                                                                          1 000
                                                                                         1,000

         0                                                                                    0
               Q1/18         Q2/18     Q3/18     Q4/18     Q1/19     Q2/19     Q3/19                2018     Q3/19

25
Grocery Trade Operating Profit
Q3 operating profit improved further, growth €12.2 million
Rolling 12 months
+ €12.2m
€m €m 317.8
100 294.5
88.6 93.5 300
90 81.3
79.0
80 69.5 250
70
55.2 56.8 200
60
50 150
40
100
30
20 50
10
0 0
Q1/18 Q2/18 Q3/18 Q4/18 Q1/19 Q2/19 Q3/19 2018 Q3/19
Operating 4.3% 5.2% 6.0% 6.2% 4.5% 5.5% 5.8%
5.6% 6.7%
margin
Comparable operating profit
26Grocery Trade
Market Q3
• Total market growth 2.5%* • K Group’s grocery sales +3.3%, growth outpacing
the market
• Grocery prices up by approx. 1.7%
• Sales grew and profitability improved in all chains
• One wholesale selling day more in Q3
• Performance especially strong in K-Citymarket,
• Importance of quality, selections and ease of also in non-food
shopping has increased further, price still relevant
• Continued growth in online sales, +117%
• Continued growth in foodservice and the popularity
of eating out • Finnish Competition and Consumer Authority
extended the time limit for the investigation into
Kesko’s acquisition of Heinon Tukku
* Kesko’s own estimate
27BUILDING AND TECHNICAL TRADE Sales Grew and Profit Strengthened Led by the Nordics
Building and Technical Trade in Brief

•     #1 operator in building and technical trade
      in Northern Europe
                                                                                Norway                      Finland
                                                                                €658m                      €1,750m
•     Net sales pro forma €4.0bn*

•     Approximately 70% of sales from B2B trade and
      30% from B2C                                                                       Sweden
                                                                                         €457m
•     ~430 stores in 8 countries
                                                                                                                Baltics
                                                                                                              and Belarus
•     Comprehensive digital services                                                                            €843m

•     Additionally, speciality goods trade business
                                                                                                  Poland
                                                                                                  €239m

*2018 pro forma net sales, current portfolio and excl. speciality goods trade
29
Three Customer Segments Served According Their Specific
Customer Needs
Technical Professional Consumers
professionals builders
• Technical contractors • Construction companies • Renovators
• Infrastructure • Renovation contractors • Home and garden builders
• Industry • Decoration contractors • Decorators
• Retailers • Gardeners
30
BtoB represents 70% of division’s total sales BtoC represents 30% of division’s total salesBuilding and Technical Trade Net Sales
Q3 net sales up by 9.8%
% Comparable growth Rolling 12 months
€m €m
-2.3% 4.7% 2.5% 5.1% 5.6% 0.8% 4.1% 2.6% 3.8%
11,400
400
3,960.4
1 200
1,200 4 000
4,000 3,728.0
1,066.4 1,074.0
995.3 977.8
11,000
000 952.5
867.5 3 000
3,000
802.3
800
600 2 000
2,000
400
1 000
1,000
200
0 0
Q1/18 Q2/18 Q3/18 Q4/18 Q1/19 Q2/19 Q3/19 2018 Q3/19
Figures excluding speciality goods trade
31Building and Technical Trade Operating Profit
Q3 comparable operating profit improved, growth €6.4 million
Rolling 12 months
+ €6.4m
€m €m
60 54.5 140 130.8
55 48.1 117.5
50 45.5 120
45
37.5 100
40
35 80
26.9
30
25 60
20
40
15 5.0 3.9
10 20
5
0 0
Q1/18 Q2/18 Q3/18 Q4/18 Q1/19 Q2/19 Q3/19 2018 Q3/19
Operating
0.6% 3.8% 4.9% 2.8% 0.5% 4.3% 5.1% 3.2% 3.3%
margin
Comparable operating profit, figures excluding speciality goods trade
32Building and Technical Trade
Market Q3
• New building volumes in the construction market • Strong net sales growth in Finland, Sweden and the
normalising after peak years Baltics
• Steady growth in renovation and infrastructure • Profitability improved especially due to good
construction development in K-Rauta Finland, Onninen and K-Bygg in
Sweden
• Market consolidation continues
• Measures to improve profitability in Sweden and Norway
• Importance of digital services growing continued
• Good performance in the sports trade, both net sales and
profit up
• Finnish agricultural machinery trade operations divested
in August
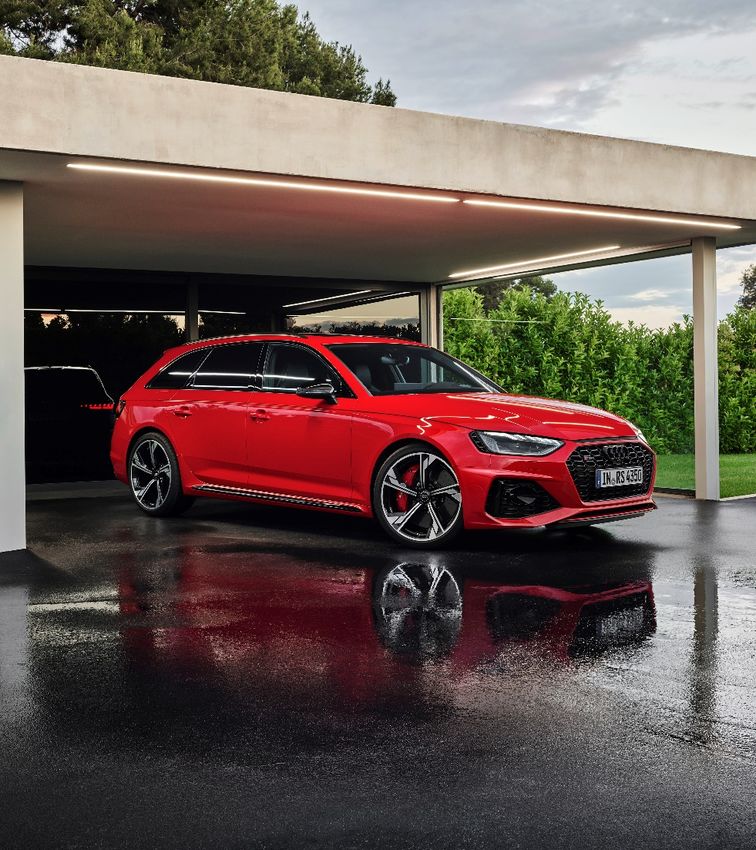
33CAR TRADE Our Competitiveness Is Good Despite the Challenging Market Situation
Car Trade in Brief
• Operating the Volkswagen Group’s business in Net sales
Rolling 12 months Q3/19
Finland: Audi, Volkswagen, SEAT, Porsche and
MAN as well as Bentley from autumn 2019 Liukuva 12 kk
• K-Auto is the market leader in Finland New cars
31 %
Importing /
• Value chain includes importing, retailing and sales to dealers
after sales as well as an extensive dealer and 44 %
€825.6m
servicing network
• Various service concepts developed under the
Used cars
K-Caara platform 16 %
After sales
9%
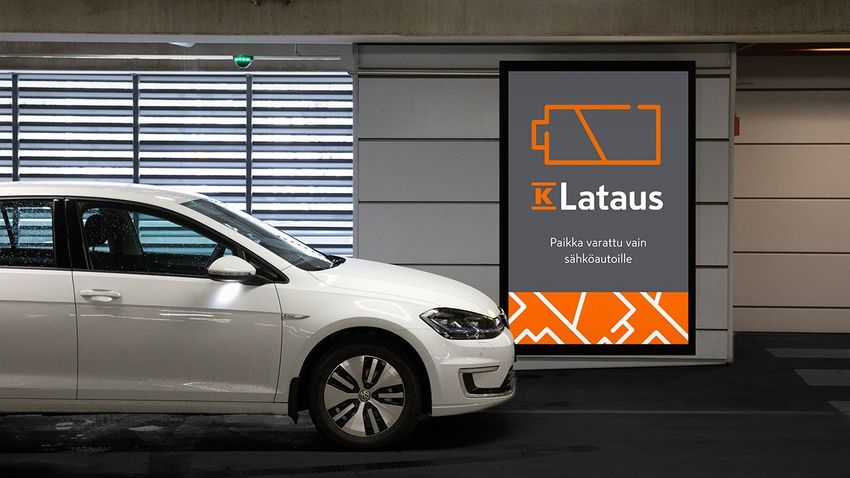
35New business
services off to a good
start: K-Caara leasing,
car sharing, nationwide
K-Charge network for
electric carsCar Trade Net Sales
Q3 net sales up by 11.3%
% Comparable growth Rolling 12 months
€m €m
-1.8% -14.9%
350
5.8% 4.0% -5.6% -12.9% -21.9% -16.5% -5.9%
1,000
1 000
300 893.1
258.9 825.6
243.6
250 222.9
211.9 750
200.3 200.5
200 190.2
150 500
100
250
50
0 0
Q1/18 Q2/18 Q3/18 Q4/18 Q1/19 Q2/19 Q3/19 2018 Q3/19
37Car Trade Operating Profit
Q3 operating profit €5.0 million, efficiency measures carried out
Rolling 12 months
€m €m
40
35.2
14
- €3.0m 35
12 11.1
30
24.9
10 8.9 25
8.0 7.7
8 7.2 20
6 5.0 5.0 15
4 10
2 5
0 0
Q1/18 Q2/18 Q3/18 Q4/18 Q1/19 Q2/19 Q3/19 2018 Q3/19
Operating
4.3% 3.7% 4.0% 3.8% 3.8% 2.4% 2.3% 3.9% 3.0%
margin
Comparable operating profit
38Car Trade
Market Q3
• Car trade in Europe clearly below normal levels • Performance in car trade softer than anticipated,
but did pick up towards the end of the quarter
• Debate over car taxation and motive power choices
has kept up uncertainty among consumers in Finland • Significant cost adjustment measures due to
changes in the market: codetermination
• Imports of used cars clearly up
negotiations concluded in 10/2019
• First registrations down by 0.9%
• Acquisition of Laakkonen’s VW, Audi and SEAT
businesses completed in 7/2019
• Leasing fleet has grown to some 1,500 cars
• Market share of brands we represent 16.5%
39Strategic Priorities in a Nutshell Lastest Development by Division
PRIORITIES In the grocery trade, growing our sales and profitability further in the changing market by utilising our strategic strengths in everything we do In the building and technical trade, further growing our sales and profitability by country: continuous improvement of processes and well-executed acquisitions In the car trade, returning sales and profitability to a good level and further improvement through maximum utilisation of the VW Group’s improved and more extensive range of models Maximum utilisation of data and new technologies across K Group Constant improvement in operational efficiency and competitiveness – preparing for a slowdown in economic growth Even stronger focus on and visibility for sustainability in all actions by 1,800 K stores
Changing Grocery Trade
Market and Trends

•    Ease of shopping, multichannel

•    Individuality and diversity of customer needs

•    Experiences and inspiration

•    Sustainability, Finnish products and local food

•    Healthy food, especially vegetarian

42
Our Strategy Is Working in the Changing Market

     • K-food retailers as forerunners in modernising
       Finnish grocery store selections                                 K Group’s role as
     • Store-specific business ideas and an agile operating model         a forerunner
         • Sustainable, inspiring, high-quality tailored selections     has strengthened
         • Ease and convenience

         • Advanced digital services and online sales                 Customer satisfaction
     •   Redesigns for the whole store network and all chain brands       is clearly up
     •   Competitive prices and a more extensive private label
         Pirkka selection                                                 Good growth
     •   Management by data - efficient processes based on               in market share
         customer data

43
Profitable Growth at the Core of Strategy Execution
EBIT-%
• Increased country focus in strategy execution
Best
is working: sales and profit up
European
operators • Improved market position for K-Rauta in Finland among
both consumers and B2B customers
• Onninen’s comparable net sales and operating profit
today
continued to grow
• In Sweden, Fresks chain rebranded K-Bygg,
market position in B2B trade has strengthened
• A geographically balanced foothold: operations outside
Finland account for 56% of net sales
before
• Continued efforts to redesign multichannel services,
K-Rauta’s online sales in Finland up by 99% in Q3
Time
44Strengthening
Competitiveness
• Modernising and expanding range
• Volkswagen Golf and Passat plug-in hybrid, Audi
A4 and Q5 plug-in hybrid, and Porsche Cayenne
Coupe plug-in hybrid
• All-electric Porsche Taycan, Volkswagen ID.3,
SEAT Mii
• Improving availability of cars
• More efficient operations, costs adjusted
• Integration of acquisitions that strengthen our
dealer network proceeding as planned
45Contact Hanna Jaakkola Vice President, Investor Relations +358 40 5666 070 hanna.jaakkola@kesko.fi 46
You can also read