Analyzing End of Life LCD TV WEEE Flows in Europe
←
→
Page content transcription
If your browser does not render page correctly, please read the page content below
Analyzing End of Life LCD TV
1
WEEE1,2 Flows in Europe
Farzaneh Fakhredin , Jaco Huisman
1
Faculty of Industrial Design Engineering, Delft University of Technology, Delft, The Netherlands
2
United Nations University, Institute for Sustainability and Peace, Bonn, Germany
Abstract
Since the introduction of LCD TVs in 2005, consumers exchanged their bulky CRT television with a new set of
flatter and lighter LCD television. As a result the migration to flat TVs has been steadily progressing.
Considering the upcoming increase of LCD TVs in the return stream, there is a strong need to quantify the
amounts generated as waste. In order to do this, the study utilizes a Sales-Stock-Lifespan model to estimate
future flows of LCD TVs across twenty European countries from 2005 to 2016. Quantification of patterns in the
waste stream can help designers and decision makers to anticipate on design consequences in collection and
treatment before posing new design changes.
Keywords:
waste electrical and electronic equipment, LCD TV, sales-stock-lifespan model, end of life
1 INTRODUCTION Netherlands 3, Italy 4 and Belgium 5. The UNU model is
For 2012, the predicted global sales for Liquid Crystal also applied in this study specifically for LCD TVs.
Display (LCD) TVs were 203 million units which proved Detailed explanation of this model can be found in 6.
to be the most popular among the other type of TV
technologies sold worldwide. Followed by Cathode Ray 3 PUT ON MARKET: EEE
Tubes (CRT) TVs (16 million units), Plasma Display
Panel (PDP) TVs (13 million units), Rear Projection (RP) Based on data from the national statistics as well as the
TVs (50 thousand units) and Organic Light Emitting registrations of equipment put on the market by producers
Diode (OLED) TVs 1, 2. Although the overall LCD TV and sales data from reports by the European Information
market has recently declined in Europe, there is still an Technology Observatory (EITO) 7, a time sequence is
increasing LCD TV waste stream on the horizon. In made of the quantities of LCD TV put on the market that
Europe, waste LCD displays are subject to the WEEE runs from 2005 to 2016 for major European countries. At
Directive (2002/96/EC), which regulates the reuse, the same time the quantities of LCD TV put on the market
recycling or recovery of waste electronic and electrical for few emerging countries collected for a better
equipment (WEEE). The treatment of WEEE must ensure understanding of current state of European Union. The
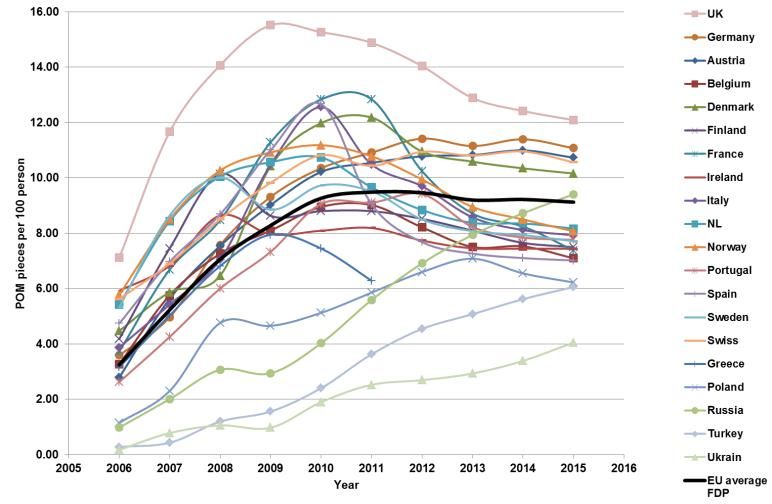
that all hazardous materials are properly contained and quantities of LCD TVs are expressed in pieces per 100
diverted from landfill. For CRT TVs, recycling inhabitants, as shown in Figure 1.
technologies have been established and the volumes in
return stream is decreasing, but the collection and In the majority of countries, LCD TV sales followed a
treatment of LCD TVs is a new challenge. Considering fairly similar pattern over the years. In the first year (2006)
above discussed consequences, there is a need for the sales started by 4 to 6 pieces per hundred person and in
estimating End of Life LCD TV generation in Europe. the last five years the sales remain at between 10 and 12
Knowing the availability of sufficient volumes of LCD per hundred person. The general trend though for France,
TV’s in the waste stream in a certain geographical region Italy, Denmark and Spain was a decline in the number of
will help decision makers and designers to realize if pieces sold over the last five years, with all at around 12
collection, transport, processing as well as more long term pieces per hundred person in 2010. In comparison, it is
redesign efforts are worthwhile activities. estimated that both Norway and the Netherlands will
experience a downward trend in the number of LCD TVs
by 2015. Remarkably, it can be seen that the total sales
2 MULTIVARIATE ANALYSIS: SALES-STOCK- were far higher in Britain than in other Western European
LIFESPAN MODEL countries throughout the whole time frame. This also
United Nations University (UNU) has developed a matches with the EITO reports data. The reason for the
statistical model that estimates the quantity of EEE put on ‘anomaly’ for the UK is not understood. However, it is
the market and the quantity of WEEE generated, based on obvious from the figure that the majority of EU countries
data of sales, stock and lifespan profiles. This model has sales data fall into the same “Spaghetti bundle”.
been already used for quantifying WEEE in the
Proceedings of EcoDesign 2013 International Symposium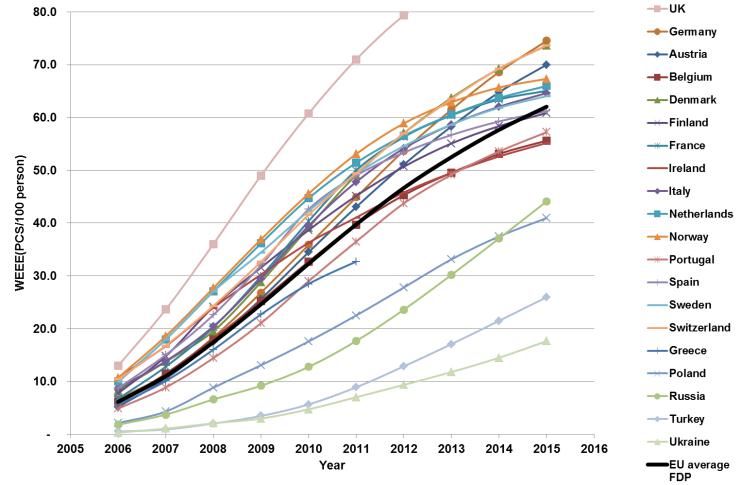
Fig. 1: LCD TV put on market total EU, incl prognoses

In contrast, Ukraine, Turkey, Russia and Poland all with         4 LIFESPAN
much lower income levels, experienced an upward trend,           LCD TVs that are put on the market will become waste
starting the reporting period at just over 0, and finishing at   after some time. The lifespan of LCD TV can be different
just under 4 to 10 pieces per hundred person. In Belgium,        per country. However, for this study the ‘lifespan’ is
Portugal, Finland, Sweden and Ireland the amount of sold         obtained from the average lifespan of LCD TV sold in the
LCD decreased gradually after 2008. Greece continued to          Netherlands in 2012. That is mainly because there is not
decrease as well but more steeply to 6 pieces per 100            enough accurate information available to produce more
person in 2011.                                                  detailed lifespan profiles for other EU countries.
                                                                 Therefore, it is assumed that the parameters from the
It is important to note there are some external factors that     Netherlands are representative for other countries in the
affect the CRT replacement market penetration. One of            study. The lifespan of TV’s is however found to be very
these external factors is the income level. For electronics      similar in the country studies done in Italy, Belgium and
purchases in total it is assumed that countries with higher      France 3, 5. The average weight per pieces in years and
income level purchase more LCD TVs 8 , but the fact is           applied median lifespan in years are presented in Table 1.
that people buy LCD TV’s anyway regardless of their              As we move from 2006 to 2012 the expected lifespan and
income. The sales trend in Brazil, Ukraine, Turkey and           weights of LCD TV are decreasing. It is interestingly to
Russia shows clearly that also in low income countries           note that although screen sizes are increasing, the average
LCD TVs increasingly start to replace CRTs. Also from            weight per TV is not due to thinner panels. This trend is
the China country study 9 it is known that TV’s are              expected to continue for anticipated future rise in OLED
among the first products to be bought by lower income            sales as well.
groups. Therefore the income level is not a strong
parameter for prognosing the penetration of LCD TV into                Table 1: LCD TV lifespan and weight in years
the market. Another two parameters to look at are
population size and number of households. The result of                                                  Average POM
our study shows that population and number of                                    Expected lifespan     product weight (in
households are also not very strong parameters that could         Sales year     (median, in years)         kg/pc)
affect the number of LCD TVs sold. In another word,                  2006                 9.7                 14.5
larger population size does not necessary mean more TVs              2007                 9.6                 14.5
sold. With only a weak socio-economic correlation due to
complex anthropological effects, high uncertainty in long-           2008                 9.5                 14.3
term patterns, using external factors to estimate the                2009                 9.4                 14.8
amount of WEEE generated, which is the least explored                2010                 9.2                 14.7
method so far is not recommended for advanced
modelling techniques.                                                2011                 9.1                 14.0
                                                                     2012                 9.0                 13.5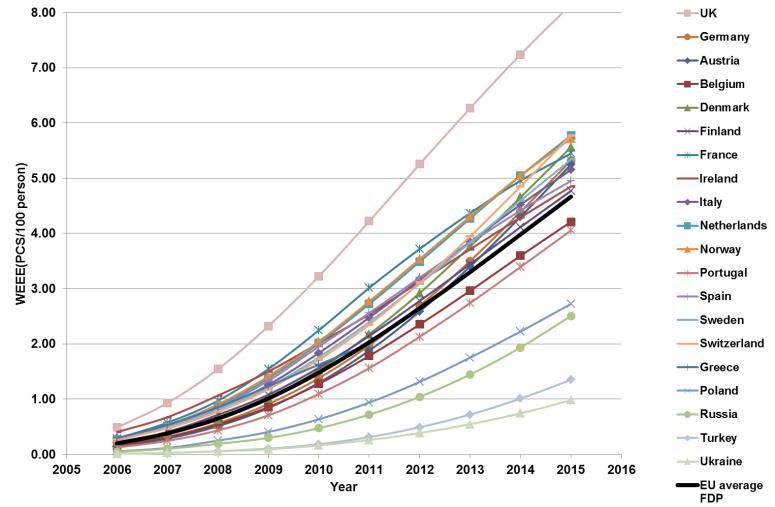
5 STOCK
The stock of equipment that is present in households is
calculated based on the lifespan profiles and the quantities
of EEE put on the market. In 2012, the total stock in
households and companies is calculated together at
maximum 10.8 kg per inhabitant. This is a total of
approximately 80 pieces per hundred inhabitant. However,
In order to make better and more detailed calculations
possible in the future, it is recommended to hold a detailed
survey among consumers in order to gain more insight
into the lifespan of the stock.

Figure 2 shows the number of LCD TVs in stock per
hundred persons (incl. ‘hibernated’ products that are
already ‘out of use’ but not yet physically removed from
the household). As expected, the number of LCD TVs
present in both households and businesses increased. The
black line shows the average amount of LCD TVs in stock                Fig. 3: Market is moving to another level
per hundred person. Basically, it shows dramatic increases
in the number of LCD TVs from less than 10 pieces per          As we move towards 2015 there is also the possibility that
hundred person in stock in 2006 to 60 pieces per hundred       the market face another saturation level as shown in
person in stock in 2015.                                       Figure 3. To make the market to move to next level
                                                               another technology shift is required, and that is where
                                                               moving from CFL to LED as TV backlights can play a
                                                               role.

                                                               6 LCD AND CRT WASTE GENERATION
                                                               With an increase in number of LCD TVs sold between
                                                               2006 and 2010 the total amount of waste is rapidly
                                                               increasing. Due to the lifecycle of around 9.5 years, the
                                                               total market input only becomes substantial around 10
                                                               years later in the WEEE return stream. See also the scale
                                                               for put on market amounts in Figure 1 for comparison.

         Fig. 2: Stock (pieces per hundred person)

Although the LCD TV sales and stock levels have upward
trends over the past ten years, but it is predicted that the
market will reach a saturation level around 2013. At the
point of saturation, further growth can only be achieved
through product improvements. This phenomenon is easily
explained in Figure 3 for the transfer from bulky CRT
TVs to FDP TVs. The graph shows the evolution of total
stock of TV compared with the number of households
between 1990 and 2015. As number of households
increase the total TV stock increase as well, but at a                 Fig. 4: WEEE (pieces per hundred person)
certain point (in 2005) the market faced a saturation level
and with introducing LCD TV to the market and shifting
from analog to digital (CRT to LCD) the market moves to
the next level.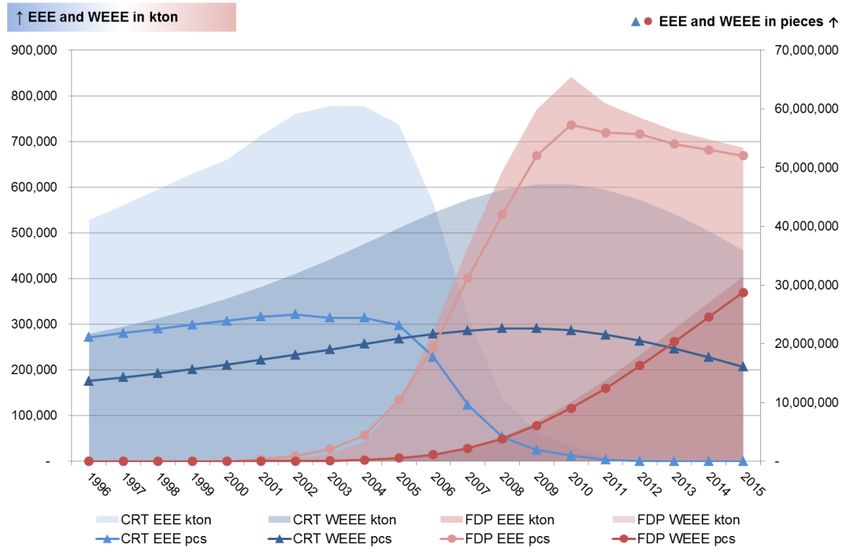
Fig. 5: CRT replacement and expected WEEE

Figure 5 presents the CRT replacement and the amount of         from the survey; it is calculated that 1.74 kilogram per
waste generated for the whole EU market between 1996            inhabitant of TV’s was put on the market in 2010 in the
and 2015, both in kiloton (kton) and pieces. Around the         Netherlands.
year 1996, CRT sales were at a level of 20 million units,
and increased slightly from 1996 to 2005. From 2006 sales              Table 2: The Dutch TV Waste flow 2010 3
fell steeply to less than 10 million and continues to decline
to about zero pieces in 2011. Simultaneously, the number
of CRT in the waste stream rose gradually from 15 million
pieces in 1996 to 20 million pieces in 2009 and declined
gradually after 2009. Given the technology shift and
introduction of flat panel displays, flat panel display sales
increased dramatically from 10 million pieces in 2005 to
55 million pieces in 2012. It is predicted that there will be
a gradual decline in sales after 2012. The number of FPD
TV’s sold by 2015 will be equivalent to 700 to 800
thousands ktons. As the number of flat panel display sales
is rapidly increasing, the number of FPD pieces in waste
stream is increasing as well. It is estimated that 30 million
of FPD will reach to their end of life by 2015 which is
equivalent to 400,000 ktons. it is obvious that the market
will continue to saturate with increasing sales of LCD,
before they enter the return stream in substantial volumes.

7 LCD TV END OF LIFE SCENARIOS
To find out where LCD TVs end up after disposal an
extensive WEEE market survey conducted in 2010 in the
Netherlands by looking at sales, stocks, lifespans, waste
generation and from there at reported and previously not
reported recycling, as well as legal and illegal export         Export of used TV is documented as 0.49 kg/inhabitant,
flows and waste bin sorting analyses. The result of the         (28% of Put on Market). Export of used TV reduces the
survey was a mass balance for the flow of all EEE and           WEEE potential that can be collected and treated in the
included TV’s as well 3. Based on the results derived
Netherlands to 1.36 kg/inh. The ratio of TV waste             3. Given the fact that the number of households, TV
generated in the Netherlands over (same year) POM is 78%         stock and residence time could be varied from country
in weight. Of this, the appointed producer compliance            to country, therefore it is advised to include future
schemes Wecycle and ICT~Milieu collected and treated             information from consumer surveys in more countries
1.25 kg/inh (71% of POM). The WEEE generated model               for more detailed outcomes.
calculates the amount of WEEE plus used TV generated in
the Netherlands at 1.85 kg/inh. The ratio of WEEE plus        4. A large part of the complementary flow is managed by
used TV versus the same year POM is 106% in weight,              the national recyclers. Therefore, it is advised to get
mainly due to many much heavier CRTs in the return               more complete reporting on return streams outside the
stream. Parallel to this, the total complementary recycling      contracted recycling from recyclers. Especially
stream is 0.05 kg/inh (2.8% of same year POM). No TV’s           because these data could vary from country to country.
are reported to end up in the waste bin due to size
constraints and ending up in incineration or landfill. A
more detailed quantification of TV flows in the WEEE          10 ACKNOWLEDGMENT
chain is presented in table 2. Similar information as shown   The research leading to these results has received funding
here for the Netherlands is rarely available for other EU     from the ENIAC Joint Undertaking under grant agreement
countries. However, it is expected that also in other         nr. 296127.
countries the consumer and trading behavior will be very
similar.
                                                              REFERENCES
8 CONCLUSIONS                                                    [1] Clara, S., (2013): NPD Display Search: Global
1. The quantity of LCD TVs put on the market is                      LCD TV Shipments Fall for the First Time in
   minimum 0.405 kg per inhabitant and maximum 1.89                  2012; Outlook Cautious for 2013, [online],
   kg per inhabitant in 2012.                                        Avaliable                                   at:
                                                                     http://www.prweb.com/releases/DisplaySearch/Pl
2. In 2012, the total LCD TV stock in households and                 asma/prweb10553287.htm
   companies is calculated together at minimum 1.35kg
   and maximum 10.8 kg per inhabitant. This is a total of         [2] The statistics portal (2012): TV shipments
   approximately 10 to 80 pieces per hundred inhabitants.             worldwide in 2012, by technology (in 1,000's),
                                                                      Avaliable                                      at:
3. Average LCD TV lifespan is around 10 years and is                  http://www.statista.com/statistics/260316/global-
   steadily declining.                                                tv-shipments-by-technology/

4. Due to the lifespan of around 10 years, the total market
   output as waste only becomes substantial around 10             [3] Huisman, J., Maesen M., Eijsbouts R.J.J., Wang
   years later in the WEEE return stream                              F., Baldé C.P., Wielenga C.A. (2012): The Dutch
                                                                      WEEE Flows. United Nations University, ISP–
5. Due to CRT replacement the LCD sales has drastically               SCYCLE, Bonn, Germany.
   increase from 2 to 4 pieces per hundred person to 8 to
   10 pieces from 2006 to 2010, but the amount remains            [4] Magalini, F., Huisman J., Wang F., Mosconi R.,
   constant between 8 to 10 pieces sold per hundred for               Gobbi A., Manzoni M., Pagnoncelli N.,
   the last five years for EU15.
                                                                      Alemanno A. , Monti I. (2012): Household
                                                                      WEEE Generated in Italy (WAIT), Analyis on
                                                                      volumes & Consumer Disposal Behavior for
9 RECOMMENDATIONS                                                     Waste Electric and Electronic Equipment.
1. From a research point of view it is advised to repeat
   the monitoring and validation of the sales data in             [5] Huisman, J. (2013): (W)EEE Mass balance and
   cooperation with the compliance schemes and national               market structure in Belgium, United Nations
   statistics per country involved in the study.                      University.

2. This study was mainly dealing with LCD TVs.                    [6] Wang, F., Huisman J., Stevels A. , Baldé C.P.
   Obviously more data are required to estimate different             Enhancing e-waste estimates: Improving data
   types of TV’s in the waste stream.                                 quality by multivariate Input–Output Analysis,
Waste Management.
[7] Ashby, M.F. (2013): Chapter 3 - The material life
cycle, Materials and the Environment (Second
Edition), pp. 49-77.
[8] Huisman, J. (2012): Eco-efficiency evaluation of
WEEE take-back systems, Waste Electrical and
Electronic Equipment (WEEE) Handbook, pp.
93-119.
[9] Wang, F., Kuehr R., Ahlquist D. , Li J. (2013): E-
waste in China: A country report, Bonn / BejingYou can also read