Residential Developer Market Intelligence

Page created by Morris Ramsey
 
CONTINUE READING
Residential Developer Market Intelligence
Residential Developer
   Market Intelligence

                  MAJOR RESEARCH PARTNER

Q1 –2019
Residential Developer Market Intelligence
Welcome to the Q1-2019 edition of the UDIA NSW Residential Developer Market Intelligence (RDMI)
report. The quarterly RDMI aims to provide a targeted residential market performance update across
the Greater Sydney, Lower Hunter, Central Coast, Illawarra and ACT housing markets.

This publication is prepared with the understanding that residential property market dynamics are
complex and nuanced, and thus quality, timely market intelligence is essential for market participants
supplying new products.

The publication draws upon a range of information sources including exclusive and bespoke data
provided by CoreLogic - our key research partner. A key feature of the RDMI report is the inclusion of
‘bottom-up’ insights provided by our leading developer members on the state-of-play in their regional
market of operational focus.

The RDMI reporting output and content inclusions continues to evolve, and in this edition we
are pleased to present a new dashboard headline indicators section - in the opposing page. This
dashboard highlights the continuation of challenging market conditions facing the development
sector as the property downturn continues to unfold across the State.

UDIA NSW expects the subdued demand profile for new residential products to persist for at least
the next six months and most likely into the 2020 calendar year. Underpinned by a ‘credit crunch’ for
both retail consumers and developers in the wake of the Banking Royal Commission, we expect the
soft market conditions to continue to put downward pressure on pricing and sales volumes over the
coming period.

I trust the data and insights in this RDMI are of value for you and your organisation, and would
welcome any feedback or thoughts about the publication emailed to tadams@udiansw.com.au

                   Toby Adams

                   General Manager – Strategy & Research

                   UDIA NSW

                                                                        Cover Image: No. 1 Lacey by Cornerstone Property

         Research Partners                              Gold Sponsors                               Silver Sponsors
Residential Developer Market Intelligence
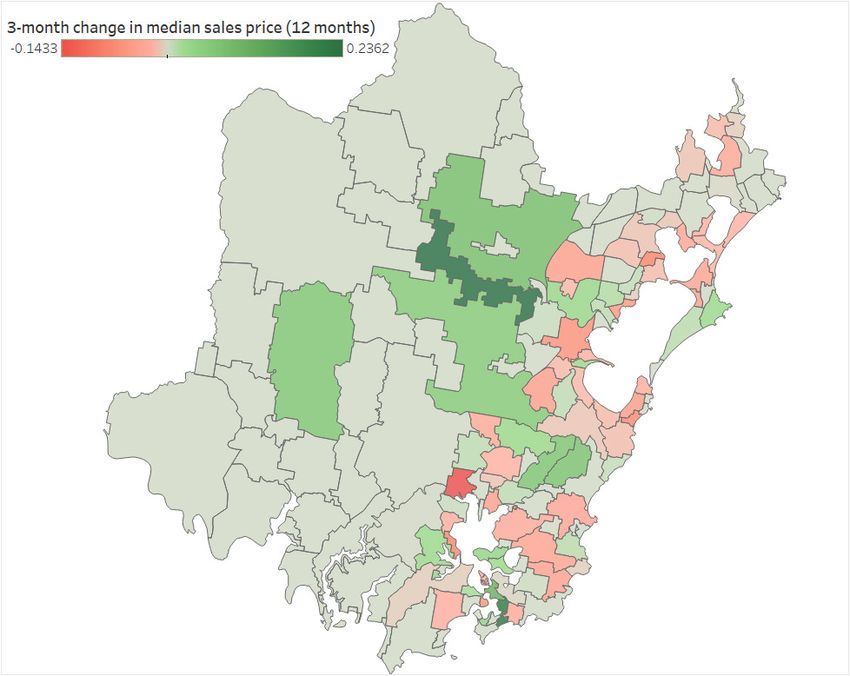
Market Performance Headline Metrics

            Median House        Volume of House     Median Unit Sale     Volume of Unit      Change in Approvals
            Sale Price (set-     Sales (settled)     Price (settled)     Sales (settled)   (12 months to Feb 2018
            tled) (3-month     (3-month change)    (3-month change)    (3-month change)    vs 12 months Feb 2019)
                change)
Greater
Sydney         -1.6%               -6.3%               -0.2%                -1.4%               -17%

Central        -1.5%                -7.6%              -0.9%               -4.2%                26%
Coast

Lower          -0.3%               -6.2%                -1.1%              -8.4%                -15%
Hunter

Illawarra      -1.3%               -6.2%               -0.5%               -4.5%                12%

ACT             1.2%               -3.2%               -0.2%                -1.4%                60%
Residential Developer Market Intelligence
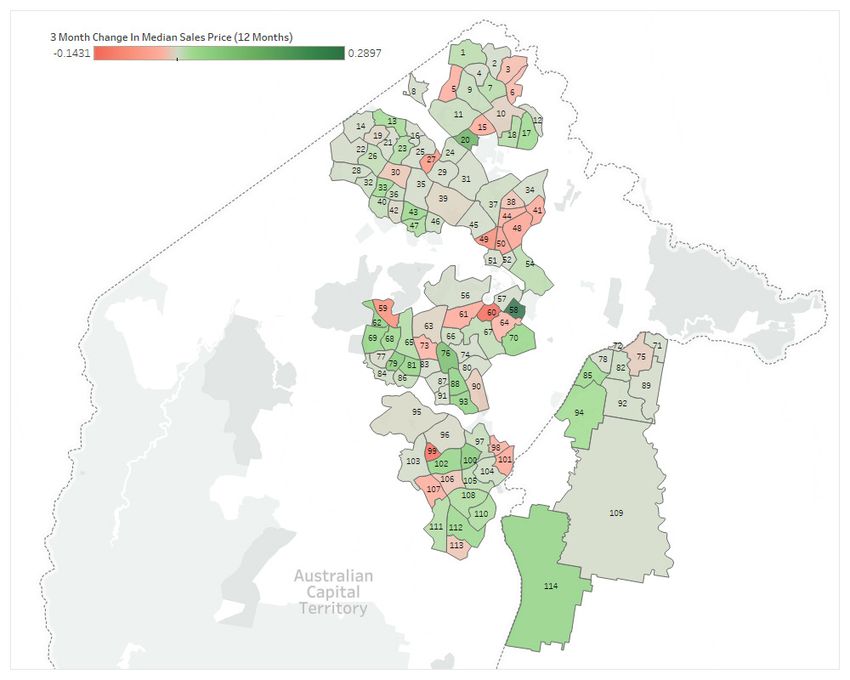
Economic                       Cash Rate and Average Lending Rates
                              Snapshot
•   The latest ABS statistics to Septmber 2018 show
    a 34% drop in the natural population increase
    from the previous quarter. The strong population
    growth in NSW remains bolstered primarily by net
    overseas migration. In Q3-2018, NSW experienced
    a net increase of 35,500 people which was 39% of
    the total net Australian population increase for the
    quarter.
•   In February 2019, NSW’s unemployment rate was
    4.3% which is significantly lower than the national
    average. This is below even the low national average
    of 5%, with total employment growing in NSW by
    2.3% over the preceding 12 months.
                                                              Source: RBA
•   The official cash rate has remained steady at 1.5%
    for 31 months now since August 2016.
•   Consumer sentiment across the two major indices
    fell slightly to start the year (4.4%, ANZ Roy-Morgan;
    5.3% Westpac-Melbourne Institute)
                                                             Consumer Price Index (CPI)
Population Growth (NSW)

Source: ABS
                                                             Source: ABS

NSW Employment/Unemployment                                  Consumer Sentiment
(Seasonally Adjusted)

Source: ABS

                                                             Source: Roy Morgan
Residential Developer Market Intelligence
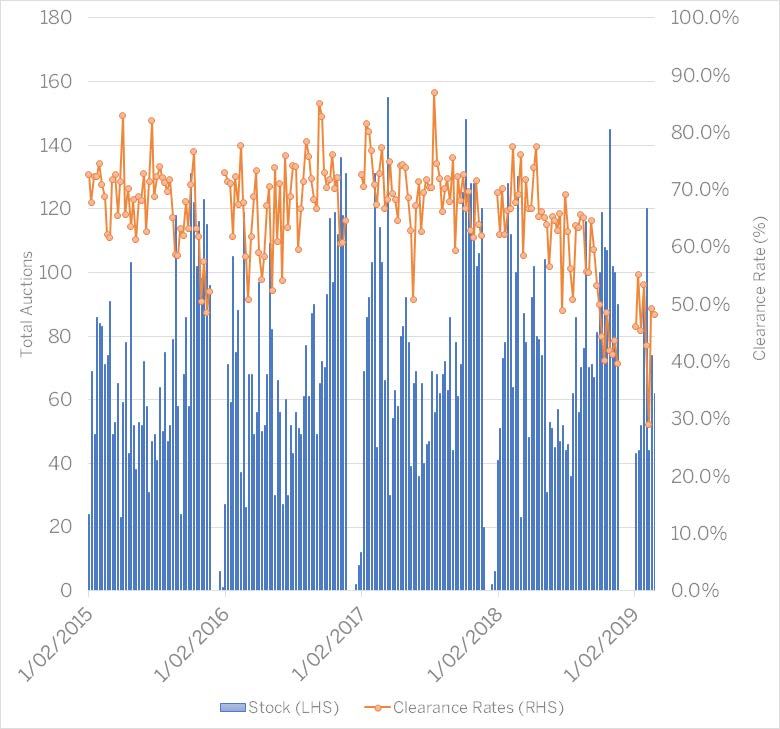
National                                                             Housing Affordability Ratio (National)

    Housing Snapshot                                                                                       7.5

                                                                                                           7.0

•      The total volume of residential dwelling approvals

                                                                          Dwelling Price to Income Ratio
       continues to decline in most capital cities. In the year                                            6.5

       to February 2019, the Sydney approval pipeline has
       contracted by 17% and Melbourne’s by 13%.                                                           6.0
•      First home buyers accounted for 18% of national
       house sales in January 2019, a proportion that has
       been largely maintained since October 2017.                                                         5.5

•      The national housing affordability ratio for detached
       dwellings (x7.8) and multi-units (x6.4) has improved                                                5.0
       marginally in recent months on the back of falling                                                                                                                     Detached

       pricing in Sydney and Melbourne.                                                                    4.5
                                                                                                                                                                              Multi-unit

•      The median sale price for new units in Sydney in
       December 2018 was $735k, which was 24% higher
       than Melbourne and 41% higher than Brisbane.                                                        4.0

•      The median sale price for new detached houses in

                                                                                                                   2

                                                                                                                          4

                                                                                                                                 6

                                                                                                                                        8

                                                                                                                                                10

                                                                                                                                                        12

                                                                                                                                                                14

                                                                                                                                                                          16

                                                                                                                                                                                       18
                                                                                                                    0

                                                                                                                           0

                                                                                                                                  0

                                                                                                                                         0

                                                                                                                                                     20

                                                                                                                                                             20

                                                                                                                                                                       20

                                                                                                                                                                                    20
                                                                                                                                             20
                                                                                                                 20

                                                                                                                        20

                                                                                                                               20

                                                                                                                                      20
       Sydney was $975k, down 3% from the March 2018
                                                                         Source: CoreLogic
       high.

    First Home Buyers Australia, Proportion
    and Loan Size                                                     Total Approvals 12 Months to Jan 2018
                                                                      vs 12 Months to Jan 2019

                                                                                                                                                                 Multi-unit

                                                                                                                                                                 Detached
                                                                  Dwellings

                                                                      Source: ABS
    Source: ABS

    Median Unit Price (New): Capital Cities                              Median House Price (New): Capital Cities

                                                                         Source: CoreLogic
    Source: CoreLogic
Residential Developer Market Intelligence
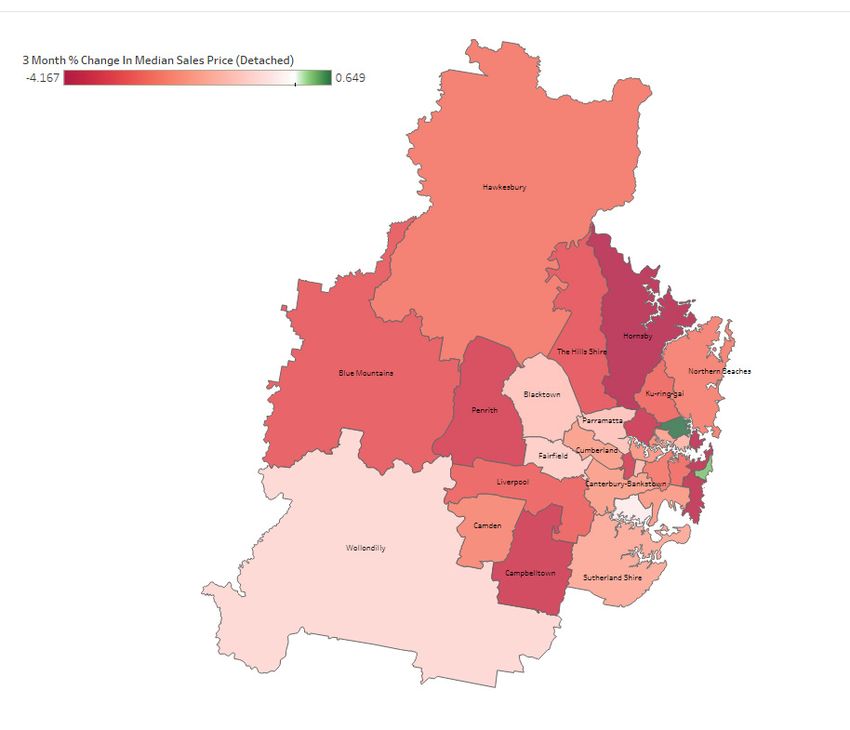
Greater                    Residency Vacancy Rate (Sydney, Monthly)

                                      Sydney
•      Greater Sydney is continuing to feel the effects of the
       current property downturn, with a decline in approvals,
       the ongoing retraction of detached housing price, an
       increase in the residential vacancy rate, and auction
       stock and clearance levels falling short of early 2018
       numbers.
•      The approvals decline has been felt across the Greater
       Sydney region, with every district experiencing
       reduction in total approvals over the last year. The
       Eastern City has recorded the greatest reduction with
       total dwelling approvals contracting by 34%. This
       was followed by the South District (which contracted      Source: REINSW
       by 30%) and the Western City (which contracted by
       15%).
•      Median whole-of-market house price in Greater             Total Approvals (Sydney, Monthly)
       Sydney has fallen by 1.6% in the last 3 months, and
       the volume of house sales has fallen by 6.3%. New
       detached house price has fallen by 1.5% in the last 3
       months.
•      Median whole-of-market unit price has contracted by
       0.2%, with the volume of unit sales down 1.4% over the
       last 3 months. New unit price has increased by 0.3%.
Change in New House and New Unit Price
(Rolling 3 month Average) (Sydney)

                                                                 Source: ABS

                                                                 Approvals by District 12 months to Jan 2018
                                                                 vs 12 months to Jan 2019

    Source: CoreLogic

    Weekly Auction Clearance Rates (Sydney)

                                                                 Source: ABS
    Source: CoreLogic
Residential Developer Market Intelligence
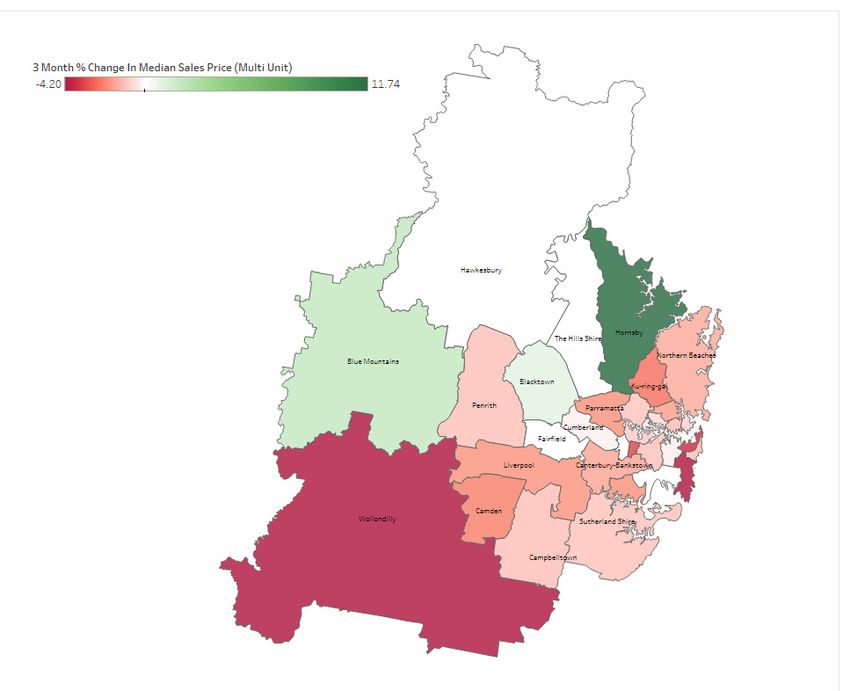
Greater                     Median Sale Price by Quartile, Houses,
                                           Sydney                      Greater Sydney (12 months to Jan 2019)
                                                                                                Upper
Apartment Supply Snapshot                                                                       Quartile:
                                                                                                $1,500,000
                                            Current     Twelve Month
                                                                                                                Upper
                                                          Change
                                                                                                                Quart
                                                                                                Median:
                                                                                                                $950,9
Total Apartment Completions (Cal. Year)     33,270         16%                                  $950,000
                                                                                                                Media
                                                                                                Lower           $720,0
                                                                                                Quartile:       Lower
Total Apartment Yield Under Construction    41,975         55%                                  $690,000        Quart
                                                                                                                $572,0

Total Apartment Yields Approved             65,647         -26%
                                                                                                $0              $0

Median Sale Price of New Units             $720,000        -1.3%
                                           Jan 2019                    Source: CoreLogic

Vacancy Rate (Residential)                    3.2%         2.3%
                                           (Feb 2019)   (Feb 2018)

                                             $540         -0.9%
Median Asking Rent (Residential)
                                                                       Median Sale Price by Quartile, Units,
                                                                        Upper Sydney (12 months to Jan 2019)
                                                                       Greater
Median Rental Yield
                                             3.9%          N/A          Quartile:
                                                                        $1,500,000
Source: CoreLogic                                                                              Upper
                                                                                               Quartile:
Median Days on Market, Selected LGAs (12 months to Jan 2019)            Median:
                                                                                               $950,950
                                                                        $950,000
                                                                                               Median:
                                                                        Lower                  $720,000
                                                                        Quartile:              Lower
                                                                        $690,000               Quartile:
                                                                                               $572,000

                                                                         $0                    $0

                                                                       Source: CoreLogic

Source: CoreLogic

  Developer Insight
   “There is no doubt that negative sentiment combined with lending policies
   is having a significant impact across Sydney’s market. Sales activity has
   decreased with most buyers preferring to wait on the sidelines. There is some
   settlement risk to work through in 2019, particularly in lower quality areas with
   localised over-supply. On the positive side, we are seeing increased first home
   buyer activity spurred by improved affordability while the fundamentals of
   population growth and economic activity remain strong. The re-election of the
   State Liberal government will provide policy continuity to underpin industry
   investment, however housing approvals have fallen sharply suggesting that
   Sydney’s housing supply targets will not be met in coming years. We expect to
   see a period of undersupply that will coincide with an improvement in market
   conditions. ”

   Mike Williams – Head of Strategy & Acquisitions, Legacy Property
Residential Developer Market Intelligence
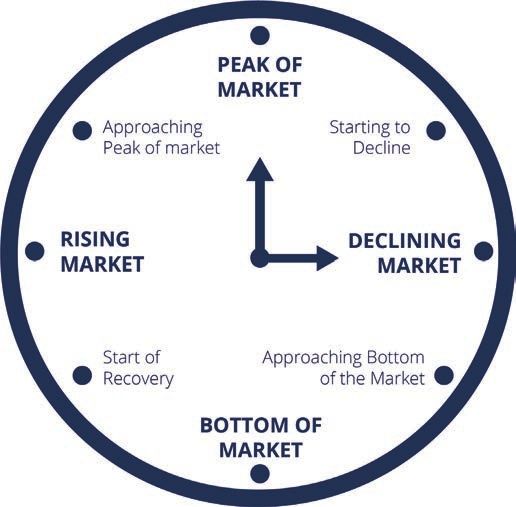
Greater Sydney (Detached)
                     LGA 3 Month % Change in Median Sales Price
                     (Whole of Market, as at 31/01/2019)

  %                                   %
                              0%

                                                                             1             14
                                                                                      15              1.    Ryde
                                                                                 16         13 12
                                                                             2                        2.    Canada Bay
                                                                                                      3.    Strathfield
                                                                        3 4                     11    4.    Burwood
                                                                                  5        8     10   5.    Inner West
                                                                                                9     6.    Georges River
                                                                                  7                   7.    Bayside
                                                                         6                            8.    Sydney
                                                                                                      9.    Randwick
                                                                                                      10.   Waverly
                                                                                                      11.   Woolhara
                                                                                                      12.   Mosman
                                                                                                      13.   North Sydney
                                                                                                      14.   Willoughby
                                                                                                      15.   Lane Cove
                                                                                                      16.   Hunters Hill

                                                                  Source: CoreLogic

Spotlight on South District: LGA Market Update

Source: CoreLogic
Residential Developer Market Intelligence
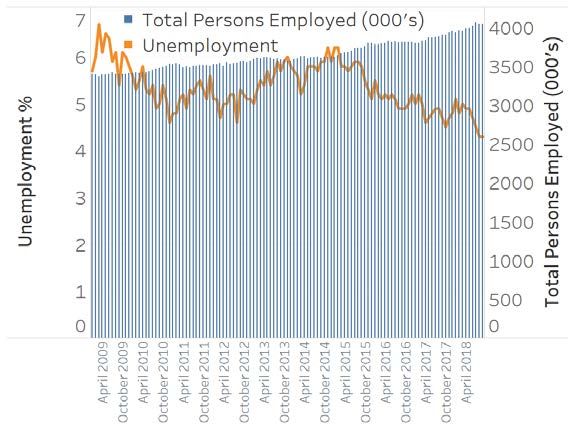
Greater Sydney (Multi Unit)
                         3 Month % Change in Median Sales Price
                         (Whole of Market, as at 31/01/2019)

             %                                 %
                    0%

                                                                            1             14
                                                                                     15
                                                                                16         13 12     1.    Ryde
                                                                            2                        2.    Canada Bay
                                                                                                     3.    Strathfield
                                                                        3 4                    11    4.    Burwood
                                                                                 5        8     10
                                                                                                     5.    Inner West
                                                                                               9     6.    Georges River
                                                                                 7                   7.    Bayside
                                                                        6                            8.    Sydney
                                                                                                     9.    Randwick
                                                                                                     10.   Waverly
                                                                                                     11.   Woolhara
                                                                                                     12.   Mosman
                                                                                                     13.   North Sydney
                                                                                                     14.   Willoughby
                                                                                                     15.   Lane Cove
                                                                                                     16.   Hunters Hill

                                                                  Source: CoreLogic

Spotlight on North District: LGA Market Update

Source: CoreLogic
Residential Developer Market Intelligence
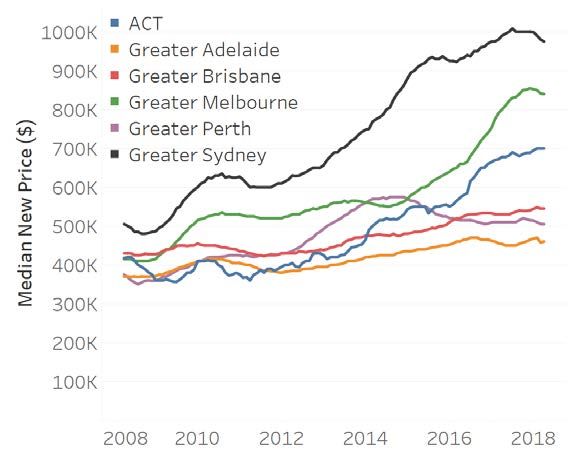
Central                  Approvals (Central Coast, Monthly)

                                   Coast
•   Approvals in the Central Coast have dropped off in
    recent months, with rolling annual dwelling approvals
    falling 5% over the 3 months to February 2019.
•   The price of new houses and units has remained
    relatively flat in the 3 months to January 2019, with
    the median new house price falling by 2% and the
    median unit price remaining at $585k.
•   Whole of market house and unit prices were similarly
    stable, despite sales volumes beginning to decline.
    The volume of house sales was down 7.6% in the
    3 months to January 2019, while unit sale volumes       Source: ABS
    were down 4.2%.                                         Approvals (Central Coast) by Dwelling Type,
•   The suburbs with the greatest 3-month movement
    in median house price were Wyong Creek (23.6%           12 Months to Feb 2018 vs 12 Months to Feb 2019
    increase), Kilcare (21.4% increase) and West
    Gosford (14.3% decrease). The greatest 3-month
    movements in unit prices were in Wamberal (13.4%
    increase), Booker Bay (13.3% decrease) and Toukley
    (6% decrease).
Median New House and Unit Price
(Central Coast, Monthly)

                                                            Source: ABS

                                                            Completions (Central Coast, Monthly)

Source: CoreLogic

Vacancy Rates (Central Coast, Monthly)                      Source: NSW DPE

                                                            Weekly Rents (Central Coast, Jan 2019)
                                                                                Median    12 Month     Rental
                                                                                Asking    Change in     Yield
                                                                                 Rent    Asking Rent

                                                            Houses              $450       0.0%        3.6%

                                                            Multi-Unit          $390       2.6%        4.1%

                                                            Source: CoreLogic

Source: REINSW
Central Coast             3 Month % Change in Median Sales Price
                          (Whole of Market, as at 31/01/2019)

    15%
      %                                   %
                                        24%
                    0%

                                                           Source: CoreLogic

Central Coast Update as at 31/01/2019

Source: CoreLogic
Lower                 Approvals (Greater Newcastle, Monthly)

                                     Hunter
•   Lower Hunter approvals are also in decline, falling
    16% in the 3 months to February 2019.
•   New house and unit prices are starting to show signs
    of contraction. House prices in Newcastle and Lake
    Macquarie fell by 1%, while the rest of the Hunter
    had no change. Unit prices across the Hunter fell
    by 2%. Established house prices were stable, while
    established unit prices dropped by 1%.
•   Sales volumes have begun to decline in the Lower
    Hunter, with house sales down 6.2% and unit sales
    down 8.4%.
•   The suburbs with the greatest 3-month movement         Source: ABS
    in median house price were Croudace Bay (20.9%
    increase), Holmesville (13.7% increase) and Salt Ash   Approvals by LGA Jan 2018 vs Jan 2019
    (13.4% increase). Those with the greatest 3-month
    movement in median unit price were Hamilton
    (22.9% increase), the Junction (19.9% decrease)
    and Edgeworth (14.7% decrease).
Median New House and Unit Price
(Hunter, Monthly)

                                                           Source: NSW DPE, ABS

Source: CoreLogic                                          Weekly Rents (Newcastle LGAs, Jan 2019)
                                                                                  Median    12 Month     Rental
Residency Vacancy Rates (Hunter, Monthly)                                         Asking    Change in     Yield
                                                                                   Rent    Asking Rent

                                                                                  $370       5.7%        4.8%
                                                           Cessnock               $290       0.0%        5.6%

                                                                                  $430       2.4%        4.1%
                                                           Lake Macquarie         $370       2.8%        4.6%

                                                                                  $410        2.5%       4.5%
                                                           Maitland               $320       10.3%       5.3%

                                                                                  $450       4.7%        3.7%
                                                           Newcastle              $405       2.5%        4.0%

                                                                                  $430       2.4%        4.2%
                                                           Port Stephens          $350       6.1%        4.4%

                                                           Source: CoreLogic
Source: REINSW
Lower Hunter
Local Government Area (LGA) 3 Month Change in Median Sales Price
(Whole of Market, as at 31/01/2019)

                                                            Maitland City

                                                            ↑ 0.0%                      Port Stephens

                                                            ↓ 1.4%                    ↓ 0.9%
                                                                                      ↓ 2.9%
                                          Cessnock
                                        ↑ 0.1%
                                        ↑ 0.0%

                                                      Lake Macquarie                                    Newcastle

                                                          0.0%                                    ↓ 0.8%
                                                          0.0%                                    ↓ 1.0%
                                                                            Source: CoreLogic

LGA Market Update as at 31/01/2019

Source: CoreLogic

  Developer Insight
  “While demand for product in the Newcastle region has reduced slightly off a strong base
  in line with the overall slowdown in investor lending, quality well-priced properties remain
  attractive and Newcastle represents a value proposition within a dynamic labour market. The
  overall Newcastle fundamentals remain sound.”

  Suzanne Pitson – General Manager of Sales and Marketing, DHA
Approvals (Illawarra, Quarterly)

                             Illawarra
•   Dwelling approvals in the Illawarra have started
    to slow, increasing by just 3% in the 3 months to
    February 2019.
•   New house and unit prices have remained flat over
    the last 3 months, with the median new house
    price falling just 0.5%. The established market
    fared slightly less well, with the median house price
    dropping 1.3% and the median unit price falling
    0.5%.
•   Sales volumes are starting to decline, with house
    sales down 6% and unit sales down 4.5%.
•   The suburbs that experienced the greatest
    movement in median house price over the 3
    months to January 2019 were Bawley Point (15.4%
    increase), Minnamurra (15% decrease) and Dolphin        Source: NSW DPE, ABS
    Point (14.2% decrease). The suburbs with greatest
    3-month movement in median unit price included
    Coniston (15.1% increase), West Wollongong (11.7%       Approvals by LGA, 12 Months to Feb 2018
    increase) and Gerringong (7.8% decrease).               vs 12 Months to Feb 2019

Median New House and Unit Price
(Illawarra, Monthly)

Source: CoreLogic                                           Source: NSW DPE, ABS
Residency Vacancy Rates (Illawarra, Monthly)
                                                            Weekly Rents (Illawarra LGAs, Jan 2019)
                                                                                   Median    12 Month     Rental
                                                                                   Asking    Change in     Yield
                                                                                    Rent    Asking Rent

                                                                                   $580       3.6%        3.3%
                                                            Kiama                  $470       4.4%        4.0%

                                                                                   $500       0.0%        4.0%
                                                            Shellharbour           $420       5.0%        4.2%

                                                                                   $395       3.9%        3.7%
                                                            Shoalhaven             $330       0.0%        4.1%

                                                                                   $510       2.0%        3.5%
                                                            Wollongong             $400       0.0%        3.5%

Source: REINSW
                                                            Source: CoreLogic
Illawarra
Local Government Area (LGA) 3 Month Change in Median Sales Price
(Whole of Market, as at 31/01/2019)

                                                                            Wollongong
                                     Kiama
                                                                           ↓ 1.3%
                                  ↓ 3.2%                                   ↓ 0.5%
                                  ↓ 0.4%

                                                                                         Shellharbour
                                                                                     0.0%
                                                                                    ↓ 1.0%
                                              Shoalhaven

                                              ↓ 0.7%
                                                  0.0%

                                                 Source: CoreLogic

LGA Market Update as at 31/01/2019

Source: CoreLogic

  Developer Insight
  “Sale prices have been flat or marginally lower over the last quarter, coming
  off a high base. In general, prices in the region have fared slightly better than
  Sydney, although there has been significant growth in listings for units over
  the last year. Demand for greenfield and detached housing products remain
  strong, buoyed by strong employment and population growth. However, we
  continue to see some potential buyers struggling with financing as a result
  of the changes at the major lenders. We need to continue releasing a steady
  supply of serviced land in the urban release areas to keep prices affordable, as
  well as pushing for caps on developer taxes and charges in the face of lower
  sale prices.”

  Alby Peros – Development Manager, Stockland
ACT &                            Approvals (New, ACT, by Dwelling Type) 12
                                                             Months to Feb 2018 vs 12 Months to Feb 2019
                            Queanbeyan
•     Approvals in the ACT & Queanbeyan have also
      slowed, increasing by just 1% in the 3 months to
      February 2019.
•     The median house price in the ACT has increased
      by 1.2% to $658k, while unit prices remained flat at
      $426k.
•     Sales volumes have fallen slightly over the last 3
      months, with house sales down 3.2% and unit sales
      down 1.4%.
•     The suburbs with the most significant 3-month
      movement in median house price were Kingston
      (29% increase), Forrest (14.3% decrease) and Oxley
      (14% decrease). Those with the greatest 3-month
      movement in median unit price were Chifley (26.2%
      increase), Barton (23% increase) and Weston
      (21.8% increase).                                      Source: ABS

Weekly Auction Clearance Rates (ACT)
                                                             Approvals (New, Queanbeyan, by Dwelling
                                                             Type) 12 Months to Feb 2018
                                                             vs 12 Months to Feb 2019)

                                                             Source: ABS

                                                             Completions (ACT, Quarterly)

Source: CoreLogic
 Approvals (ACT & Queanbeyan, Monthly)

                                                             Source: ABS
    Source: ABS
ACT & Queanbeyan
3 Month Change in Median Sales Price (Houses), as at 31/01/2019

            15%
              %                      29%%
                    0%

                                                      ACT
                                                                  Queanbeyan Urban
                                                                  (NSW)

                                                                         Source: CoreLogic

LGA Market Update as at 31/01/2019

Source: CoreLogic
National Property Clock
                     Adapted from Herron Todd White, Month in Review
                     April 2019

                                       Dubbo
                                       Mid North Coast
                                                                     HOUSES
                  Hobart                                       Canberra
                  Sunshine Coast                               Central Coast

                                                                     Illawarra
                 Adelaide
                                                                     Melbourne
                 Albury
                                                                     Newcastle
                 Launceston
                                                                     Sydney

                      Brisbane                                 Darwin
                      Cairns                                   South West WA

                                       Alice Springs
                                       Perth
                                       Rockhampton
                     Lismore
                     Mid North Coast

Hobart
Sunshine Coast
                                        Central Coast
                                        Coffs Harbour
                                        Gold Coast
                                                            UNITS
                                           Canberra      Newcastle
Bathurst
                                           Illawarra     Perth
Dubbo
                                           Melbourne     Sydney

                                        Brisbane
   Adelaide
                                        South West WA
   Ipswich

                       Cairns                                  Source: Herron Todd White,
                       Whitsunday                              Month in Review, April 2019
ABOUT UDIA
                             THE URBAN DEVELOPMENT INSTITUTE
                           OF AUSTRALIA (UDIA) IS THE PEAK BODY
                         REPRESENTING THE URBAN DEVELOPMENT
                                        INDUSTRY IN AUSTRALIA.
 Officially established in 1963, UDIA NSW has grown to become the leading industry
             body representing the interest of the NSW property development sector.

  UDIA NSW aims to secure the viability and sustainability of the urban development
       industry for the benefit of our members and the communities they create by
                      advocating for more liveable, affordable and connected cities.

       We represent the leading participants in the industry and have more than 500
member companies across the entire spectrum of the industry including developers,
institutional investors, third party logistics providers, financiers, builders, suppliers,
        architects, engineers, lawyers, town planners, academics and state and local
         government bodies. A quarter of these members are based in regional NSW.

   UDIA NSW members are represented by an elected council of 13 leading industry
  practitioners who are responsible for the strategic direction of the Institute. UDIA
 NSW also has an extensive committee and regional chapter structure that involves
more than 300 of the development industry’s key stakeholders in policy formulation.

                                          UDIA NSW OFFICE
                                          UDIA NEW SOUTH WALES
                                          02 9262 1214

                                          LEVEL 5, 56 CLARENCE ST.
                                          SYDNEY, NSW 2000

                                          www.udiansw.com.au

                                          udia@udiansw.com.au
Image: Wivenhoe Village by Mbark

                   Research Partners   Gold Sponsors   Silver Sponsors
You can also read