Investor & Analyst Conference Call - Dr. Torsten Derr (CEO) and Thomas Dippold (CFO) - SGL Carbon
←
→
Page content transcription
If your browser does not render page correctly, please read the page content below
Investor & Analyst
Conference Call
Dr. Torsten Derr (CEO) and Thomas Dippold (CFO)

Wiesbaden I March 25, 2021
Agenda

1. Recent Developments
2. FY2020 Results
3. Restructuring Program
4. Outlook 2021
5. New Mid-Term Plan
6. Summary
7. Backup

2
1 Recent Developments

3
SGL Carbon – Transformation on track!
Highlights 2020 & Guidance 2021 New Board of Management
Our • Business negatively impacted by Covid-19
Environment • Semiconductors, China and carbon fibers for
wind industry performed well
Our • Covid-19: Limited impact on our employees &
no shut-down of sites
Highlights
• New & transparent organization
• Restructuring program above plan
Our • -15% sales & over-proportional EBITDA decline
Financials • Strong FCF improvement, net financial debt
unchanged (despite BMW payment)
• Impairment of 107 mEUR in BU CFM
Our • Sales growth: mid single-digit percentage
Guidance ‘21 • EBITDApre growth: 10 – 30%
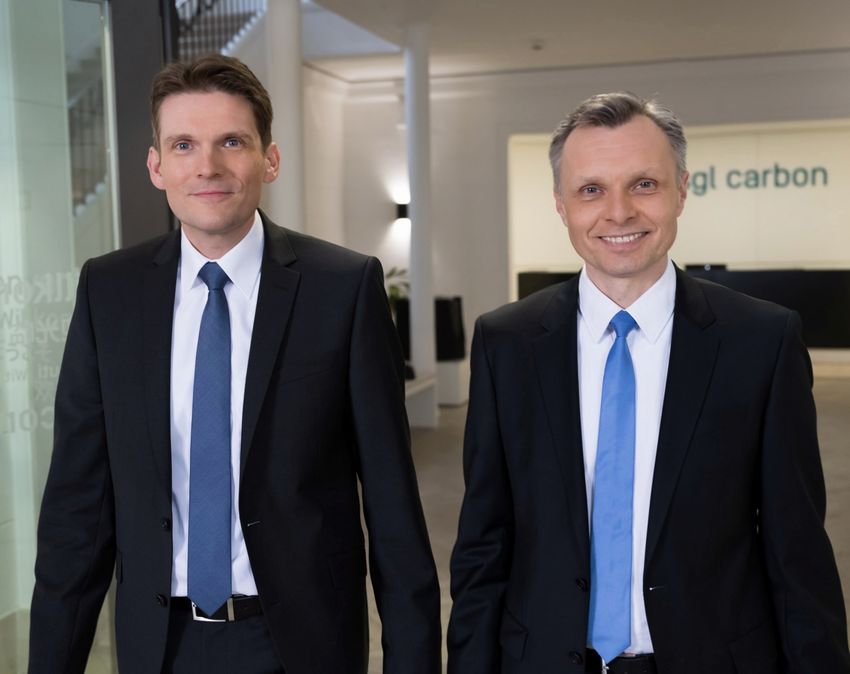
• Net result: -20 mEUR to break-even Dr. Torsten Derr Thomas Dippold
CEO CFO
4
Share price more than doubled last 6 months & Regular entry in SDAX

Share price SGL Carbon (in EUR)                                           Re-Entry on March 22, 2021
       8
                                                              ~7€/share
       7

       6

       5

       4

       3

       2   ~3€/share

       1

       0

SDAX is a registered trademark of a subsidiary of Deutsche Börse Group
5
2 FY2020 Results 6
Covid hit topline – Countermeasures helped Operating EBIT to stay
slightly positive

Key figures 2020 (in mEUR)                                                                        Key developments
                                                                                                  Sales
Sales                                     EBIT*                           Operating EBIT**
                                                                                                  • 15% below 2019 due to Covid
                 -15%                                       4%                      -58%            downturn and expected lower
                                                                                                    GAM-business

                         1,087                      50                                            • Recovery in second half of 2020
                                                                     48                    47
         919                                                                                      EBIT
                                                                                                  • 4% higher than 2019 due to
                                                                                                    several one-off countermeasures
                                                                                                    like land sale and SDK
                                                                               20                   compensation
                                                                                                  • Recurring operating EBIT
                                                                                                    significantly below PY

        2020             2019                     2020             2019      2020          2019
* before non-recurring items; ** before non-recurring and one-off items
7
SGL Carbon with slightly positive Operating EBIT in 2020
EBIT bridge 2020 (in mEUR)
50
-10
-8
-7 20
-5
107
2
25
10
9 -94
29
-132
Net Result Interest Taxes/ EBIT Purchase Restruc- Other Impairment EBIT SDK/ Land One-offs Insurance Operating
Other Price turing Restructuring loss before Other sale Personnel Compensation EBIT*
Allocation Program non-
recurring
* before non-recurring and one-off items items
8Strong cash development due to one-offs, reduced CAPEX & strict
working capital management
Key figures 2020 (in mEUR) Key developments
Net result
Net result Free cash flow (FCF)* Net debt
• With -132 mEUR at upper end of
guidance
74 • Impairment and restructuring
287 289 costs main effects for loss
Free cash flow/Net debt
• First positive FCF since seven
years
2020 2019 • Several cash generating effects
contributed
2020 2019 2020 2019 • Net debt slightly reduced despite
-17 BMW payment
-90
-132
* continuing operations
9BU Graphite Materials & Systems suffered from lower GAM business
and overall market downturn
Key figures 2020 (in mEUR) Key developments
Sales
Sales EBIT* Operating EBIT**
• Sales reduction caused by
-20% -50% -60% (expected) lower GAM business
and overall Covid-related slow
623 market development
86 83
EBIT
495
• Due to high fix cost portion and
loss of high margin GAM
business, EBIT was hit over-
42 proportional
33
• Countermeasures helped to
compensate EBIT drop
2020 2019 2020 2019 2020 2019
* before non-recurring items; ** before non-recurring and one-off items
10BU Composites – Fibers & Materials overcame market drop and
achieved operative turnaround
Key figures 2020 (in mEUR) Key developments
Sales
Sales EBIT* Operating EBIT**
• Market downturn in Automotive
-9% and Aerospace compensated by
market penetration in Wind
432 EBIT
391
19 • Despite low margin Wind
business, EBIT improved strongly
14
• Operative improvements and
price increases led to increased
margins
2020 2019 2020 2019 2020 2019
-8 -8
* before non-recurring items; ** before non-recurring and one-off items
11BU Corporate with stable development and strong one-off result
Key figures 2020 (in mEUR) Key developments
Sales
Sales EBIT* Operating EBIT**
• Sales remained stable, SDK exit
0% 61% 4% compensated with SDK
settlement payment
33 33
EBIT
• One-off EBIT measures and
overall cost savings improved
EBIT vs. 2019
2020 2019 2020 2019
2020 2019
-11
-29 -28 -29
* before non-recurring items; ** before non-recurring and one-off items
12Net loss at the upper end of the guidance
Group income statement (in mEUR) Key drivers
2020 2019 • Net sales decline by 15%, mainly
Sales revenue 919.4 1,086.7 Corona-driven and lower GAM
EBITDA before non-recurring items 123.5 120.0 business
Operating EBIT before non-recurring items 19.5 46.6 • Operating EBIT declined by 58%
due to lower sales (Corona, GAM)
One-off effects 30.7 1.8
• EBIT before non-recurring items
EBIT before non-recurring items 50.2 48.4 slightly improved due to one-off
Non-recurring items -143.9 -82.7 effects such as real estate sales,
EBIT -93.7 -34.3 SDK
Net financing result -29.4 -38.9 • Reported EBIT including
Results from continuing operations before impairment and restructuring
-123.1 -73.2 charges
income taxes
Income tax expense, non controlling interests • In summary, net loss of a three
-9.1 -16.8 digit mEUR figure
and income from discontinued operations
Consolidated net result attributable to
-132.2 -90.0
shareholders of parent company
13Balance sheet ratios deteriorated mainly due to negative result
Key figures and ratios (in mEUR) Key drivers
31.12.2020 31.12.2019 • Equity ratio declined strongly due
to impairment
Equity ratio (in %) 17.5 27.8
Total liquidity 141.8 137.1 • Liquidity slightly improved
Net financial debt 286.5 288.5 • Lower net financial debt despite
Gearing (net debt/equity) 1.30 0.69 62 mUSD purchase price
payment to BMW for the Moses
Leverage ratio (net debt/EBITDA*) 2.3 2.4
Lake site
ROCE EBIT* (in %) 4.5 3.9
• Gearing increased mainly as a
result of the lower equity
* before non-recurring items
14First positive Free cash flow since seven years due to one-offs
Cash flow (in mEUR) Key drivers
continuing operations 2020 2019 • Operating cash flow improved
due to working capital reduction
Cash flow from operating activities 104.0 61.9
and payment from SDK
Capital expenditures in property,
plant, equipment and intangible -55.8 -95.1 • Capital expenditure slightly below
assets guidance and well below prior
Cash flow from other investing year level
25.5 15.9
activities1 • Main capex projects in 2020:
Cash flow from investing activities -30.3 -79.2 Increase of production
Free cash flow 73.7 -17.3 capacity for fuel cell
Free cash flow from discontinued components
-1.9 -9.4 Increase of production
operations
capacities for battery cases
Investment in environmental
footprint
• Strong improvement of FCF by
more than 90 mEUR compared
1dividend payments and capital repayments from investments accounted for At-Equity, payments for the acquisition / disposal to prior year
of subsidiaries, net of cash, proceeds from sale of intangible assets and property, plant and equipment
153 Restructuring Program 16
First step in restructuring: The company culture!

17
Decisive initiatives with immediate P&L contribution

18
New organization enhances transparency & management rigor

                  From…                                                                  …to

                                                              PRINCIPLES                       Reporting   Reporting             Reporting    Reporting
                  Reporting Segment     Reporting Segment
                                                                                               Segment     Segment               Segment      Segment
                                                              Distinct business model

                          BU                     BU           Homogenous customer
Business units

                   Graphite Materials      Composites -       base
                      & Systems          Fibers & Materials   Integration of resources
                        (GMS)                  (CFM)          & sites
                                                                                           BU Graphite     BU Process            BU Carbon   BU Composite
                                                                                            Solutions      Technology              Fibers      Solutions
                                                                                              (GS)            (PT)                  (CF)         (CS)

                          Central Innovation and Lab

                                    Sites
Corp. functions

                                                              PRINCIPLES
                                                              Global responsibility
                                  From 20…                    Increased efficiency                                      …to 10
                                                              Cost reduction

19
SGL Carbon’s transformation slightly ahead of plan
Status 31.12.2020 Target
Implementation >700 Initiatives
of Initiatives
37%
Recurring >100 mEUR
savings Realized Initiated
40 mEUR 56 mEUR
Headcount >500 FTE
reduction Realized Initiated
53% 85%
Versus base year 2019
204 Outlook 2021 21
SGL Carbon to report EBIT / EBITDA pre-exceptionals

Definition of exceptionals (for 2021)
• Depreciation in accordance with IFRS:
     ‒ straight-line depreciation including the effects of impairment (IAS 36)
     ‒ purchase price allocations (IFRS 3)
     ‒ depreciation on assets held for sale in accordance with IFRS 5

• Restructuring expenses

• Proceeds from the sale of land and buildings

• Proceeds from insurance claims, provided they are not counterbalanced by any offsetting items during the
  reporting period

• Other material one-off impacts, which are not reflecting the underlying business development

22
SGL Carbon with improved market focus in four new business units
New business unit structure Rationale
Until Graphite Materials & Systems Composites – Fibers & Materials Distinct business model
FY2020 (GMS) (CFM)
Homogenous customer base
New
Graphite Process Carbon Fibers Composite
from
Solutions (GS) Technology (PT) (CF) Solutions (CS) Allocated assets & sites
FY2021
~500 mEUR ~100 mEUR ~300 mEUR ~100 mEUR
Sales* Sales* Sales* Sales*
* Sales for new business unit structure indicative for FY2021
23BU Graphite Solutions (GS) – Market to recover in 2021
Sales (in mEUR) Key drivers
slight
increase • Business is late cyclical
516 Semiconductor business remains strong
408
Industrial business still weak
• EBITDA impact overproportional compared to sales
• Semiconductors & China will drive the business
2019 2020 2021e
• Growth opportunities
Graphite anode material for Li-ion batteries for EV
EBITDApre (in mEUR) Gas diffusion layer for fuel cell
• EU battery funding (IPCEI) of 42.9 mEUR
significant
101 increase
63
2019 2020 2021e
24SGL Carbon – 42.9 mEUR funding for graphite anode materials in batteries What is IPCEI? • Important Project of Common European Interest • Project “European Battery Innovation” Setup value chain for EV battery infrastructure in EU 2.9 bnEUR funding to 42 direct participants • SGL = European producer of graphite anode material • SGL to receive 42.9 mEUR funding until 2028 25
BU Process Technology (PT) – Dependent on chemical industry
Sales (in mEUR) Key drivers
stable • New business unit head
107 • Production of graphite equipment
88
(i.e. heat exchanger, synthesis systems)
• SGL Carbon is technology leader
2019 2020 2021e • Business driven by economic development of chemical
industry
Growth
EBITDApre (in mEUR) Maintenance shutdowns
• Recovery expected in 2022
9
stable
3
2019 2020 2021e
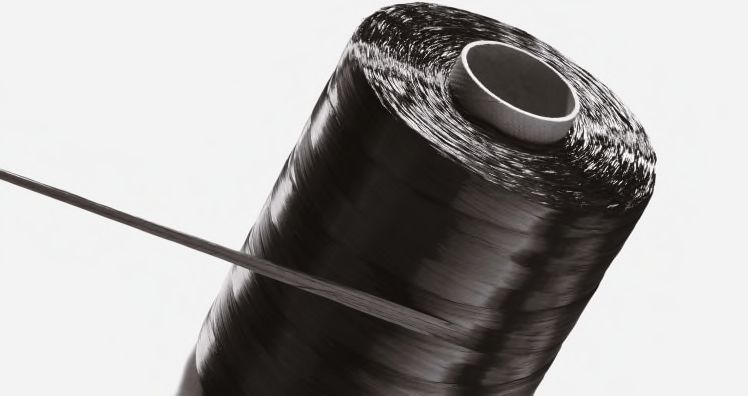
26BU Carbon Fibers (CF) – Undergoing a technical transformation
Sales (in mEUR) Key drivers
stable • New business unit head
341
304
• Management in subclusters
upstream (carbon fiber)
downstream (prepreg, fabrics)
• Carbon fiber plants at full capacity to satisfy BMW i3 and
2019 2020 2021e wind demand
• Improvement of fiber value chain
EBITDApre (in mEUR) Industrialization of Lavradio precursor
slight Increasing use of our own precursor to fully load our
increase carbon fiber capacities
41
• Prepare for expected end of contract of BMW i3
20
2019 2020 2021e
27BU Composite Solutions (CS) – Strong sales increase driven by
Automotive results into upside potentials
Sales (in mEUR) significant
Key drivers
increase
• New business unit head
91 89 • Turnaround expected in 2021
• High-end automotive business with high volumes
• Start of serial production of battery enclosures for eTruck
2019 2020 2021e Components from Ried/Ort, Austria
Assembly in Arkadelphia, USA
EBITDApre (in mEUR)
slightly
positive
-2 -5
2019 2020 2021e
28SGL Carbon – Focus on profitability rather than sales growth in 2021
Sales (in mEUR) Key drivers
• Restructuring project
1,087 Well on track
919 920 - 970
Pipeline filled with new ideas
• EBITDA 2021: One-offs from 2020 replaced by operative
improvements
2019 2020 2021e • Uncertainty on overall market environment due to
pandemic situation
EBITDApre (in mEUR)
118 100 - 120
93
2019 2020 2021e
29Preview Q1/2021 – Positively impacted by one-off effect in BU GS Early contract termination & compensation • Ongoing negotiations with customer to prematurely terminate contract for graphite tubes used in nuclear power plants • SGL Carbon is expecting a one-off payment of a low double- digit mEUR amount • Majority of the amount to enhance earnings in Q1/2021 • On a full year view, compensation of the one-off payment due to lower sales and earnings in the next quarters. • Overall, slightly positive P&L impact in FY2021 30
5 New Mid-Term Plan

31
SGL Carbon roadmap – Step-by-step approach to create value

     Profitability

                     • Considered, once performance improved
                     • Larger organic investments (e.g. GAM)          3.               Accelerate
                     • Selective divestments/acquisitions

                                                                                   • Analysis of production sites
                                    2.                 Improve                     • Selective organic growth in profitable areas
                                                                                   • ESG commitment

                                                   • Cost reduction
       1.             Transform                    • Focus on profitability and cash

          2020             2021                 2022                  2023                2024                 2025

32
Focus on Profitability – Planning excluding larger investment projects
e.g. in GAM
Group Sales & EBITDA margin, 2018 - 2025
Covid-19 CAGR ~6%
~1,200-1,300**
1,048 1,087
919 920-970
Group sales
in mEUR
Act 2018 Act 2019 Act 2020 Guidance 2021 Target 2025
EBITDApre-margin 12.1% 10.9% 10.1%* 15-18%
11-12%
in % of sales
* Excluding one-off effects, i.e. land sale; ** excluding any large future projects
33Financial mid-term targets resulting from bottom-up planning
Financial targets in new mid-term plan Details
• Targeted leverage ratio expected to be reached in next two
y figures
ROCE* and ratios ≥10%
years
Leverage ratio** ≤ 2.5 • Sales growth assumption
based on customer analysis in terms of profitability
Sales growth CAGR*** Single-digit excluding any major growth project
• Net result expected to become positive from 2022 onwards
Consolidated net result (cont. operations) Positive
Free cash flow Positive
EBITDApre-margin on sales ≥ 15%
* Based on EBIT before non-recurring items; ** net financial debt to EBITDA before non-recurring items; *** based on the period 2021-2025
346 Summary 35
SGL Carbon‘s transformation right on track – key takeaways
1. Corona year 2020 impacted by restructuring, impairment, acquisition of 49% BMW stake in JV
2. EBITDA & cash 2020 improved by one-offs – recovery of underlying business expected 2021
3. Transformation project on track – more than 100 mEUR recurring savings confirmed2021
4. EU IPCEI grant of 42.9 mEUR received for development of graphite material for EV batteries
5. Solid liquidity
36Q&A © Copyright SGL Carbon SE ® Registered trademarks of SGL Carbon SE
Financial calendar and IR contact details
Financial calendar Contact
May 12, 2021 Investor Relations
Report on the first quarter 2021 SGL Carbon SE
Conference call for analysts and investors Söhnleinstrasse 8
May 21, 2021 65201 Wiesbaden/Germany
Annual General Meeting Phone: +49 611 6029-103
Fax: +49 611 6029-101
August 12, 2021
E-mail:
Report on the first half of 2021
Conference call for analysts and investors Investor-Relations@sglcarbon.com
November 11, 2021
Report on the first nine months 2021 www.sglcarbon.com
Conference call for analysts and investors
387 Backup 39
New BU structure – strong positioning and promising drivers

     Graphite Solutions (GS)                      Process Technology (PT)                          Carbon Fibers (CF)        Composite Solutions (CS)

•    Isostatic and extruded graphite          •   Graphite heat exchangers,                 •   Textiles and precursor   •       Composites parts
     & machined parts                             service and parts
                                                                                            •   Carbon fibers            •       Wet friction applications
•    Gas diffusion layer (fuel cell)          •   Synthesis systems
                                                                                            •   Prepregs                 •       Thermal insulation
•    Graphite anode material (LiB)            •   PTFE products

     ~500 mEUR sales                              ~100 mEUR sales                               ~300 mEUR sales                  ~100 mEUR sales

Main growth drivers
•    Fuel cell and Li-ion batteries           •    Chemical and petrochemical               •   Wind energy                  •   Automotive (lightweight and
                                                   industry                                                                      electro mobility)
•    Semiconductors and LED                                                                 •   Automotive
                                                                                                                             •   Commercial Aerospace
•    Automotive industry
New BU structure implemented on Jan 1st, 2021; Financial reporting in the new structure from Q1/2021 onwards
40
Business units impacted by Covid-19
FY2020 vs FY2019
Sales (in mEUR) EBITDApre* (in mEUR) Sales
• PT, GS strongly impacted due to
-15% -21% pandemic economic slow down
PT 106.6
-17% • CF: strong wind business could
88.2 compensate partly for slow-down
in other business
GS 516.0 PT 9.1 -63%
3.4 • CS: new projects able to nearly
-21% 407.5 compensate for shut-downs in
Q2
GS 101.0 -38% 63.1
EBITDA
CF 341.0
-11% 303.9 • PT and GS decline, due to lower
sales
41.4
CF +111% • CF improvement due to efficiency
CS 91.1 -3% 88.6 19.6
CS measures initiated in 2019
1 2 -1.9 -4.7
FY2019 FY2020 FY2019 FY2020 • CS decline due to automotive
shut-down in Q2
*before non-recurring and one-offs items; BU Corporate not shown
41FY2020 KPI’s for modelling purposes in the new structure
Retrospective adjustment to new BU structure
2020 2020
Sales Q1 Q2 Q3 Q4 FY EBITDA pre-exeptionals Q1 Q2 Q3 Q4 FY
Graphite Solutions 111.7 101.5 94.8 99.5 407.5 Graphite Solutions 20.8 15.4 13.3 13.6 63.1
Process Technology 23.0 21.9 20.4 22.9 88.2 Process Technology 0.7 0.4 0.7 1.6 3.4
Carbon Fibers 81.7 64.9 76.8 80.5 303.9 Carbon Fibers 10.3 5.2 12.9 13.0 41.4
Composites Solutions 23.0 16.5 21.2 27.9 88.6 Composites Solutions -0.8 -4.7 0.5 0.3 -4.7
Corporate 7.4 4.9 13.8 5.1 31.2 Corporate -2.0 -3.3 -1.2 -3.9 -10.4
SGL Carbon 246.8 209.7 227.0 235.9 919.4 SGL Carbon 29.0 13.0 26.2 24.6 92.8
2020
Operating EBIT before non- Q1 Q2 Q3 Q4 FY
recurring items
Graphite Solutions 14.3 8.8 4.4 3.1 30.6
Process Technology 0.2 -0.3 0.2 1.1 1.2
Carbon Fibers 4.6 -0.8 7.0 6.8 17.6
Composites Solutions -1.9 -6.1 -0.9 -2.0 -10.9
Corporate -3.8 -6.3 -3.3 -5.6 -19.0
SGL Carbon 13.4 -4.7 7.4 3.4 19.5
All figures in mEUR
42Important Note This presentation contains statements relating to certain projections and business trends that are forward-looking, including statements with respect to SGL Group’s outlook and business development, including developments in SGL Group’s Composites - Fibers & Materials and Graphite Materials & Systems businesses, expected customer demand, expected industry trends and expected trends in the business environment, statements related to SGL Group’s cost savings programs. You can generally identify these statements by the use of words like "may", "will", "could", "should", "project", "believe", "anticipate", "expect", "plan", "estimate", "forecast", "potential", "intend", "continue" and variations of these words or comparable words. These statements are not historical facts, but rather are based on current expectations, estimates, assumptions and projections about SGL Group’s businesses and future financial results, and readers should not place undue reliance on them. Forward-looking statements do not guarantee future performance and involve risks and uncertainties. These risks and uncertainties include, without limitation, changes in political, economic, legal and business conditions, particularly relating to SGL Group’s main customer industries, competitive products and pricing, the ability to achieve sustained growth and profitability in SGL Group’s Composites - Fibers & Materials and Graphite Materials & Systems businesses, the impact of any manufacturing efficiencies and capacity constraints, widespread adoption of carbon fiber products and components in key end-markets of the SGL Group, including the automotive and aviation industries, the inability to execute additional cost savings or restructuring measures, availability of raw materials and critical manufacturing equipment, trade environment, changes in interest rates, exchange rates, tax rates, and regulation, available cash and liquidity, SGL Group’s ability to refinance its indebtedness, development of the SGL Group’s pension obligations, share price fluctuation may have on SGL Group’s financial condition and results of operations and other risks identified in SGL Group’s financial reports. These forward-looking statements are made only as of the date of this document. SGL Group does not undertake to update or revise the forward-looking statements, whether as a result of new information, future events or otherwise. © Copyright SGL Carbon SE ® Registered trademarks of SGL Carbon SE
You can also read