FY Ending March 2020 3Q Results Presentation
←
→
Page content transcription
If your browser does not render page correctly, please read the page content below
FY Ending March 2020
                                                                                              3Q Results Presentation
                                                                                                                         February 5, 2020

[Disclaimer]
The contents of this material and comments made during the questions and answers etc. of this
briefing session are the judgements and projections of the Company’s managements based on
currently available information.
These contents involve the risk and uncertainty and the actual results may differ materially from them.
                                                                                                          © SEGA SAMMY HOLDINGS INC. All Rights Reserved.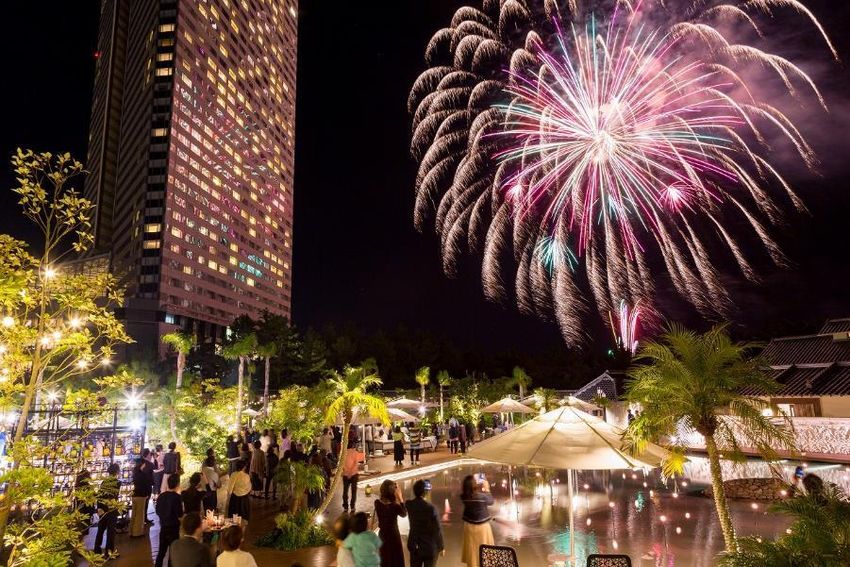
1. With regard to revision to the full-year operating results
   forecast announced on February 5

                                                                -2-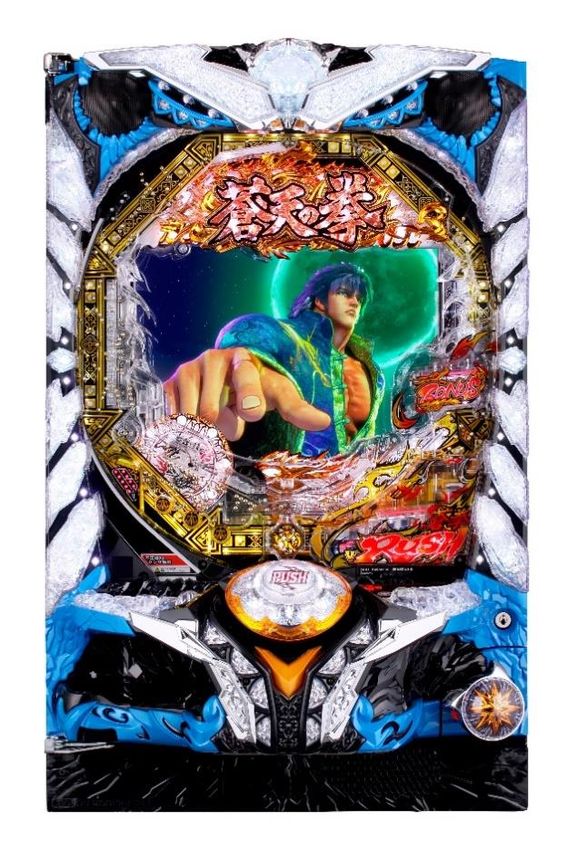
Revisions to full-year operating results forecast announced on Feb 5 (1)
Overall
FY ending March 2020 Full-Year Forecast:
(Unit: billion yen)
Breakdown per Segments
2019/3 2020/3
Revised
Full Year
Full Year
Increase /
Full Year
Results
Forecast
(announced
Forecasts
Decrease
While Pachislot and Pachinko Machines
(announced
on Apr 26)
on Feb 5)
Business fell short of initial forecast due to a
Sales 331.6 390.0 367.0 -23.0 decline in sales units, Digital Games area in
Pachislot and Pachinko Machines 101.4 120.0 110.0 -10.0
Entertainment Contents 219.6 259.0 246.0 -13.0
Entertainment Contents Business improved.
Resort 10.5 11.0 11.0 -
Operating Income 13.0 27.0 27.0 -
Pachislot and Pachinko Machines 13.4 29.0 25.5 -3.5 Net income increased due to the recognition of
Entertainment Contents 9.8 11.0 14.0 +3.0
extraordinary income associated with the
Resort -2.4 -4.0 -3.5 +0.5
Other / Elimination -7.8 -9.0 -9.0 - transfer of non-current assets and the decrease
Operating Income Margin 3.9% 6.9% 7.4% +0.5pt of tax expenses.
Non-operating income 2.1 1.5 2.2 +0.7
Non-operating expenses 7.7 5.5 5.0 -0.5
Ordinary Income 7.4 23.0 24.0 +1.0
Extraordinary income 8.2 - 3.0 +3.0
Extraordinary losses 8.7 - 0.5 +0.5
Income before income taxes 6.9 23.0 26.5 +3.5
Profit attributable to owners of parent 2.6 15.0 21.0 +6.0
-3-
Revisions to full-year operating results forecast announced on Feb 5 (2)
Pachislot and Pachinko Machines Business
(JPY Billion) 2019/3 2020/3
Revised
Full Year
Full Year Main reason for the revision
Full Year Forecast Increase /
Forecasts
Results (announced Decrease
on Apr 26)
(announced Launch of several titles will be delayed until the next
on Feb 5)
fiscal year.
Sales 101.4 120.0 110.0 -10.0
Pachislot 24.7 48.8 58.0 +9.2 Unit sales of Pachinko machines went below initial
Pachinko 59.9 59.0 38.0 -21.0 forecast.
Other / Elimination 16.8 12.2 14.0 +1.8
Operating Income 13.4 29.0 25.5 -3.5
Operating Income Margin 13.2% 24.2% 23.2% -1.0pt
Pachislot
Number of Titles 6 titles 10 titles 6 titles -4 titles
Unit Sales (units) 67,140 120,000 133,000 +13,000
Pachinko
Number of Titles 7 titles 9 titles 7 titles -2 titles
Unit Sales (units) 159,848 164,000 109,000 -55,000
Board + Frame 91,858 78,600 38,000 -40,600
Board 67,990 85,400 71,000 -14,400
-4-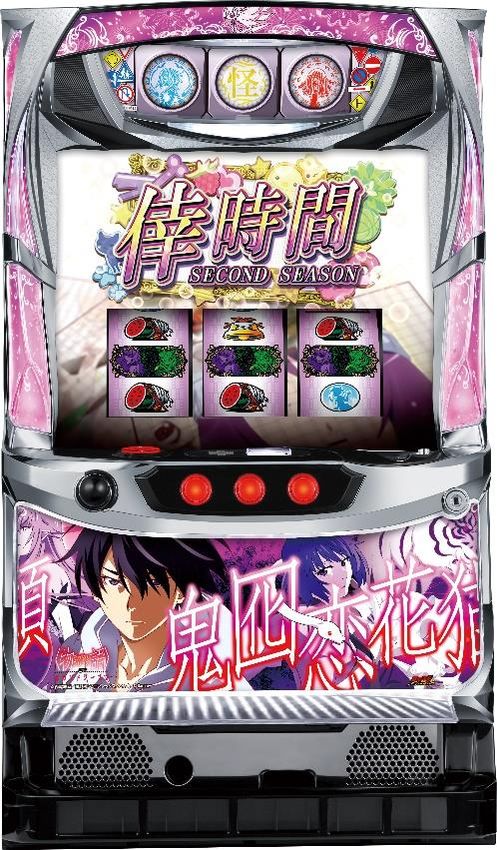
Revisions to full-year operating results forecast announced on Feb 5 (3)
Entertainment Contents Business
(JPY Billion) 2019/3 2020/3
Revised
Full Year
Full Year
Full Year Forecast Increase /
Results (announced
Forecasts
Decrease
Main reason for the revision
(announced
on Apr 26)
on Feb 5) Unit sales of Packaged Games went below expectation
Sales 219.6 259.0 246.0 -13.0
Digital Games 40.8 43.0 46.5 +3.5
and sales fall short of initial forecast.
Packaged Games 54.6 84.0 74.5 -9.5
Amusement Machine Sales 54.7 55.0 52.0 -3.0
40.9 44.0 43.0 -1.0
Amusement Center Operations
Animation / Toy 24.5 30.0 27.0 -3.0
Operating income exceeded initial forecast due to the
Other / Elimination 4.1 3.0 3.0 - improvement of Digital Games although Packaged
Operating Income 9.8 11.0 14.0 +3.0
Digital Games -1.9 2.0 9.2 +7.2 Games and Amusement Machine Sales struggling.
Packaged Games 8.2 6.0 4.1 -1.9
Amusement Machine Sales 1.5 0.5 -2.2 -2.7
Amusement Center Operations 2.6 2.5 2.0 -0.5
Animation / Toy 2.5 2.5 2.9 +0.4
Other / Elimination -3.1 -2.5 -2.0 +0.5
Operating Income Margin 4.5% 4.2% 5.7% +1.5pt
-5-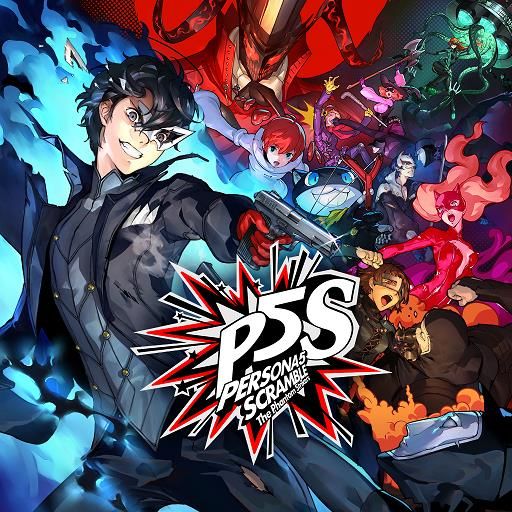
Organizational restructuring announced on Dec 24
                                           Entertainment Contents Business
Merges SEGA Games Co., Ltd. and SEGA Interactive Co., Ltd. with the aim to enhance the development
capabilities through utilization of resources.
                         (Current status)                                                (Scheduled for April 1, 2020)

                 SEGA SAMMY HOLDINGS INC.                                                SEGA SAMMY HOLDINGS INC.

                                                                      Trade name
                                                                        change
                    SEGA Holdings Co., Ltd.                                              SEGA GROUP CORPORATION

                                      SEGA Games Co., Ltd.
 SEGA Interactive Co., Ltd.                                                                   SEGA CORPORATION
                                       (Surviving Company)            Trade name
 (Extinguished Companies)                                               change            Planning, development and sales of
                                   Planning, development, and sales                    game-related contents for mobile phones,
   Development and sales of           of game-related contents for                     PCs, smart devices and home video game
 amusement machines and others        mobile phones, PCs, smart                         consoles, and development and sales of
                                    devices, and home video game                           Amusement Machines and others
                                               consoles

                        Absorption merger
                                                                       ⇒For more details, please see News Release announced on Dec 24, 2019
                                                                                                                                              -6-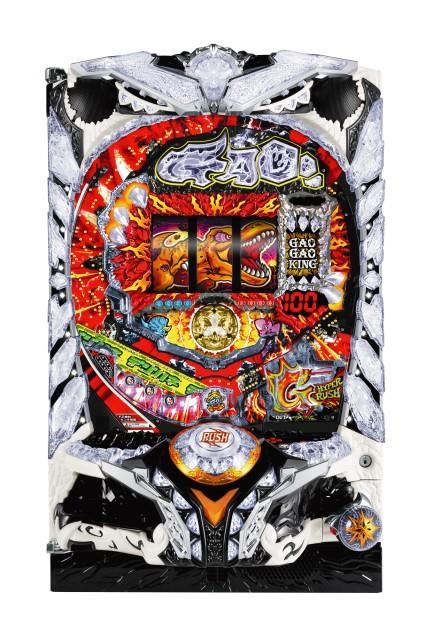
2. FY Ending March 2020 3Q Results / Full-Year Forecast

                                                          -7-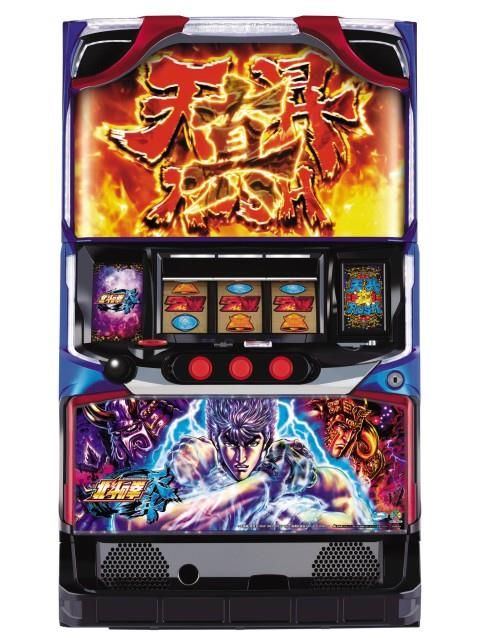
Results Highlights
(Unit: billion yen)
2019/3 2020/3
Revised
Full Year
Results Full Year Results Forecast
Full Year
Forecasts
2020/3 3Q Results
Through 3Q Results Through 3Q (announced
(announced
on Apr 26)
on Feb 5) Both sales and profit increased YoY.
Sales 250.3 331.6 280.8 390.0 367.0
Unit sales increased in Pachislot and
Operating Income 11.9 13.0 28.0 27.0 27.0
Pachinko machines business
Operating Income Margin 4.8% 3.9% 10.0% 6.9% 7.4%
Digital Games area in Entertainment
Non-operating income 1.5 2.1 1.8 1.5 2.2
Contents Business performed solidly.
Non-operating expenses 4.4 7.7 4.0 5.5 5.0
Recorded extraordinary income associated with
Ordinary Income 9.0 7.4 25.8 23.0 24.0
transfer of non-current assets.
Extraordinary income 1.7 8.2 3.0 - 3.0
Extraordinary losses 6.7 8.7 0.5 - 0.5
Income before income taxes 4.0 6.9 28.3 23.0 26.5
Forecast
Profit (loss) attributable to
owners of parent
0.6 2.6 22.9 15.0 21.0 Expect the incurrence of expenses with
ROA※ - 0.6% - - -
verification of asset value of inventories,
incentives and others at the end of the fiscal
year in Entertainment Contents business.
※ ROA(%)= profit attributable to owners of parent/total assets
⇒For more details, please see "FY Ending March 2020 3Q Result / Appendix"
-8-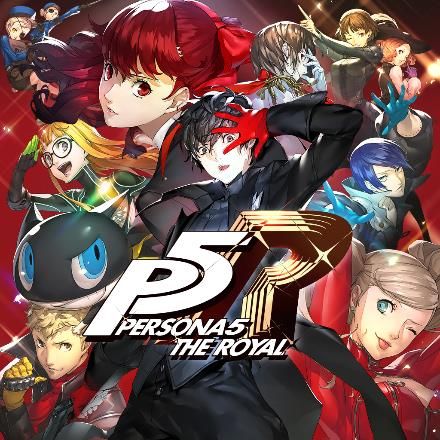
Breakdown of Income (2020/3 3Q results)
(Unit: billion yen)
Breakdown of non-operating income / losses
(Unit: billion yen)
Non-operating income 1.8
Interest income 0.1
Dividends income 0.3
Gain on investments in partnership 0.4
Non-operating expenses 4.0
Foreign exchange losses 0.3
Equity in losses of affiliates 1.8
Extraordinary income 3.0
Gain on sale of non-current assets 2.9
Operating profit of PARADISE SEGASAMMY
became profitable from Jan to Sep, 2019
-9-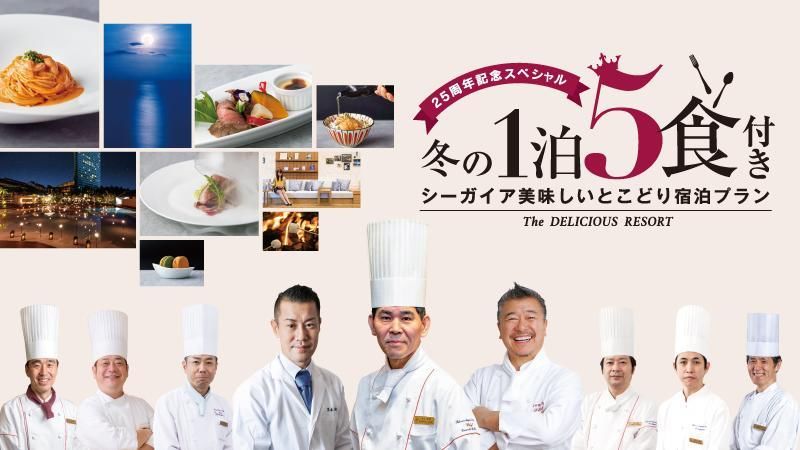
Consolidated Costs and Expenses
                                                                         (Unit: billion yen)
                             2019/3                          2020/3
                                                                           Revised
                                                             Full Year
                                                                           Full Year
                       Results    Full Year     Results      Forecast
                                                                          Forecasts
                     Through 3Q    Results    Through 3Q   (announced
                                                                         (announced
                                                            on Apr 26)                         2020/3 3Q results / Main Factors
                                                                          on Feb 5)

R&D Expense /                                                                                  Increased with launch of new titles in
Content Production         48.3        66.6         56.4         72.5                75.7      Packaged Games
Expense

                                                                                               Decrease in association with
Cap-ex                     24.3        34.4         16.1         24.8                22.6      completion of relocation of
                                                                                               headquarter

Depreciation               10.8        14.5         10.9         13.6                13.8      -

Advertising                12.2        16.0         12.9         21.0                18.2      -

                                                                                                                                        - 10 -
Consolidated Balance Sheet Summary
(Unit: billion yen)
As of end of As of end of
Change
March 2019 December 2019 Main change factors Changes
Total Current Assets 260.4 264.0 +3.6
Cash and Deposits 137.4 102.0 -35.4 Current Assets +3.6
Accounts Receivable 39.2 57.8 +18.6 While cash and deposits decreased due to
Securities 14.5 33.5 +19.0 acquisition of securities and repayment of
Total Noncurrent Assets 204.1 202.0 -2.1 interest-bearing debt, trade notes and
Total assets 464.6 466.0 +1.4 accounts receivable and inventory assets
Total Current Liabilities 87.5 84.1 -3.4 increased.
Corporate Bonds 12.5 10.0 -2.5
Total Noncurrent Liabilities 71.7 69.4 -2.3
Non-current assets -2.1
Corporate Bonds 10.0 10.0 - Decrease as investment securities
Total Liabilities 159.3 153.5 -5.8
decreased mainly due to market valuation,
although tangible fixed assets increased in
Total Net Assets 305.3 312.5 +7.2
Total Liabilities and association with changes in accounting
Net Assets
464.6 466.0 +1.4
policies at some overseas subsidiaries.
As of end of As of end of
Change
March 2019 December 2019 Liabilities -5.8
Cash and cash equivalents 148.0 129.6 -18.4
Despite issuance of corporate bonds,
Interest bearing debt 76.1 64.5 -11.6
decreased due to redemption of corporate
Net cash 71.8 65.1 -6.7
bonds and repayment of loans payable.
Equity Ratio 65.1% 66.5% +1.4pt
⇒For more details, please see "FY Ending March 2020 3Q Result / Appendix"
- 11 -3. 3Q results / Full-Year Forecast per Segments
- 12 -Pachislot and Pachinko
Sales
Operating income
(Unit: billion yen) Machines Business
Operating income margin
2020/3 3Q results
2019/3 2020/3 Profitability improved YoY due to increased pachislot unit sales.
Pachislot : "Pachislot Hokuto No Ken Tenshou"
"Pachislot Psalms of Planets Eureka Seven 3
HI-EVOLUTION ZERO"
Pachinko: “P GAOGAOKING 3”, “P The Seven deadly Sins Elizabeth ver.”
Forecast
Revised the number of titles and unit sales forecast.
Pachislot : "Pachislot PHANTASY STAR ONLINE 2"
"Pachislot 〈Monogatari〉 Series Secondseason"
Pachinko: "P SOUTEN-NO-KEN Souryu," "P BIG DREAM2 GEKISHIN," etc.
(Changes in unit sales)
2019/3 2019/3 2020/3 2020/3 2020/3
Through 3Q Full-year Through 3Q Revised forecast Initial forecast
Pachislot 31,534 units 67,140 units 105,860 units 133,000 units 120,000 units
Pachinko 136,670 units 159,848 units 75,094 units 109,000 units 164,000 units
Board 87,468 units 91,858 units 18,878 units 38,000 units 78,600 units
Frame 49,202 units 67,990 units 56,216 units 71,000 units 85,400 units
- 13 -Pachislot and Pachinko
Machines Business
Major titles in 3Q Major titles in and after 4Q
Pachislot Pachinko Pachislot Pachinko
"Pachislot Hokuto No Ken "Pachislot 〈Monogatari〉
"P GAOGAOKING 3" "P SOUTEN-NO-KEN Souryu"
Tenshou" Series Secondseason"
©Buronson & Tetsuo Hara/NSP 1983, ©Sammy ©Nisioisin/ Kodansha, Aniplex Inc., SHAFT INC. ©Tetsuo Hara & Buronson/NSP 2001,Approved No.YSM-130
©NSP 2007 Approved No.YAF-420 ©Sammy ©Sammy
©Sammy
- 14 -Transition of revision of rules (February 2018) and Pachislot and Pachinko
easing of voluntary regulation, etc. Machines Business
Revision of rules
New Regulation Machine (1) New Regulation Machine (2)
(Regulation for 6.0 model machine) (Regulation for 6.1 model machine)
Pachislot
Gameplay in shorter time improved Mainly improved gameplay related to visual effects
• Changes in pay-out • Removal of upper limit of the no. of obtained
regulation • Addition of visual effects using the lever and buttons
medals per game • Addition of visual effects using mini-reel machine (video reel
• Revival of assist time machines machine)
• Gameplay of assist time improved
2018/2 2018/4 Review of voluntary regulation 2019/12 2021/2
Complete transition
to new regulation
2018/11 2019/5 2019/1 Changes in interpretation of regulation machines
New Regulation New Regulation New Regulation
Machine (1) Machine (2) Machine (3)
Pachinko
• Changes in pay-out Development of Gameplay Widens Primarily new gameplay added
regulation machines with high
• Introducing "Setting" jackpot continuous rate • Elimination of the lower limit • Ability to enter into time reduction (*1) after consumed the
to pachinko machines on the number of win balls predetermined number of games
• Elimination of the • Elimination of the lower limit • Elimination of 100 times upper limit of count in time reduction
65% upper limit in in game numbers can be • Enable to enter into time reduction with specific symbols
continuous rate of played at normal status • Can use count of limiters (*2) up to 2 types
probability change
*1: Time reduction = Function to play games efficiently without greatly reducing the number of balls.
*2: Limiter = one of the functions in probability change, refers to the function of the probability change ends
when the predetermined number of jackpots times consumed.
- 15 -Sales
Entertainment Contents Business
Operating income
(Unit: billion yen)
Operating income margin
2019/3 2020/3 2020/3 3Q results
Digital Games area performed solidly.
The expenses increased in Packaged Games area due to the launch
of new titles.
Forecast
Several new titles are planned to launch for each business area.
Expect the incurrence of expenses with verification of asset value
of inventories, incentives and others at the end of the fiscal year.
- 16 -Sales
Digital Games
Operating income
(Unit: billion yen)
Operating income margin
2019/3 2020/3 2020/3 3Q results
Significant profit growth YoY.
Steady performance of the titles in operation.
• “SEGA Pocket Club Manager”
• “Fist of the North Star LEGENDS ReVIVE”
Expenses decreased in the current fiscal year due to the impairment
loss recorded in the previous fiscal year.
Recorded revenue from transfer of titles (1Q) and offering of titles
(2Q).
Forecast
Strengthen operation of existing titles.
- 17 -Sales
Packaged Games
Operating income
(Unit: billion yen)
Operating income margin
2020/3 3Q results
2019/3 2020/3 Launched several new titles but sales went below expectation.
“PERSONA 5 ROYAL”
"Mario & Sonic at the Olympic Games Tokyo 2020™"
“New Sakura Wars”
Repeat sales of existing titles performed solidly exceeding forecast.
Operating income decreased YoY due to increased expenses associated
with the launch of new titles.
Forecast
Launches new titles and continues repeat sales of existing titles.
Expect the incurrence of R&D expenses from new title launches and other
expenses associated with verification of asset value of inventories and etc., at
the end of fiscal year.
Unit sales of Packaged Games (Units: 10,000 units)
2019/3 2019/3 2020/3 2020/3 2020/3
Through 3Q Full-year Through 3Q Revised forecast Initial forecast
New titles 342 409 694 984 1,069
Repeat 1,509 1,935 1,239 1,485 1,450
Total 1,851 2,344 1,933 2,469 2,519
- 18 -Packaged Games
Major 3Q Titles Major titles after 4Q
“PERSONA 5 ROYAL” “New Sakura Wars” “Ryu ga Gotoku 7"
©ATLUS ©SEGA All rights reserved. ©SEGA ©SEGA
"Mario & Sonic AT Tokyo 2020 Olympic™"
TM IOC/TOKYO2020/USOC 36USC220506.
© 2019 IOC. All Rights Reserved.
© NINTENDO. ©SEGA. “Football Manager 2020” “Persona 5 Scramble: The Phantom Strikers”
© Sports Interactive Limited 2019. ©ATLUS ©SEGA/ ©KOEI TECMO GAMES All rights reserved.
Published by SEGA Publishing Europe Limited.
- 19 -Sales
Amusement Machine Sales
Operating income
(Unit: billion yen)
Operating income margin
2019/3 2020/3 2020/3 3Q results
Launched “StarHorse4”
While prize category performed solidly, profit decreased YoY.
YoY decline due to negative repercussions of the sales of high-
margin CVT Kit in the previous fiscal year
Performance of video games performing were sluggish.
Common fixed expenses increases in association with relocation of
headquarter in the previous fiscal year
Launched gaming machines for casino in Nevada.
Forecast
Scheduled to launch new title.
“MARIO & SONIC AT THE OLYMPIC GAMES TOKYO 2020TM
ARCADE EDITION: To be launched in January 2020”
Expect the incurrence of expenses associated with verification of asset
value of inventories, and others at the end of fiscal year.
- 20 -Sales
Amusement Center Operations
Operating income
(Unit: billion yen)
Operating income margin
2019/3 2020/3 2020/3 3Q results
Prize remained solid, but profits declined YoY.
Common fixed expenses such as depreciation of machines
increased.
Impact of the consumption tax hike.
Sales of existing stores YoY: 100.7%
Store opening: 4, Store closing : 1
Forecast
Continue to strengthen facilities operations, centered on prize machines.
Domestic amusement centers: No. of stores / YoY sales ratio comparison
2019/3 2019/3 2020/3 2020/3 2020/3
3Q Results Results 3Q Results Revised forecast Initial forecast
Number of
Stores 191 190 195 193 195
Sales of existing
stores YoY (%) 104.2 104.0 100.7 100.0 104.4
- 21 -Sales
Animation / Toys
Operating income
(Unit: billion yen)
Operating income margin
2019/3 2020/3 2020/3 3Q results
Both sales and profits increased YoY.
Animation: Recorded revenue from video distribution, etc.
Toys: Sales of new products such as “Fun to change mouse
covers! Sumikkogurashi Personal Computer” and
regular products.
Forecast
Expecting revenue from video distribution, video production and other.
- 22 -Other Topics
Movie: “Sonic The Hedgehog”
Published nationwide on Feb. 14
Published in Japan on Mar. 27
Scheduled to be published in Europe,
South America, Asia, and other parts of
the world in stages (Feb-Mar)
©2019 PARAMOUNT PICTURES AND SEGA OF AMERICA, INC. ALL RIGHTS RESERVED.
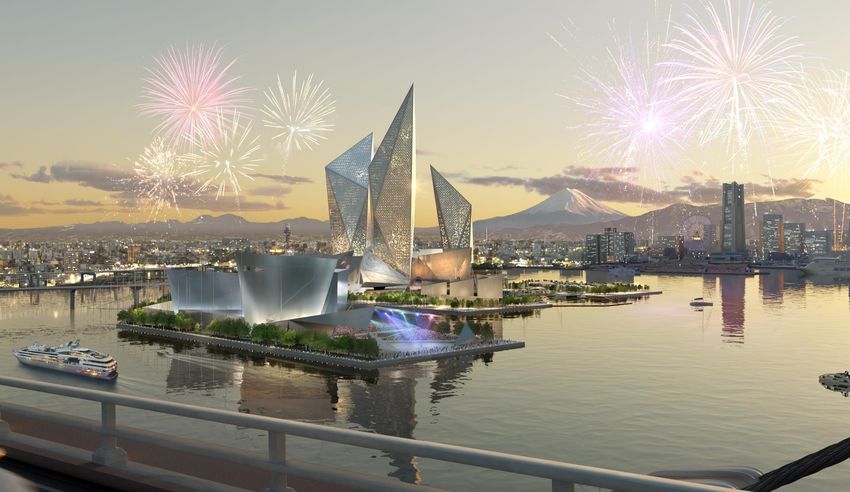
- 23 -Resort Business
Sales (Unit: billion yen)
Operating income
2019/3 2020/3 FY3/20 3Q results
Profit of PHOENIX RESORT improved but expenses for domestic
Integrated Resort (IR) increased, leading to wider losses.
Forecast
Continue to improve profitability at existing facilities.
Expenses increases with the activation of the measures towards
participating into domestic IR.
Exhibited the booth at “1st JAPAN IR EXPO in Yokohama”
(Jan 29-30, 2020)
Announced the partners (Jan 27, 2020)
- 24 -PHOENIX RESORT
Sales (Unit: billion yen)
Operating income
Operating income margin
2019/3 2020/3 FY3/20 3Q results
Increase in number of users due to the 25th anniversary commemorative
project and implementation of measures for the Kyushu area.
One-night event to commemorate the 25th anniversary
“The DELICIOUS FESTIVAL”
Plan for customers in the Kyushu are, which includes a “five-meal
for one night in winter” plan
Forecast
Continuously implement various sales measures and strengthen the
customer base to improve profitability.
Measures for Spring camps of various sports
A variety of plans to enjoy flowers and sweets
Encourage use of golf and MICE.
- 25 -PHOENIX RESORT
“The DELICIOUS FESTIVAL” 25th anniversary special plan,
“Five Meals for One Night in Winter”
- 26 -Resort Business
Initiatives to promote integrated resort (IR) business
Concludes Production Agreement with KYOTO KITCHO
- Developing plans for the authentic, luxury Japanese restaurant and inn at IR facilities –
Strategic business alliance with Katana Inc.
- Jointly working to design and formulate Japanese-style IR business plan for IR with Katana Inc., led by
Tsuyoshi Morioka, one of Japan’s top marketers-
Strategic business alliance with Foster+Partners
- Partnering to enter the IR business in Japan-
- 27 -Resort Business
Initiatives to promote integrated resort (IR) business
Concludes Production Agreement with KYOTO KITCHO (from 2018)
~ Developing plans for the authentic, luxury Japanese restaurant and inn at IR facilities
Design and produce restaurants and inns where people can enjoy classic Japanese cuisine in elegant
spaces that accentuate the four seasons as core facilities that promote attractiveness for tourism.
⇒For more details, please see News Release announced on Jan 27, 2020
- 28 -Resort Business
Initiatives to promote integrated resort (IR) business
Partners with Katana Inc., an Elite Marketing Company Led by
Tsuyoshi Morioka, One of Japan’s Top Marketers (from 2017)
SEGA SAMMY and Katana have been engaged as partners in the design and formulation of a Japanese-
style IR business plan aiming for increases business success rates. Katana will be fully integrated in all
aspects of the project, from the business planning stages to the actual marketing phase.
⇒For more details, please see News Release announced on Jan 27, 2020
- 29 -Resort Business
Initiatives to promote integrated resort (IR) business
Strategic Business Alliance with Foster+Partners (from 2017)
SEGA SAMMY with abundant Foster+Partners with extensive
knowledge and knowhow in the experience in having carried out
entertainment industry innovative feats in the
architectural world
To create new value in IR by sharing the strengths of SEGA SAMMY and Foster+Partners.
⇒For more details, please see News Release announced on Jan 27, 2020
- 30 -Resort Business
Initiatives to promote integrated resort (IR) business
Exhibited at 1st JAPAN IR EXPO in Yokohama (held on Jan 29 and 30, 2020)
"Sustainably Successful Integrated Resort" trying to realize in Yokohama,
picturing with Foster+Partners.
- 31 -PARADISE SEGASAMMY (Equity method affiliate)
Transition of Drop* amounts at Paradise City (KRW Billion)
(KRW million)
FY2019 3Q FY2020 3Q
Results Results
Sales 213.9 331.5
Casino 176.8 268.7
Hotel 36.8 49.6
Other 0.4 13.2
Cost of sales 188.2 279.5
Casino 113.5 145.5
Hotel 69.6 87.3
Other 5.1 46.6
Gross profit 25.8 52.0
SG&A 24.2 39.9
Operating profit 1.6 12.1
EBITDA 28.2 59.7
Net profit -10.6 -11.6
Source: Paradise IR
SEGASAMMY
Equity method acquisition -1.0 -0.9
amount (Billion yen)
* PARADISE SEGASAMMY Co., Ltd. is an equity method affiliate of SEGA SAMMY HOLDINGS INC.
* Figures for PARADISE SEGASAMMY Co., Ltd. are recorded with three months delay
- 32 -https://www.segasammy.co.jp/english/
Cautionary Statement for Investors and Shareholders with Respect to Nevada Gaming Statutes and Please visit below websites for products and service information.
Regulations https://www.segasammy.co.jp/english/pr/corp/group/list.html
SEGA SAMMY HOLDINGS INC. (“the Company”) is registered with the Nevada Commission as a publicly
(SegaSammy Group Website list)
traded corporation and has been found suitable to directly or indirectly own the stock of SEGA SAMMY
CREATION INC., and Sega Sammy Creation USA, Inc., both of which are subsidiaries that have been
licensed as manufacturers and distributors of gaming devices in Nevada. Pursuant to Nevada law, the * Company / product names in this document are trademarks or
Company’s shareholders are subject to the rules and regulations of the Nevada Gaming Authorities. A registered trademarks of the respective companies.
detailed explanation of Nevada gaming statutes and regulations can be found on the Company’s corporate
website:
https://www.segasammy.co.jp/english/ir/stock/regulation/You can also read