ECONOMY AND ENVIRONMENT, 2019 SUMMARY AND RECOMMENDATIONS
←
→
Page content transcription
If your browser does not render page correctly, please read the page content below
ECONOMY AND
ENVIRONMENT, 2019
SUMMARY AND
RECOMMENDATIONS

            Economy and Environment, 2019
SUMMARY AND RECOMMENDATIONS
This report from the Chairmen of the Danish Economic
Council of Environmental Economics contains two chap-
ters focusing on the distribution of environmental impacts
and leakage due to Danish climate policies. There are two
main conclusions:
In Denmark, there is relation between high environmental
exposure and individuals with low income. However, the
relation found in the Danish data is very weak. On the oth-
er hand, large differences in environmental exposure are
found between individuals within the same income groups,
indicating that income does not contribute significantly to
the explanation of differences in environmental exposure
between individuals.
Denmark’s overall leakage rate is 45-53 per cent. The
leakage rate is particularly high for the Danish quota sec-
tors and for agriculture. Agriculture should, however, still
contribute significantly to the overall reductions of green-
house gas emissions in the non-quota sector because of
socio-economic benefits related to better aquatic environ-
ment and less air pollution.
Economy and Environment, 2019English Summary
ENGLISH SUMMARY
This report from the Chairmen of the Danish Economic
Council of Environmental Economics consists of two chapters:
Environmental exposure and distribution
Leakage due to Danish climate policies
The first chapter contains various analyses of environmental expo-
sure and distribution in Denmark. The distribution of environmental
exposures is analysed using Lorenz curves and the Theil index fol-
lowed by statistic descriptions and regression analysis.
The second chapter presents calculations of the overall leakage rate
for Denmark as well as leakage rates for different sectors in the Dan-
ish economy. The chapter discusses the consequences for Danish
climate policy of adjusting for leakage.
CHAPTER I: ENVIRONMENTAL EXPOSURE AND
DISTRIBUTION
The focus in the public debate on distributional issues of the envi-
ronment in Denmark is often related to the distributional effects of
green taxes. However, there has not been a similar focus on the
distributional aspects of environmental exposure. The relation be-
tween income and environmental exposure has been examined in the
international literature, with findings indicating that individuals with
low income to a higher extent are prone to environmental exposures.
Similar studies have not been conducted on a national level for Den-
mark.
Chapter I shed light on different aspects of environmental exposure
and distribution in Denmark. Firstly, the distribution of different envi-
ronmental exposures among the Danish population is analysed. Sec-
ondly, it is examined whether there is a link between the degree of
environmental exposure and income. Finally the chapter examines
what characterises highly exposed houses and apartments.
More specifically, the analyses focus on the environmental exposures
from traffic noise and air pollution due to particulate matter (PM2,5)
and nitrogen dioxide (NO2). Furthermore, analyses are conducted on
the distribution of proximity to nature (forest, lakes and coast). Na-
tionwide, register data on the environmental exposures, which can be
linked to all homes in Denmark, is enriched with individual data on
Economy and Environment, 2019 3English Summary
income and other socioeconomic characteristics, of the individuals
living in the respective homes.
The results obtained in chapter I cannot be generalized to encom-
pass environmental exposures not included in the analysis. The
availability of geographically detailed nationwide data, which can be
linked to the individuals, has been the main cause for the choice of
environmental exposures included in the analyses. A range of similar
international studies only focuses on one environmental exposure,
which makes the current study more comprehensive than many earli-
er studies.
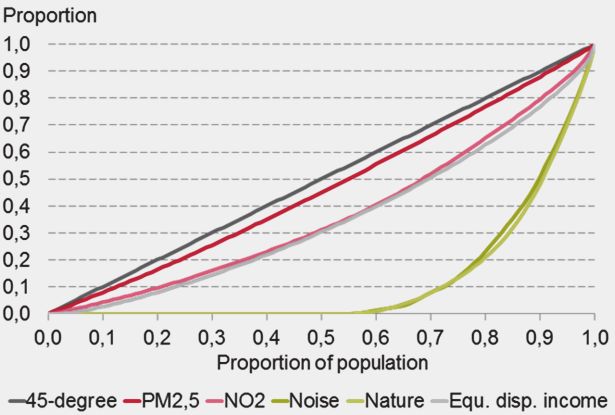
THE DISTRIBUTION OF ENVIRONMENTAL EXPOSURES
When analysing the distributional issues, the Lorenz curve is often
used to illustrate the degree of inequality in the distribution of income.
However, the Lorenz curve can also be used to illustrate the distribu-
tion of environmental exposure among individuals. Figure A shows
the Lorenz curves for air pollution (PM2,5 and NO2), noise and proxim-
ity to nature. For comparison, the Lorenz curve for the distribution of
income is also shown. If the Lorenz curve is close to the 45-degree
line, the distribution of income or environmental exposures can be
considered equal.
The results show large differences in distributional inequality across
the different environmental exposures and proximity to nature. Rela-
tively small differences are seen in the distribution of PM2,5 and NO2
between individuals. Compared to the distribution of income, PM2,5 is
more equally distributed, while NO2 has more or less the same distri-
bution as income. A larger inequality for NO2 compared to PM2,5
reflects that the concentration of NO2 to a larger extent originates
from local sources, e.g. power stations, traffic and shipping, while
PM2,5 is based on more regional sources mostly originating from non-
domestic pollution.
For both noise and proximity to nature, the distributional inequality
between individuals is larger than for the two types of air pollution.
This reflects that noise and proximity to nature are of a very local
character.
There is a risk of overestimating the inequality of proximity to nature
because only housing within certain distances from nature (0.6 to 1
km dependent on the type of nature) are included in the analyses. If
individuals experience a value from proximity to nature further away
4 Economy and Environment, 2019English Summary
than the defined distances, the inequality shown in the Lorenz curve
might be overestimated. Similarly, smaller nature areas are not in-
cluded in the analyses which as well can give rise to an overestimat-
ed inequality of proximity to nature between individuals.
FIGURE A INEQUALITY IN ENVIRONMENTAL EXPO-
SURES
The inequality is illustrated using Lorenz curves for air pollution
(PM2,5, NO2), noise, proximity to nature and income, respectively.
Note: Lorenz curves are based on concentrations of air pollution, noise
above 50 dB and proximity to nature within 0.6 to 1 km from na-
ture (dependent on the type of nature), respectively. The Lorenz
curve for income is calculated from the equivalent disposable in-
come in 2016.
Source: Own calculations.
ENVIRONMENTAL EXPOSURES AND INCOME
A range of international studies investigate the relation between envi-
ronmental exposure and income. These analyses often show that
individuals with low income are more prone to environmental expo-
sures than individuals with high income.
The analyses based on the Danish data reveals only a weak relation
between environmental exposure and income. Moreover, the anal-
Economy and Environment, 2019 5English Summary
yses show large differences in the distribution of environmental expo-
sure between individuals within the same income group. As Figure A
and Figure B, in box A, illustrate, the difference of environmental
exposure between individuals within the same income group is much
larger than the difference of environmental exposures between indi-
viduals in the lowest and highest income group. This indicates that
differences in income between individuals only explain a small part of
the variation in environmental exposures.
Even though the relation between environmental exposures and
income is weak in Denmark, there is a tendency towards individuals
with low income being more prone to environmental exposures than
individuals with high income, cf. box A. Calculations in the current
chapter show that individuals with an equivalent disposable income,
DKK 100,000 higher than the average, are less prone to the environ-
mental exposures corresponding to values of DKK 30 for PM2,5, DKK
30 for NO2 and DKK 5 for noise, respectively.
INDIVIDUALS WITH HIGHEST ENVIRONMENTAL EXPOSURE
In chapter I housing, which are most prone to environmental expo-
sures, are characterized in terms of type of housing and residential
characteristics. Housing most prone to environmental exposures is
defined as the houses and apartments where the 10 percent of the
population exposed to most air pollution and noise lives. Proximity to
nature is not a part of the selection of housing most prone to envi-
ronmental exposures.
A majority of the housing with most environmental exposure are lo-
cated within or nearby the capital of Denmark, Copenhagen, or other
larger cities. In contrast, most of the housing least prone to environ-
mental exposures are located in rural areas.
By using unit values, environmental exposure per house in Denmark
can be converted to costs in Danish Kroner (DKK) per year. Unit
values reflect inconvenience costs related to e.g. noise and costs of
serious health effects including premature death. The estimated year-
ly cost from air pollution and noise is about DKK 4,100 higher for
individuals living in housing most prone to environmental exposures
compared to individuals living in an average polluted residence. This
corresponds to 1.5 percentage of the average equivalent disposable
income for an individual in Denmark. A large share of the costs is
attributable to an increased risk of premature death. The increased
6 Economy and Environment, 2019English Summary
health risk corresponds to an expected risk of losing 40 hours of
expected life per year when living in a residence mostly prone to
environmental exposures compared to an individual living in an aver-
age polluted residence.
Economy and Environment, 2019 7English Summary
BOX A RELATION BETWEEN INCOME AND ENVIRONMENTAL EXPOSURE
The two figures illustrate the relation between income and the concentrations of NO2 and noise,
respectively.
The X-axis shows the equivalent disposable income divided into percentiles. The first point on the
X-axis represents the one percentile of the population with the lowest income, while the point most
to the right represents the one percentile of the population with the highest income. The green
curves illustrate the average level of NO2 and noise for all individuals within each of the 100 in-
come groups.a) The figures show that there is a tendency towards lower income groups having
higher levels of NO2 and noise.
FIGURE A NO2 AND INCOME FIGURE B NOISE AND INCOME
Note: Income percentiles are calculated based on the equivalent disposable income in 2016.
Source: Own calculations based on registry data and data for air pollution and noise from Aarhus University
and MOE|Tetraplan respectively.
The dotted lines in the figures illustrate the variation in NO2 and noise within each income group.
The dotted lines show the 5 and 95 percentage fraction for NO2 and noise, which means that 90
percentage of the individuals in each of the income groups are exposed to a level of NO2 or noise
within the two dotted lines. It appears that the differences in environmental exposure between in-
dividuals within the same income group are much larger than the differences between individuals
in the lowest and highest income group.
Figures describing the relation between income and concentrations of PM2,5 and between income
and proximity to nature, shows the same tendency, cf. section I.4 in chapter 1.
a) The curves show the relation between income and NO2 and noise, respectively corrected for
differences in level in income, NO2 and noise in different parts of Denmark (calculated based
on commuting areas).
8 Economy and Environment, 2019English Summary
Apartments, co-housing flats and private rental flats are to a higher
extent represented among housing most prone to environmental
exposures compared to the general distribution of housing in Den-
mark. In contrast, non-profit public housing is less often among hous-
ing most prone to environmental exposures compared to the general
distribution of housing.
The analyses in the current chapter show small differences in socio-
economic characteristics among residents in housing most prone to
environmental exposures compared to residents in housing with
average level of environmental exposure, corrected for geographical
differences. More specifically, the results show that individuals living
alone, families without children and ethnic minorities more often live
in housing with more environmental exposure. In contrast, fewer
senior citizens are living in housing, which are more prone to envi-
ronmental exposures compared to the general distribution. The inter-
national literature primarily shows that individuals with lower educa-
tion more often lives in housing prone to negative environmental
exposures. In contrast, the current analysis shows that this is not the
case in Denmark. The analysis shows a tendency towards higher
educated individuals more often living in housing, which are more
prone to environmental exposures compared to the general distribu-
tion of population in Denmark.
Children are considered a vulnerable group in terms of being prone to
environmental exposures. In the current chapter it is analysed wheth-
er children who have grown up in the most environmentally-
compromised homes have parents with other socioeconomic charac-
teristics than other children. Only small differences are found be-
tween the two groups of children. However, children with higher edu-
cated parents are slightly overrepresented among children living in
housing with more prone to environmental exposures compared to
other children.
CHAPTER II: LEAKAGE OF GREENHOUSE GAS EMISSIONS
AND DANISH CLIMATE POLICY
Danish climate policy reduces CO2e-emissions in Denmark but may
at the same time increase CO2e-emissions abroad.1 This phenome-
non is known as CO2e-leakage. CO2e-leakage implies that Danish
1) CO2e is used to denote the emission of all greenhouse gases (including agricultural
emissions of methane and nitrous oxide), converted to CO2-equivalents.
Economy and Environment, 2019 9English Summary
climate policy has a smaller impact on global reductions than on
domestic reductions in greenhouse gas emissions.
According to Denmark’s obligations with the EU, Denmark must re-
duce emissions of greenhouse gasses in the non-quota sector by 39
per cent towards 2030 compared to the emissions in 2005. In addi-
tion, the Danish government has committed to a strategy of climate
neutrality by 2050. The obligation for the non-quota sector and the
target of climate neutrality are specifically related to emissions from
Danish territory. It has been argued that Danish climate policy should
focus on global emissions of greenhouse gasses in addition to the
focus on emissions from Danish territory.
Chapter II presents calculations of leakage rates in Denmark and
discusses the consequences for Danish climate policy of adjusting for
leakage.
LEAKAGE RATES FOR DENMARK
The so-called leakage rate expresses the share of the domestic re-
ductions in emissions that is replaced by increased foreign emissions.
The analyses in chapter II indicate that Denmark’s overall leakage
rate is between 45 and 53 per cent. This implies that a national CO2e
reduction of 1 million tonnes results in a global CO2e reduction of
about 0.5 million tonnes.
The leakage rate for Denmark is calculated by imposing a tariff of
DKK 100 per tonne CO2e on all emissions in Denmark in the so-
called GTAP-E model. GTAP-E includes a description of global trade
flows, energy consumption and corresponding greenhouse gas emis-
sions, which makes the model suitable for assessing the impact of
such a tariff on emissions in Denmark as well as abroad.
The calculations encompass a number of mechanisms behind CO2e
leakage. The default GTAP-E model includes mechanisms via foreign
trade and via the price of fossil fuels: As the CO2e tariff in Denmark
weakens Danish CO2e-intensive firms’ international competitiveness,
some of the CO2e-emitting production that currently takes place in
Denmark moves abroad. And as the CO2e tariff reduces Danish de-
mand for fossil fuels, the world market price on fossil fuels is (slightly)
reduced, and the consumption of fossil fuels increases abroad.
The leakage rate in Denmark is largely affected by the climate policy
in the EU. The EU CO2 quota system has been designed such that
10 Economy and Environment, 2019English Summary
climate policy that reduces emissions in the Danish quota sector has
a limited impact on the total emissions in the EU’s quota sector in the
long run. This contributes to a higher leakage rate in Denmark. Con-
versely, the CO2e leakage in the non-quota sector is reduced by
many EU countries’ binding targets for their non-quota sector emis-
sions. This lowers the overall leakage rate in Denmark. The GTAP-E
model has been expanded to account for these mechanisms.
There are some mechanisms that may affect the leakage rate, which
are not included in the calculations. A tighter climate policy in Den-
mark may for example encourage technological development that
makes it easier to reduce emissions in other countries. This would
lower the leakage rate. A tighter Danish climate policy may also give
rise to higher reduction targets for other countries (the so-called pio-
neering country argument), which would lower the leakage rate as
well. However, a tighter climate policy could also reduce other coun-
tries’ incentive to undertake climate policy themselves, by solving a
part of the global challenge.
LEAKAGE RATES FOR DIFFERENT SECTORS
The calculations indicate large differences in the leakage rates for
different sectors in the Danish economy, see figure B.
Economy and Environment, 2019 11English Summary
FIGURE B LEAKAGE RATES FOR SECTORS
The leakage rates are high for agriculture and for sectors cov-
ered by the EU quota system (energy-intensive manufacturing
and electricity and heating).
Note: The figure shows the leakage rates in a scenario where the long
run effects of permanent climate policy is considered. The chap-
ter includes calculations of leakage rates under different assump-
tions and adjustments in the model.
Source: Own calculations.
The leakage rates are high for the energy-intensive manufacturing
and for the electricity and heating sectors, all of which are subject to
the EU quota system. The leakage rates are relatively high for the
quota sectors because a reduction in emissions in these sectors to a
large extent results in an increase in future emissions in the rest of
the EU. This is due to the design of the EU quota system implying
that reductions in emissions in these sectors only to a limited extent
reduce the long-term quantity of allowances in the EU.
The leakage rates are generally lower for the sectors not covered by
the EU quota system. One reason for this is that many EU countries
are expected to reduce their emissions from the non-quota sectors
towards 2030. These countries are therefore not able to increase
12 Economy and Environment, 2019English Summary
their emissions in this part of the economy in response to a tighter
climate policy in Denmark.
The leakage rate is higher for Danish agriculture than for the remain-
ing non-quota sectors. This reflects, among other things, that con-
sumption of food is less affected by changes in income and prices
than other products. Consequently, the production and associated
emissions in agriculture increase relatively much abroad when pro-
duction in agriculture decreases in Denmark as a result of regulation.
The leakage rate for agriculture is, however, limited by the fact that
many EU countries have binding targets for their emissions in the
non-quota sector towards 2030.
The leakage rate for agriculture is very dependent on the climate
policy outside the EU as well. A sensitivity analysis shows that the
leakage rate for agriculture is more than halved if a number of coun-
tries outside the EU is assumed to have binding targets as well, while
the leakage rates in other sectors are almost unaffected.2 The sensi-
tivity analysis illustrates the considerable uncertainty associated with
the calculation of the leakage rate for agriculture.
LEAKAGE AND DANISH CLIMATE POLICY
The design of a cost-effective regulation that reduces greenhouse
gas emissions depends on the political objective of the regulation. If
the objective of Danish climate policy is to meet the goals of reducing
CO2e emissions from Danish territory, this is achieved most cost-
effectively by a uniform (increasing) CO2e tariff on all emission
sources. Thus, differences in leakage rates between different sectors
should not be taken into account.
If, however, the objective of Danish climate policy is to reduce global
emissions over and above what follows from the existing international
obligations and national reduction targets, the regulation should take
CO2e leakage into account. If such a supplementary objective is to be
pursued cost-effectively, the climate effort must to some extent be
2) It is assumed in sensitivity analysis that all countries except large economies such as
China, Russia, India and the United States have binding targets and that they there-
fore cannot increase their emissions. It should be emphasized that there is consider-
able uncertainty as to whether different countries have binding climate goals accord-
ing to "business-as-usual". As an example, it is assumed in the analysis that the USA
does not have binding climate targets. The USA's affiliation with the Paris Agreement
is assessed by some as binding, but at the same time, the USA has indicated an in-
tention to withdraw from the Paris Agreement.
Economy and Environment, 2019 13English Summary
shifted from sectors with high leakage rates to sectors with low leak-
age rates. Such a shift can be achieved by introducing leakage-
adjusted CO2e tariffs that are lower for sectors where the leakage
rate is high.
Leakage-adjusted tariffs increase the socio-economic costs of reaching
the purely national obligations and objectives, but a larger global reduc-
tion of CO2e can be achieved for this additional price. The additional
socio-economic costs associated with leakage-adjusted tariffs com-
pared to a uniform tariff are calculated in the chapter to DKK 220-660
per tonne extra global reduction of CO2e. This is about the same mag-
nitude as estimates in the literature for the global marginal damage cost
for a tonne of CO2e emissions – the so-called social cost of carbon.3
The analysis in the chapter illustrates the effects of adjusting for leak-
age while reaching the 2030-obligations for the non-quota sector.4
However, the analysis should not be seen as an optimal Danish cli-
mate policy to reduce global emissions. The reason is that e.g. cli-
mate-differentiated consumption taxes or a reduction of the North
Sea oil and gas extraction could potentially be included in an optimal
leakage-corrected Danish climate policy.
The analysis is based on calculated socio-economic reduction costs
in 2030 for various parts of the non-quota sector. These were pre-
sented in the 2018 Economy and Environment report by Danish Eco-
nomic Councils. Here it was found that the marginal socio-economic
reduction costs were significantly higher for passenger cars than for
agriculture and the remaining non-quota sector.
The calculations indicate that the different sectors’ contributions to
the overall reduction requirement for the non-quota sector do not
change significantly when imposing leakage-adjusted tariffs instead
of a uniform tariff.
Despite of its relatively high leakage rate, agriculture should still con-
tribute significantly to the overall reduction when adjusting for leakage.
The high leakage rate does, however, contribute to a slightly smaller
3) In previous reports by the Danish Economic Councils, DKK 563 per tonne CO2e (2017
prices) is stated as a good estimate for the social cost of carbon based on an over-
view study by Tol (2013). It should, however, be emphasized that there is large uncer-
tainty related to the size of the social cost of carbon.
4) The calculations illustrate the additional effort needed to achieve the reduction re-
quirement in the non-quota sector by 2030. There is uncertainty about the exact size
of the reduction requirement, so the calculations are done for reductions of 2.5 million
tonnes as well as 4.0 million tonnes CO2e in 2030.
14 Economy and Environment, 2019English Summary
reduction in agriculture when adjusting for leakage.5 The relatively
modest effect on agriculture’s share of the overall reductions reflects
the fact that there are socio-economic benefits associated with reduc-
ing greenhouse gas emissions for this sector specifically, in the form of
a better aquatic environment and less air pollution.
Even though the leakage rate is very small for consumption of
transport fuel, increased tariffs on CO2 from passenger cars are not a
part of the leakage-adjusted tariff policy. This is because the marginal
socio-economic costs of further reductions are relatively high, since
passenger cars are already heavily regulated in Denmark.
According to an agreement with the EU, Denmark may use cancella-
tions of quota allowances corresponding to at most 0.8 million tonnes
per year to meet the reduction requirement. There is a negative leak-
age rate associated with this type of quota cancellations of approxi-
mately -53 per cent in the long run, which reflects mechanisms linked
to the reform of the quota system from early 2018. The calculations in
the chapter show that the quota cancellations should be fully utilized
if the reduction requirement in 2030 is 4.0 million tonnes CO2e, re-
gardless of whether a uniform or leakage-adjusted tariff policy is
used. If the reduction requirement is only 2.5 million tonnes CO2e,
quota cancellations should only be used when adjusting for leakage.
The analysis shows that there is a relatively limited impact on global
emissions of introducing leakage-adjusted tariffs instead of a uniform
tariff. With a national reduction requirement of 4.0 million tonnes in
2030, global emissions are reduced by 3.2 million tonnes with a uni-
form tariff. With leakage-adjusted tariffs, global emissions are re-
duced by 3.4 million tonnes. The relatively limited effect of introducing
leakage-adjusted regulation is in line with studies for other countries.
This is not in itself an argument for not using a leakage-adjusted
climate policy, but it is important not to have unrealistic expectations
for the effect on global emissions.
5) Agriculture’s share of overall reductions decreases from 43 to 33 per cent with a
reduction requirement of 2.5 million tonnes, and from 37 to 29 per cent with a reduc-
tion requirement of 4.0 million tonnes.
Economy and Environment, 2019 15Economy and Environment, 2019
You can also read