Results For the year ended 29 September 2017 - Greencore
←
→
Page content transcription
If your browser does not render page correctly, please read the page content below
Results For the year ended 29 September 2017
DISCLAIMER – FORWARD LOOKING STATEMENTS

 Certain statements made in this document are forward‐looking. These represent expectations for the Group’s
 business, and involve risks and uncertainties. The Group has based these forward‐looking statements on current
 expectations and projections about future events. These forward-looking statements may generally, but not
 always, be identified by the use of words such as “will”, “anticipates”, “should”, “expects”, “is expected to”,
 “estimates”, “believes”, “intends” or similar expressions.

 By their nature, forward-looking statements involve risk and uncertainty because they relate to events and depend
 on circumstances that may or may not occur in the future and reflect the Group's current expectations and
 assumptions as to such future events and circumstances that may not prove accurate. A number of material
 factors could cause actual results and developments to differ materially from those expressed or implied by
 forward-looking statements

 You should not place undue reliance on any forward-looking statements. These forward-looking statements are
 made as of the date of this presentation. The Group expressly disclaims any obligation to update these forward-
 looking statements other than as required by law.

                                                                                                                     2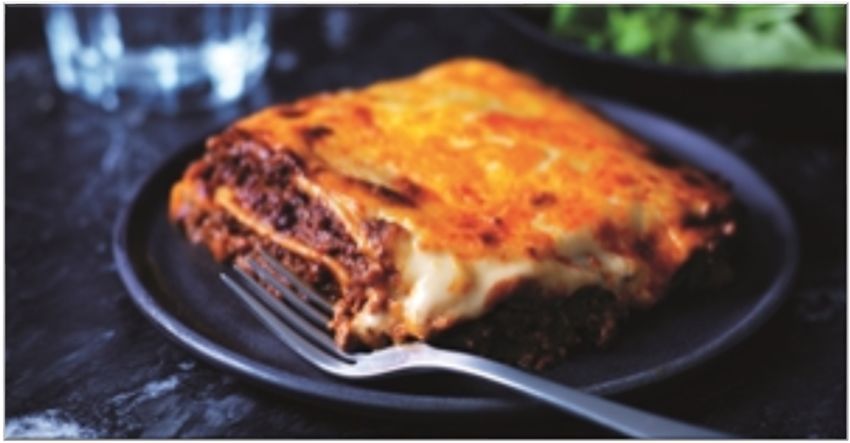
AGENDA
CONTEXT & HIGHLIGHTS

                Patrick Coveney, CEO
FINANCIAL REVIEW
Eoin Tonge, CFO
OPERATIONAL REVIEW & OUTLOOK
Patrick Coveney, CEO
Q&A
3
CONTEXT & HIGHLIGHTS
Patrick Coveney, CEO
GROWTH & PROGRESS IN A CHALLENGING YEAR

       Important progress…                        …but challenges too

• Creation of exciting, strong, scale US   • Substantial investment, restructuring
  business                                   and one-off costs
• Enhanced capacity, capability, market    • Performance challenges in smaller
  position and momentum in UK                parts of our portfolio
• Reset profitability and capital          • Strategy and model not yet delivering
  structure                                  for shareholders

                                                                                     5
GREENCORE TODAY

                         Fast-growing convenience food leadership in both UK
       Vision
                         and US

     Commercial          Collaborative, long-term, strategic partnerships with
    relationships        majority of large UK and US customers

Capacity, capability &   Significant investment in these areas to deliver medium
       culture           term growth

                         Recent strategic investments enable enhanced profit
  Economic model
                         conversion, cash flows and returns

                                                                                   6
FINANCIAL REVIEW

              Eoin Tonge, CFO
FY17 FINANCIAL PERFORMANCE
CHANGE
Acquisition of Peacock Foods and substantial investment programme in UK
REVENUE GROWTH
Strong underlying volume-led growth in Food to Go and US division
PROFIT CONVERSION
Lower operating leverage reflecting the operational investments and change
Considerable exceptional items due to investments and strategic choices
Operational disruption reduced in H2
CASH GENERATION, CAPITAL STRUCTURE AND RETURNS
Capital spend high, but trajectory moderating and Group leverage reducing during H2
ROIC diluted in near term, but clear path to medium term expansion
8
P&L SUMMARY                                  1,2

                                                                                                                                                         Change
£m                                                                               FY17                                 FY16
                                                                                                                                                    (as reported)

Group Revenue                                                                 2,319.7                              1,481.9                                +56.5%
                                                                                                                                                 (pro forma +9.4%)

Adjusted Operating Profit                                                       140.1                                102.0                                +37.4%
Adjusted Operating Margin                                                        6.0%                                 6.9%                                -90bps
Exceptional Items                                                               (78.2)                               (17.4)
Adjusted Profit Before Tax                                                      116.7                                  85.9                               +35.9%
Adjusted EPS (pence)                                                              15.4                                 16.0                                 -3.8%
Basic EPS (pence)                                                                  1.9                                  9.5                               -80.0%
Proposed DPS (pence)                                                              5.47                                 5.47                                      -

1 The Group uses Alternative Performance Measures ('APMs') which are non-IFRS measures to monitor the performance of its operations and of the Group as a whole. These
APM’s along with their definitions are provided in the Appendix                                                                                                                  9
2 Earnings per share and Dividend per share figures for FY16 have been restated to reflect the impact of the bonus element of the rights issue and are set out in the Appendix
CONVENIENCE FOODS UK & IRELAND
Change Change
£m FY17 FY16
(as reported) (pro forma)
Revenue 1,438.4 1,258.8 +14.3% +11.9%
Adjusted Operating Profit 106.8 104.1 +2.6%
Adjusted Operating Margin 7.4% 8.3% -90bps
Phase of intense operational change and development
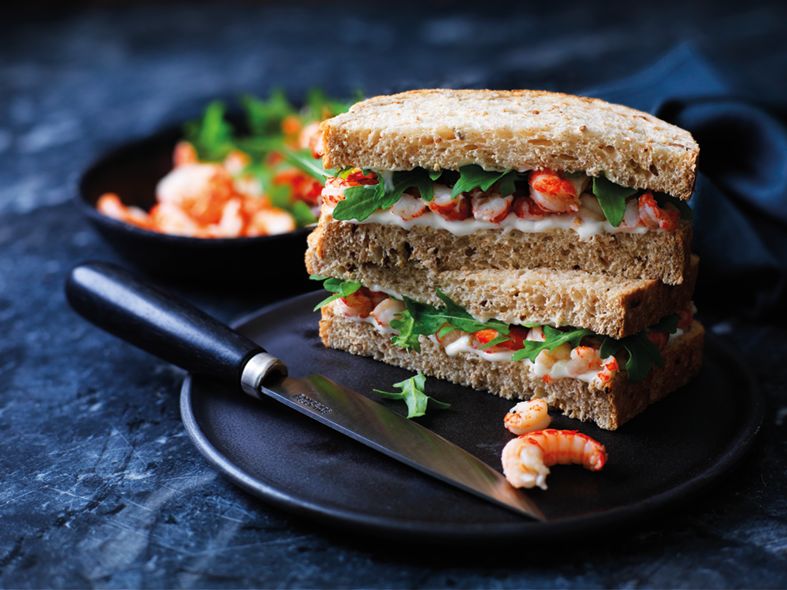
Food to Go pro forma revenue growth of 18.8%
– Operational disruption from business wins eased in H2
Other UK & Ireland pro forma revenue growth of 3.5%
– Margins impacted by commercial investments in ready meals and challenging conditions in cakes & desserts
Inflation fully mitigated in year
Streamlining of overall organisational cost structure underway
10CONVENIENCE FOODS US
Change Change
£m FY17 FY16
(as reported) (pro forma)
Revenue 881.3 223.1 +295.0% +5.9%
Adjusted Operating Profit 33.3 (2.1) n/a
Adjusted Operating Margin 3.8% -0.9% +470bps
Acquisition of Peacock Foods on 30 December 2016
Underlying pro forma volume growth of approximately 7%
Increase in Adjusted Operating Profit driven by the addition of Peacock Foods
– Core profitability in CPG business as anticipated
– Capacity utilisation and returns mixed in original part of business
Integration on track
– Cost synergies slightly ahead of expectations in FY17
– Completed operational integration of salad kits business
– Decision not to rationalise site network
11EXCEPTIONAL ITEMS
£m FY17
Intangible asset impairment (29.7)
Business exit (16.5)
Transaction costs (15.6)
Integration and reorganisation (11.2)
Pre-commissioning / Start up costs (4.1)
Legal settlement (1.1)
Total pre-tax (78.2)
Tax credit on exceptional items 8.9
Total (69.3)
Cash outflows of £38.6m associated with these charges, of which £28.7m incurred in FY17 and remainder in FY18
12CASH FLOW £m FY17 FY16 EBITDA 189.7 138.4 Working capital (3.0) 13.2 Maintenance Capital Expenditure (39.7) (31.9) Exceptional cash flow (33.7) (9.9) Other 4.5 4.1 Operating Cash Flow 117.8 113.9 Strategic Capital Expenditure (83.6) (71.2) Pension, Tax & Interest (38.8) (29.8) Acquisitions & Disposals (603.3) (15.7) Proceeds from share issue 427.7 1.1 Shares purchased for EBT (7.2) (13.8) Dividends (17.5) (20.0) Other including FX 17.5 (30.8) Change in Net Debt (187.4) (66.3) 13
CAPITAL EXPENDITURE
£m
83.6
71.2
39.7
31.9
Maintenance Strategic
FY16 FY17
As expected, Maintenance Capital Expenditure increased
with expanded business
Strategic Capital Expenditure increased by 17% in FY17
– Capacity investments to support new business wins
– Cost efficient capacity delivery in Food to Go
– Continued delivery of the co-investment model in the US
– Impact of choices we have made around capital allocation 14BALANCE SHEET & RETURNS
£m FY17 FY16 Change
Net Debt (519.2) (331.8) -187.4
Net Debt:EBITDA (x)* 2.4 2.4 -
Pension deficit (after tax) (103.1) (134.7) +31.6
ROIC 12.2% 13.8% -160bps
Balance sheet reconfigured with the acquisition of Peacock Foods
Valuation agreed for primary UK legacy defined benefit pension scheme
ROIC reduced due to the addition of Peacock Foods, increased tax rate and recent levels
of Strategic Capital Expenditure
*Net Debt:EBITDA leverage as measured under financing agreements
15SECURING PROFITABLE GROWTH
REVENUE GROWTH
Positioned well for both market and customer growth in UK
and US
PROFIT CONVERSION
Focus on leveraging recent investments
CASH GENERATION, CAPITAL STRUCTURE AND RETURNS
Clear path to improved cash flows and returns
16OPERATIONAL REVIEW
& OUTLOOK
Patrick Coveney, CEOOPERATIONAL REVIEW & OUTLOOK
1 STRATEGY & BUSINESS MODEL
2 UK & IRELAND DIVISION
3 US DIVISION
4 OUTLOOK
18OUR STRATEGY & BUSINESS MODEL SHAPED BY
1
STRUCTURAL TRENDS
‘Convenience’
driving
consumer
growth
Changes in Fragmented
labour . competitive
markets set
New customer
partnership
model
192 STRONG GROWTH IN UK – DRIVEN BY FOOD TO GO
Market growth FY17 11. 9%
KEY DRIVERS
Growing underlying market,
across channels, customers and
2.9% 3.0%
formats
Total UK Food UK Chilled Greencore pro
New business wins especially in
Convenience forma* Food to Go
Food to go growth FY17 18.8%
New customer (‘sole supply’)
partnership models
Greater investment to increase
6.6%
capacity and on-board new
business
UK food to go Greencore pro forma
Source: Nielsen 52 w/e 9 Sept 17 and Greencore data
* Convenience Foods UK & Ireland Division 20A FOOD TO GO NETWORK TO SUPPORT
2
FUTURE GROWTH
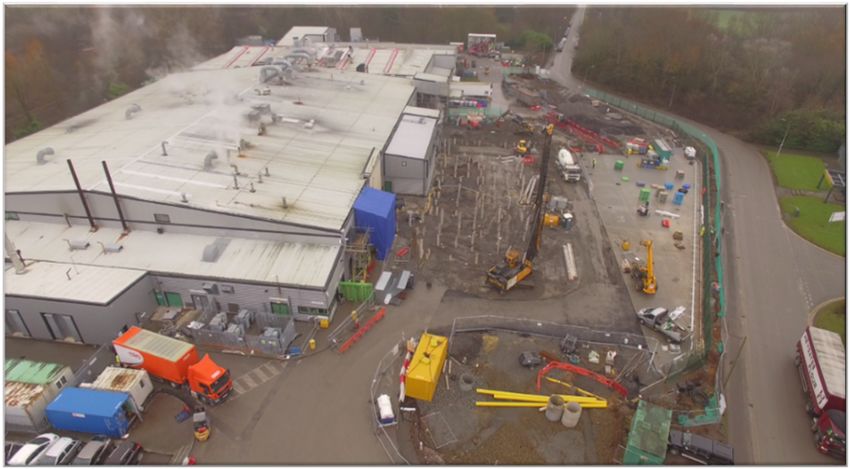
Significant expansion at Two new facilities at
Park Royal & Bow Northampton
Integration of Atherstone facility Acquisition of Heathrow facility
212 SELECTIVE CHOICES IN THE REST OF UK
Substantial investments at
Managed Evercreech exit,
Warrington & Wisbech to
consistent with category &
support customer growth in
capital strategy
chilled ready meals
222 RESHAPING ORGANISATION, MODEL & COST BASE
Streamlined UK organisation Revised technology agenda
Two-division structure, with New IT team, structure and
revised leadership team investment model
Upgraded operational Stopped development of new
capability common ERP platform in UK
Standardised processes and Avoidance of at least £50m
functions capex over the next 4-5 years
Reduced overheads £29.7m impairment of assets
created FY14-FY17
The Greencore Way reinforced
23US STRATEGY REFLECTS CONVERGENCE OF
3
CONSUMER & SUPPLY CHAIN TRENDS
DEMAND FOR FRESH GREENCORE US DEMAND FOR
PREPARED FOOD OUTSOURCING
Particular recent
Momentum in FY17, with demand for ‘high
6% ~7% pro forma volume care’ outsourcers
growth 5-7%
4% Complementary CPG &
retail customer set
3%
Greater focus on quality,
innovation & food safety
across channels
US US Fresh Prepared Packaged Food Outsourcing
Food Food industry
Sources: ERS (Census Retail Trade); IRI; Greencore internal data; Euromonitor; McKinsey 2015-2020 Estimated CAGR %, 2016 report 243 INTEGRATION OF PEACOCK FOODS ON TRACK
Progressing in line with plans
Single central office
Procurement
optimisation
Overhead reduction
Systems integration
(e.g. salad kits)
253 POSITIVE COMMERCIAL MOMENTUM
Market growth with brands and categories we serve
• Strengthened
CPG
Building share with existing customers across channels
relationships
• Strong salad
New outsourced solutions with existing customers
kits growth
More innovation with existing customers • Challenges in
original
network
Enlarged network/capabilities attract new customers
264 OUTLOOK
“Anticipate delivering a year of strong growth in FY18 ….
….. will approach benchmark leverage ratio of c. 2x net debt
to EBITDA by end of year.
Well positioned to drive improved profitability, cashflow and
returns over the medium term.”
27Q&A
Patrick Coveney, CEO
& Eoin Tonge, CFOAPPENDIX - FINANCIAL
29TAX RATE RECONCILIATION
FY17 FY16
Pre Adjusted Pre Adjusted
Adjustments Adjustments
Exceptional Earnings Exceptional Earnings
Adjusted Operating Profit 140.1 - 140.1 102.0 - 102.0
Amortisation of
intangibles
(19.2) 19.2 - (9.2) 9.2 -
Finance costs* (24.3) - (24.3) (17.0) - (17.0)
Pension financing (3.9) 3.9 - (4.4) 4.4 -
Taxable earnings 92.7 23.1 115.8 71.4 13.6 85.0
Taxation (7.4) (6.9) (14.3) (1.2) (3.7) (4.9)
Tax rate 8% 12% 2% 6%
* Excludes pension financing, FX on inter-company and certain external balances and the movement in the fair
value of all derivatives financial instruments and related debt adjustments 30PER SHARE RESTATEMENTS
EARNINGS PER ORDINARY SHARE (PENCE) As reported Restated*
FY16 HY16 FY16 HY16
Basic earnings per ordinary share 11.6 4.9 9.5 4.0
Adjusted earnings per ordinary share 19.5 8.2 16.0 6.7
Diluted earnings per ordinary share 11.4 4.8 9.4 4.0
Adjusted diluted earnings per ordinary share 19.2 8.1 15.8 6.6
DIVIDENDS PER ORDINARY SHARE (PENCE) As reported Restated*
FY16 HY16
Interim dividend FY16 2.55 2.10
Final dividend FY16 4.10 3.37
Total dividend FY16 6.65 5.47
* Restated to include the effect of the bonus issue of shares incorporated in the Rights Issue in December 16
31DEFINITIONS OF APMS
The Group uses the following Alternative Performance Measures ('APMs') which are non-IFRS measures to monitor
the performance of its operations and of the Group as a whole
Pro Forma Sales Growth
• Pro Forma Sales Growth for FY17 adjusts reported revenue to reflect ownership of both Peacock Foods and The
Sandwich Factory for the full period for both FY16 and FY17 and excludes the impact of the Heathrow acquisition.
These figures are also presented on a constant currency basis and exclude the impact of the 53 rd week in FY16
Adjusted EBITDA, Adjusted Operating Profit & Adjusted Operating Margin
• Adjusted Operating Profit is calculated as operating profit before amortisation of acquisition related intangibles and
exceptional charges. Adjusted EBITDA is calculated as Adjusted Operating Profit plus depreciation and amortisation.
Adjusted Operating Margin is calculated as Adjusted Operating Profit divided by reported revenue
Adjusted Earnings and Adjusted Earnings Per Share (‘EPS’)
• Adjusted Earnings is calculated as profit attributable to equity holders (as shown on the Group’s Income Statement)
adjusted to exclude exceptional items (net of tax), the effect of foreign exchange (FX) on inter-company and external
balances where hedge accounting is not applied, the movement in the fair value of all derivative financial instruments
and related debt adjustments, the amortisation of acquisition related intangible assets (net of tax) and the interest
expense relating to legacy defined benefit pension liabilities (net of tax). Adjusted EPS is calculated by dividing
Adjusted Earnings by the weighted average number of Ordinary Shares in issue during the year, excluding Ordinary
Shares purchased by Greencore and held in trust in respect of the Annual Bonus Plan, the Performance Share Plan
and the Executive Share Option Scheme, and after adjusting the weighted average number of shares in the prior
year for the effect of the Rights Issue and related bonus issue on the average number of shares in issue
Adjusted Profit Before Tax ‘(PBT’)
• Adjusted PBT is calculated as Profit before taxation, excluding tax on share of profit associate and before,
exceptional items, pension finance items, amortisation of acquisition related intangibles, FX on inter-company and
certain external balances and the movement in the fair value of all derivative financial instruments and related debt
32
adjustmentsDEFINITIONS OF APMS
Capital Expenditure
• The Group defines Maintenance Capital Expenditure as the expenditure required for the purpose of sustaining the
operating capacity and asset base of the Group, and of complying with applicable laws and regulations. It includes
continuous improvement projects of less than £1m that will generate additional returns for the Group
• The Group defines Strategic Capital Expenditure as the expenditure required for the purpose of facilitating growth
and developing and enhancing relationships with existing and new customers. It includes continuous improvement
projects of greater than £1m that will generate additional returns for the Group. Strategic Capital Expenditure is
generally expansionary expenditure creating additional capacity beyond what is necessary to maintain the Group’s
current competitive position and enables the Group to service new customers and/or contracts or to enter into new
categories and/or new manufacturing competencies
Operating Cash Flow
• The Group calculates Operating Cash Flow as Adjusted Operating Profit plus deprecation and IT related amortisation,
share-based payment expense, dividends received from associates, movement in working capital, maintenance
capital expenditure, cash outflow related to exceptional items and other movements within operating activities
Net Debt
• Net Debt comprises current and non-current borrowings less net cash and cash equivalents
Return on Invested Capital (‘ROIC’)
• The Group calculates ROIC as net Adjusted Operating Profit after tax (‘NOPAT’) divided by average invested capital.
NOPAT is calculated as Operating Profit plus share of profit of associates before tax, less tax at the effective rate in
the Income Statement. Invested capital is calculated as net assets (total assets less total liabilities) excluding Net
Debt and the balance sheet value of derivatives not designated as fair value hedges, it also excludes retirement
benefit obligations (net of deferred tax assets). Average invested capital is calculated by adding together the invested
capital from the opening and closing balance sheet and dividing by two
33IR CALENDAR & CONTACT
Q1 Trading Update 30 January 2018
Annual General Meeting 30 January 2018
FY18 Interim Results 22 May 2018
Q3 Trading Update 24 July 2018
FY18 Full Year Results 27 November 2018
Jack Gorman
Head of Investor Relations
investor.relations@greencore.com
Tel. +353 1 605 1000You can also read