Investor Presentation - September 2019 - American Axle & Manufacturing
←
→
Page content transcription
If your browser does not render page correctly, please read the page content below
Investor Presentation
     September 2019
Forward Looking Statements
This presentation contains forward-looking statements within the meaning of the Private Securities Litigation Reform Act of 1995. These forward-
looking statements involve certain risks and uncertainties that could cause actual results to differ materially from those expressed or implied by these
statements. These risks and uncertainties include factors detailed in the reports we file with the SEC, including those described under “Risk Factors” in
our most recent Annual Report on Form 10-K. These forward-looking statements speak only as of the date of this communication. We expressly
disclaim any obligation or undertaking to disseminate any updates or revisions to any forward-looking statement contained herein to reflect any change
in our expectations with regard thereto or any change in events, conditions or circumstances on which any such statement is based.

It should also be noted that this presentation contains certain financial measures, including Adjusted EBITDA, Adjusted Earnings per Share, Adjusted
Free Cash Flow, and Net Leverage Ratio that are not required by, or presented in accordance with, accounting principles generally accepted in the
United States, or GAAP. These measures are presented here to provide additional useful measurements to review our operations, provide transparency
to investors and enable period-to-period comparability of financial performance. A description of non-GAAP financial measures that we use to evaluate
our operations and financial performance, and reconciliation of these non-GAAP financial measures to the most directly comparable financial measures
calculated and reported in accordance with GAAP, can be found in the appendix under “Reconciliation of Non-GAAP Measures”.

                                                                                                                                                            2
About AAM
                                                                           Over
                As a leading, global tier 1 automotive supplier,
                 AAM designs, engineers and manufactures                   70
                                                                      MANUFACTURING
              driveline, metal forming and casting technologies         FACILITIES

               that are making the next generation of vehicles
                   smarter, lighter, safer and more efficient
 2018 SALES

$7.27B
    Over
                 AAM delivers POWER that moves the world

  700         through world-class quality, technology leadership
                        and operational excellence
                                                                           16
 CUSTOMERS                                                          ENGINEERING CENTERS

    Over                                                   Over

25,000                               17
                                   COUNTRIES
                                                          85
 ASSOCIATES                                             LOCATIONS
                                                                                          3
Business Units and Market Leadership
DRIVELINE                                                                                              METAL FORMING                                                                                                 CASTING
• 2018 Sales - $4.9B; 28 facilities                                                                    • 2018 Sales - $2.0B; 35 facilities                                                                           • 2018 Sales - $900M; 11 facilities
• #1 Globally                                                                                          • Largest automotive forger in                                                                                • Leading automotive iron casting
 • Full-size pickup truck and SUV                                                                        the world                                                                                                     operations
   driveline systems
                                                                                                       • #1 Globally                                                                                                 • #1 North America ductile iron
 • Damped gears and rubber isolations
   pulleys                                                                                                  •     Powdered metal connecting rods                                                                       casting supplier
 • Viscous dampers for passenger cars                                                                       •     Differential gears
                                                                                                                                                                                                                     • #1 or #2 North America
                                                                                                            •     Axle shafts
• #1 North America and #2 China –                                                                           •     Hypoid pinions                                                                                      •   Differential carriers and cases
  AWD systems for crossover vehicles                                                                        •     Ring gears                                                                                          •   Steering knuckles
                                                                                                                                                                                                                      •   Control arms
• Pioneer of disconnecting AWD                                                                         • #1 North America                                                                                             •   Brake calipers
  Systems                                                                                                   • Transmission gears
                                                                                                            • CVT pulleys
• One of the leaders in hybrid and
                                                                                                            • Aluminum valve bodies
  electric driveline solutions
 *Note: Market leadership based on company estimates as compared to other independent suppliers, business unit sales based on 2018 amounts before eliminations of intercompany sales of approximately $0.5 billion
Financial Targets
2019 Financial Outlook
      as disclosed on August 2, 2019

                                                                                      Updated 2019 Financial Targets
              Full Year Sales                                                                            $6.9 - $7.0 billion
              Adjusted EBITDA*                                                                           $1.05 - $1.10 billion
              Capital Expenditures                                                                       Reduced to ≈ $485 million (From ≈ $515 million)
              Adjusted Free Cash Flow*                                                                   ≈ $250 million
             AAM’s revised full year 2019 financial targets reflect:
             • An estimate of production volumes for the remainder of 2019 based on internal and external sources and the
               current metal market environment.
             • A reduction in profitability primarily associated with lower sales and an increase in engineering, research and
               development expenditures to support our future e-AAM hybrid and electric driveline growth.
             • Continued operational improvements in-line with previous commentary.
* For definitions of Adjusted EBITDA and Adjusted Free Cash Flow and Non-GAAP reconciliations, please see the attached appendix                            6
Sales Walk – Previous Target to Revised Target
      (in millions)

                       $7,300

                                                             ($35)                                                                                   $6,900 - $7,000
                                                                                   ($125)        ($60)
                                                                                                                    ($50)         ($30)
                                                                                                                                            ($50)

             Prior Full Year 2019 Lower Metal Market Asia, primarily China                  Non-GM Full-Size   Global Engine &   Castings   Other   Revised Full Year
                 Sales Target       Passthroughs                                                 Truck          Transmission                        2019 Sales Target
                                                                                                                  Programs

Note: Utilized the mid point for the range of each element for charting purposes                                                                                        7
Adj. EBITDA Walk – Previous Target to Revised Target
      (in millions)

                              $1,200

                                                                                                                                                                                 $1,050 - $1,100

                                                                                                ($110)                                                     ($15)

                  Prior Full Year 2019                                                    Volume & Mix                                          Increased R&D Spending for      Revised Full Year
                Adjusted EBITDA Target                                                                                                             Electrification Growth    Adjusted EBITDA Target

Note: For definitions of Non-GAAP measures, please see the attached appendix; Utilized the mid point for the range of each element for charting purposes                                              8
1H 2019 to 2H 2019 Adjusted EBITDA Walk
      (in millions)

                                                                                                                                                                            $15 - $30                $539 - $589
                                                                                                                       $15
                                                                     $10 - $50
                            $511
                                                                                                                                                    (≈$15)
                                                                                                                                                                                                      ≈16% Adj.
                                                                                                                                                                                                       EBITDA
                                                                                                                                                                                                       margin
                                                                                                                                                                                                      (midpoint)

                         14.9% Adj.
                          EBITDA
                           margin

           1H 2019 Adjusted EBITDA                       Backlog / Volume & Mix                         Synergies and BU                   Additional e-AAM related    Productivity, Reduced 2H 2019 Targeted Adjusted
                                                                                                      Consolidation Savings                    R&D investment         Launch Costs and other          EBITDA

Note: For definitions of Non-GAAP measures, please see the attached appendix; Utilized the mid point for the range for charting purposes                                                                                 9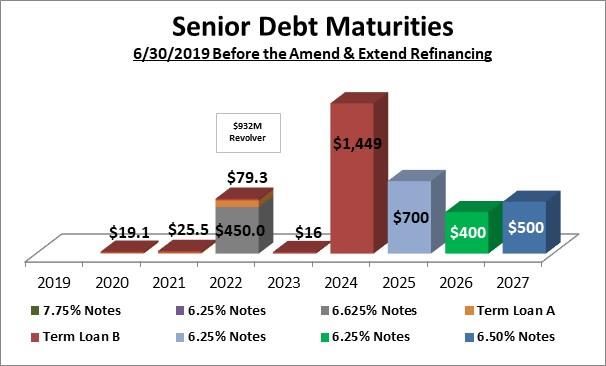
Transition from Heavy Launch and Integration Period

   Key Activities           2017 - 2019                  2020 - 2022
                                                      Expect an average of
 Launches                Average ≈60 per year
                                                        10 - 20 per year
                             Key acquisition,
                             integration and            Integration will be
 MPG Transaction
                            synergy activities          complete in 2020

                           Elevated to support
                                                    Return to normalized levels
 Capital Spending       launches and integration
                                                         (5 - 6% of sales)
                            (7 - 8% of sales)
     AAM to benefit from fewer launches and a more stable operating environment   10
Profit Margin and Cash Flow Opportunities
Reduces Decremental
Margin Opportunities: Expect to achieve $50 - 75 million of EBITDA Margin Impact
improvements for these items in 2020 compared to 2019 if Sales Decline
Additional synergy, SG&A and business unit consolidation savings
Full rate of launch/performance improvements and lower project expense
Pursue additional purchasing and VA/VE savings initiatives
Implement additional capacity rationalization for fixed cost reductions
Increase productivity savings with more stable operating environment
Additional Cash Flow Benefits / Debt Reduction Opportunities
Lower Capital Spending in 2020 of 5 - 6% of sales
Lower expected interest payments in 2020
Evaluate portfolio for non-core business divestitures 11Downside Protection Playbook
Sales Decline 0% 25%+
AND / OR Restructuring Costs
Potential Actions Duration Expected Short Longer Required?
Reduce Variable Costs
• Direct Material (≈60% of COGS)
• Hourly Headcount No
• Variable Overhead
Reduce Semi-fixed Costs
• Salaried headcount, merit and incentive compensation adjustments/deferrals
• Formal spending reduction programs (ex. travel) Limited
• Align future R&D, project and capital expenses to lower sales levels
Select Recapacitating of Facilities
• Align capacity with customers Moderate
• Plant loading adjustments to optimize capacity
Structural Capacity and Overhead Reduction
• Global footprint consolidations
• Significant Salaried Reduction in Force programs
Higher
Note: This list includes examples for illustrative purposes and does not include all potential actions
GOAL: Align capacity and cost structure with market demand 12Electrification Growth
TM
e-AAM Hybrid and Electric Driveline Systems
 KEY HIGHLIGHTS
▪ Highly integrated electric motor, gear reduction, & differential
▪ Power dense, low NVH, high efficiency design allows for
  easy integration for multiple vehicle platforms
                                                                           AAM P3 Rear e-Drive unit (Hybrid)
▪ Broad spectrum of solutions - from value to high                               Launching in 2020
  performance - to meet a wide range of vehicle, customer
  and geographic requirements
▪ First launched on the Jaguar I-Pace AWD crossover –
  featuring e-AAM’s front and rear eDrive units
▪ Combined annual revenues for our two booked e-AAM
  programs are expected to be $100 - $200 million by 2021            Jaguar I-Pace P4 e-Drive units (e-AWD BEV)
                                                                                  Launched in 2018

  Combined lifetime revenues of awarded e-AAM programs is estimated to be over $1 billion
                                                                                                                  14
Growing Book of Business
1st Award 2nd Award NEW AWARD
Customer Jaguar Premium European OEM Chinese OEM
Vehicle I-Pace AWD Crossover High Performance Pass Car Small Pass Car
Architecture P4 BEV P3 Hybrid P4 BEV
Customer Req. Performance Performance Value
15Future Electrification Opportunities
AAM’s product portfolio supporting e-powertrains is driving potential new business globally
Gear Box Applications Vehicle Integration Integrated eFront Drive Units
ePowertrain Components Integrated eRear Drive Units
$500M
Quoting and Emerging
New Business
Opportunities
16Capital Structure and Allocation Priorities
Recent Refinancing and Extended Debt Maturities

                                                                            $925M
                                                                           Revolver

Other Benefits:
• Lowered interest expense
• Reset Net Leverage Ratio covenant requirement for business flexibility
                                                                                      18
Cash Flow Breakeven
US SAAR (units in millions)
25-30% downturn
▪ Highly variable cost structure allows for
≈17.2 flexibility during periods of lower volumes
▪ AAM has track record of reducing fixed costs
through facility and labor efficiency initiatives
≈12 during previous downside periods
▪ Multiple options available to manage to
additional potential change in volumes,
including SG&A, capital spending, R&D etc.
▪ Continued synergy attainment and productivity
2018 Breakeven initiatives further reduce breakeven points
AAM has a flexible cost structure
19Capital Allocation
Leverage Reduction Organic Growth
>$500M of senior debt payments Invest in R&D and continue organic
since the MPG acquisition growth with the appropriate returns
Strategic Shareholder Activity
Focus on objectives of technology, At the appropriate time, other
portfolio positioning, diversification options that may benefit our
and growth shareholders further
Capital allocation aligned with AAM’s strategic objectivesSupplemental Data
LV Production and Sales Volume Assumptions
                                                             Previous                        Current
                   Global Light Vehicle Production   ≈ 95M units, or up 1% from 2018    ≈ Down 4% from 2018

      North America (NA) Light Vehicle Production         ≈ 16.5M – 17M units            ≈ 16.4M - 16.7M units

                                      US SAAR             ≈ 16.5M – 17M units            ≈ 16.5M – 16.8M units

                  Europe Light Vehicle Production           ≈ Flat from 2018           ≈ Down 3 - 4% from 2018

                   China Light Vehicle Production           ≈ Flat from 2018           ≈ Down 8 - 10% from 2018

Source: IHS, ACT, company estimates                                                                               23
Reconciliation of Non-GAAP Measures
In addition to the results reported in accordance with accounting principles generally accepted in the United States of
America (GAAP) included within this presentation, we have provided certain information, which includes non-GAAP
financial measures. Such information is reconciled to its closest GAAP measure in accordance with Securities and
Exchange Commission rules and is included in the following slides.
Certain of the forward-looking financial measures included in this earnings release are provided on a non-GAAP
basis. A reconciliation of non-GAAP forward-looking financial measures to the most directly comparable forward-
looking financial measures calculated and presented in accordance with GAAP has been provided. The amounts in
these reconciliations are based on our current estimates and actual results may differ materially from these forward-
looking estimates for many reasons, including potential event driven transactional and other non-core operating items
and their related effects in any future period, the magnitude of which may be significant.
24Supplemental Data
Full Year 2019 Outlook
($ in millions)
Adjusted EBITDA
Low End High End
Net income $ 190 $ 230
Interest expense 220 220
Income tax expense 25 35
Depreciation and amortization 565 565
Full year 2019 targeted EBITDA 1,000 1,050
Restructuring and acquisition-related costs 50 50
Full year 2019 targeted Adjusted EBITDA $ 1,050 $ 1,100
Adjusted
Free Cash
Flow
Net cash provided by operating activities $ 680
Capital expenditures net of proceeds from the sale
of property, plant and equipment (485)
Full year 2019 targeted Free Cash Flow 195
Cash payments for restructuring and acquisition-
related costs 55
Full year 2019 targeted Adjusted Free Cash Flow $ 250
25Definition of Non-GAAP Measures EBITDA and Adjusted EBITDA We define EBITDA to be earnings before interest expense, income taxes, depreciation and amortization. Adjusted EBITDA is defined as EBITDA excluding the impact of restructuring and acquisition-related costs, debt refinancing and redemption costs, gain on sale of a business, goodwill impairments and non-recurring items. We believe that EBITDA and Adjusted EBITDA are meaningful measures of performance as they are commonly utilized by management and investors to analyze operating performance and entity valuation. Our management, the investment community and the banking institutions routinely use EBITDA and Adjusted EBITDA, together with other measures, to measure our operating performance relative to other Tier 1 automotive suppliers. We also use Segment Adjusted EBITDA as the measure of earnings to assess the performance of each segment and determine the resources to be allocated to the segments. EBITDA and Adjusted EBITDA should not be construed as income from operations, net income or cash flow from operating activities as determined under GAAP. Other companies may calculate EBITDA and Adjusted EBITDA differently. Adjusted Earnings per Share We define Adjusted earnings per share to be diluted earnings per share excluding the impact of restructuring and acquisition-related costs, debt refinancing and redemption costs, gain on sale of a business, goodwill impairments and non-recurring items, including the tax effect thereon. We believe Adjusted earnings per share is a meaningful measure as it is commonly utilized by management and investors in assessing ongoing financial performance that provides improved comparability between periods through the exclusion of certain items that management believes are not indicative of core operating performance and which may obscure underlying business results and trends. Other companies may calculate Adjusted earnings per share differently. Free Cash Flow and Adjusted Free Cash Flow We define free cash flow to be net cash provided by operating activities less capital expenditures net of proceeds from the sale of property, plant and equipment. Adjusted free cash flow is defined as free cash flow excluding the impact of cash payments for restructuring and acquisition-related costs, settlements of pre-existing accounts payable balances with acquired entities, and interest payments upon the settlement of acquired company debt. We believe free cash flow and Adjusted free cash flow are meaningful measures as they are commonly utilized by management and investors to assess our ability to generate cash flow from business operations to repay debt and return capital to our stockholders. Free cash flow and Adjusted free cash flow are also key metrics used in our calculation of incentive compensation. Other companies may calculate free cash flow and Adjusted free cash flow differently. Net Debt and Net Leverage Ratio We define net debt to be total debt, net less cash and cash equivalents. We define Net Leverage Ratio to be net debt divided by the trailing 12 months of Adjusted EBITDA. We believe that Net Leverage Ratio is a meaningful measure of financial condition as it is commonly used by management, investors and creditors to assess capital structure risk. Other companies may calculate Net Leverage Ratio differently. Liquidity We define Liquidity as cash on hand plus amounts available on our revolving credit facility and foreign credit facilities. US SAAR We define US SAAR as the seasonally adjusted annual rate of light vehicle sales in the United States.
You can also read