Wolfe Global Autos Conference - AAM Investor Presentation February 25, 2021 - American Axle
←
→
Page content transcription
If your browser does not render page correctly, please read the page content below
AAM Investor Presentation
                    Wolfe Global Autos Conference

February 25, 2021
Forward-Looking Statements
This supplemental information contains forward-looking statements within the meaning of the Private Securities Litigation
Reform Act of 1995. These forward-looking statements involve certain risks and uncertainties that could cause actual
results to differ materially from those expressed or implied by these statements. These risks and uncertainties include
uncertainty around the duration and effects of the COVID-19 pandemic, and include factors detailed in the reports we file
with the SEC, including those described under “Risk Factors” in our most recent Annual Report on Form 10-K and our
Quarterly Reports on Form 10-Q. These forward-looking statements speak only as of the date of this communication. We
expressly disclaim any obligation or undertaking to disseminate any updates or revisions to any forward-looking statement
contained herein to reflect any change in our expectations with regard thereto or any change in events, conditions or
circumstances on which any such statement is based.

It should also be noted that this information contains certain financial measures, including Adjusted EBITDA, Adjusted
Earnings per Share, Adjusted Free Cash Flow, Net Leverage Ratio and Liquidity that are not required by, or presented in
accordance with, accounting principles generally accepted in the United States, or GAAP. These measures are presented
here to provide additional useful measurements to review our operations, provide transparency to investors and enable
period-to-period comparability of financial performance. A description of non-GAAP financial measures that we use to
evaluate our operations and financial performance, and reconciliation of these non-GAAP financial measures to the most
directly comparable financial measures calculated and reported in accordance with GAAP, can be found in the appendix
under “Reconciliation of Non-GAAP Measures”.

                                                                                                                            2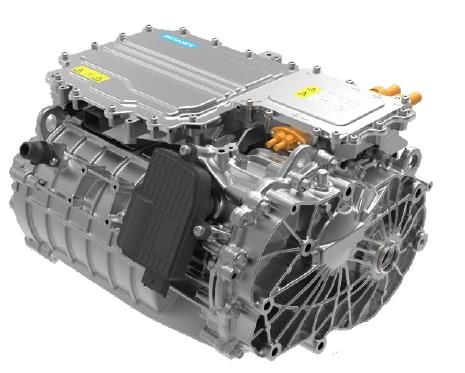
2020 4Q and Full Year Financial Highlights

          4Q                                             $1.44B                                                                    $262M             $173M
                                                               Quarterly                                                            Quarterly         Quarterly
         2020                                                   Sales                                                              Adj. EBITDA        Adj. Free
                                                                                                                                    18.2% of Sales   Cash Flow

          FY                                           $4.71B                                                                      $720M             $311M
                                                                 Full Year                                                          Full Year         Full Year
         2020                                                     Sales                                                            Adj. EBITDA        Adj. Free
                                                                                                                                    15.3% of Sales   Cash Flow

                                                                                                                                                                  3
* For definitions of Adjusted EBITDA and Adjusted Free Cash Flow and non-GAAP reconciliations, please see the attached appendix.
2020 AAM Highlights
          Implemented             Won Both PACE
                                                        Continued Strong
         Significant Cost         Partnership and
                                                         Free Cash Flow
        Savings Actions to       Innovation Awards
                                                         Generation and
          Adjust to New           for Electric Drive
                                                         Debt Reduction
         Market Demand               Technology

                                    BITDA*               Formed Technical
         Received Silver         Launched First           Agreement with
         Quality Award at         China eDrive         Inovance Automotive
          Ford’s World           Program at our         and Awarded 4 New
        Excellence Awards       Liuzhou AAM JV             Electrification
                                                         Programs in China

        Recognized as GM                                   Secured Next
                                    Published
        Supplier of the Year                             Generation Ram
                                 Comprehensive
          for Fourth Year                              Heavy Duty Axle and
                               Sustainability Report
              in a Row                                  Driveshaft program
                                                                             44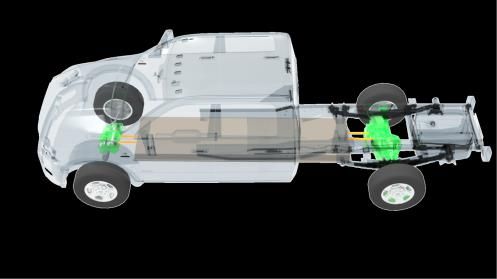
AAM Technology/Partnerships/Launches

  ▪   Technical advancement of fully integrated 3-in-1 EDUs        ▪    Invested In REE Automotive
  ▪   Access to the largest BEV Market (China)                     ▪    Electric platform leader reinventing e-mobility
  ▪   High value power electronics                                 ▪    Integrates traditional vehicle components in the arch
  ▪   Four programs awarded via partnership                             of the wheel
                                                                   ▪    Allowing for flat and modular electric platforms

        Next Generation Drive Units                                                 Key Launches
  ▪   Highly integrated advanced 3-in-1 technology             ▪       Rear e-Drive units for European high performance
  ▪   Substantial improvement over currently available units           hybrid passenger car (multiple variants)
  ▪   World class efficiency and NVH                           ▪       Multiple program launches in China
  ▪   AAM proprietary motor, invertor, and gear technology     ▪       Multiple electric powertrain component launches on
                                                                       multiple vehicle segments including electric pick-up
                                                                       truck and commercial vehicle

                                                                                                                                5
Securing The Core - RAM

                          NEXT-GEN RAM HD PICKUP TRUCKS

                ▪ Axle and Driveshaft
                ▪ Strategic supplier through 2030
                ▪ Current and future sales to exceed several billion dollars

                                                                               6
Gross New Business Backlog
                       $600 MILLION: 2021 – 2023                   as disclosed on February 12, 2021

          Backlog by Vehicle Segment                           Backlog by Region
              Key Megatrends
                  Non-
             DriveAuto
                   AAM
                   5%
                            Growth
                       Passenger
                         Cars
                          10%                                 Asia 30%

         Full-size
        Light Truck              Crossover
                                                                                                 North
         and SUV                Vehicles 30%
                                                                                                America
           40%                                                                                   50%
                                                          Europe 20%

                      eDrive
                       15%

   Electrification continues to be a growing       portion of AAM’s new business backlog
                                       AAM Confidential                                                   7
2021 Financial Outlook                                                                                           as disclosed on February 12, 2021

                                                                                                              2021 Financial Targets
                      Full Year Sales                                                                                             $5.3 - $5.5 billion
                      Adjusted EBITDA                                                                                             $850 - $925 million
                      Adjusted Free Cash Flow                                                                                     $300 - $400 million
            •        These targets are based on the following industry production assumptions for 2021:
                       • North American light vehicle production in the range of 15.5 - 16 million units
                       • European light vehicle production of approximately 19 million units
                       • China light vehicle production of approximately 25 million units

            •        Full year targets are based on current and anticipated customer production and launch schedules.

            •        Adjusted Free Cash Flow target assumes capital spending of approximately 4.5% of sales
            •        AAM expects restructuring and acquisition-related cash payments to be between $50 and $65 million
* For definitions of Adjusted EBITDA and Adjusted Free Cash Flow and Non-GAAP reconciliations, please see the attached appendix                            8
Electrification Product Technology

Electrification Addressable Market
                              AAM anticipates the addressable sourcing market at
                                            ~$18-20 billion by 2030
                       ▪     This includes electric drive units, subsystems and components
                       ▪     We offer solutions for various OEM go-to-market strategies for electric vehicles
                       ▪     Our technology is a key differentiator
                       ▪     We expect the market to grow past 2030

                                                                   AAM’s Competitive Advantage
                   Global Size                Operational                 Technology               Broad Product        Integration    Technical
                    & Scale                   Excellence                  Leadership                 Portfolio          Experience    Partnerships

*Note: Total global addressable markets is based on electric drive unit install rates across various propulsion types
Source: IHS estimates and internal calculations
Significant Content Opportunity
Customer In-House Support Customer Outsourced Support
Components Subsystems Gearboxes Electric Drive Units Vehicle Integration & Controls
AAM CPV: Up to $500 AAM CPV: Up to $2,500+
AAM is Positioned to Support All OEM Sourcing StrategiesAAM Electrification History
Key Business Awards in Electrification To Date
2-in-1 Electric Drive Units 3-in-1 Electric Drive Units (Platform)
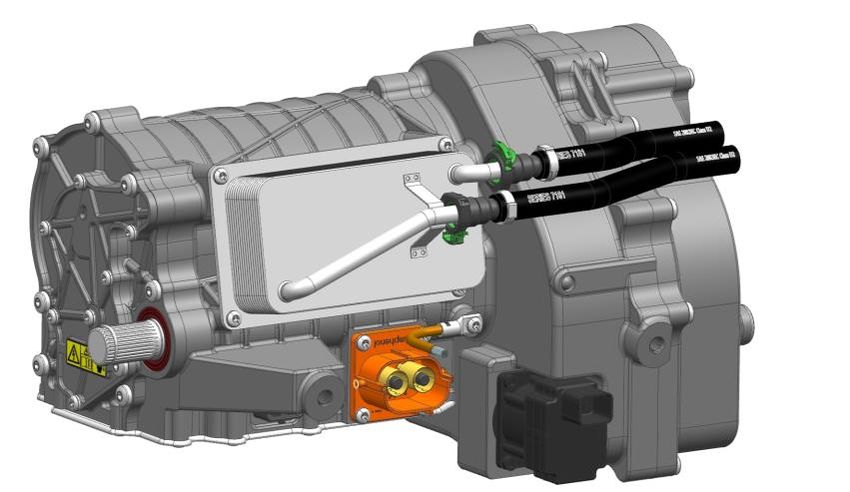
Jaguar I-PACE (Europe) AAM / Inovance 3-in-1 eDrive (China)
• Two P4 Electric Drive Units • P4 Platform Electric Drive Units
• 150 kW Power Level • Scalable Power Level based on Application
• Power Dense Concentric Design • Offset Gearbox Design 4 Programs
• Integrated Park Lock (Front EDU only) • Optional Park Lock 1 Launched
Launched 3 Awarded
Baojun E300 City Car (China) Electric Drive Components
• P4 Gearbox
• 40 kW Peak Power
• Offset Gearbox Design Electronic Limited Slip Differential
Awarded
• Integrated Park Lock • North American BEV Pick-up Truck Application
Launched
Commercial Vehicle Differential
High Performance Luxury OEM (Europe) • North American BEV Semi-Truck Application Awarded
• P3 Hybrid Electric Drive Unit
• 160kW Peak Power
• 2-speed Concentric Gearbox Design Planetary Geartrain
• Integrated TracRite® eLSD • European BEV Passenger Car Application Awarded
2021 Launch
12AAM / Inovance Technical Partnership
▪ Inovance Overview
– Leading Independent Traction Inverter Supplier in China
– Portfolio of Electric Propulsion Products
Inverters, Motors, DC/DC Converters, On-Board Chargers, 3-in-1 Electric Drive Units
– Strong Technical Team with Full Development Capability
– Competitive and Vertically Integrated Manufacturing Footprint
▪ Four Programs Awarded via Partnership
Partnership Accelerates Development of Next Generation Fully Integrated
3-in-1 EDUs and Increased Access to the largest BEV MarketAAM Next Generation Electric Drive
Market Critical Attributes
WLTP Consumption [Whr/Km]
Outside: Best CLTC-P Consumption
Output Nm / L
Inside: Worst [Whr/Km]
Efficiency
kW / L
Packaging EPA Consumption [Whr/Km]
Mass Price AAM Next Generation Electric Drive Units Deliver Compelling Performance
Output Nm / kg Price / kW
>10% >40% >40% >10% Strong
Improvement Improvement Improvement Less Battery Value
kW / kg Price / Output Nm
in Mass in Volumetric in Power Consumption, Proposition
Benchmark AAM Gen 5 Efficiency Efficiency Density More Range
AAM’s Next Generation Electric Drive exceeds
widely recognized industry benchmark in terms of critical EDU attributes
14Scalable & Modular Platform
AAM’s Next Generation Scalable & Modular Electric Drive Units support numerous
vehicle applications while optimizing capital and development costs
Wheel End Light Duty Beam Heavy Duty Beam
Single Motor Dual Motor
Optional Torque
Scalable Power Levels Modular Motor Construction Various EDU Architectures Multiple Gear Ratios
Vectoring & Disconnect
P3 HYBRID ARCHITECTURE P4 SPLIT AXLE HYBRID ARCHITECTURE P4 RWD ARCHITECTURE P4 AWD MPV ARCHITECTURE P4 AWD ARCHITECTURE
P4 FWD ARCHITECTURE P4 AWD ARCHITECTURE P4 4WD ARCHITECTURE P4 4WD HD ARCHITECTURE
Denotes AAM EDU applicationElectrification Summary
Well positioned to
Proven electric drive support all OEM sourcing Global reach and
systems design and strategies leveraging our scalable product portfolio
integration capabilities strengths in software, to serve all segments and
in production integration, and major markets
manufacturing
Strategic partnerships to
Next generation
further accelerate the Highly integrated product
electric drive system is
development and delivery technology resulting in
positioning us
of scalable, next- improved power density,
for continued
generation 3-in-1 electric value, and efficiency
profitable growth
drive systemsSupplemental Data
Reconciliation of Non-GAAP Measures
In addition to the results reported in accordance with accounting principles generally accepted in the
United States of America (GAAP) included within this presentation, we have provided certain
information, which includes non-GAAP financial measures. Such information is reconciled to its
closest GAAP measure in accordance with Securities and Exchange Commission rules and is
included in the following slides.

Certain of the forward-looking financial measures included in this earnings release are provided on a
non-GAAP basis. A reconciliation of non-GAAP forward-looking financial measures to the most
directly comparable forward-looking financial measures calculated and presented in accordance with
GAAP has been provided. The amounts in these reconciliations are based on our current estimates
and actual results may differ materially from these forward-looking estimates for many reasons,
including potential event driven transactional and other non-core operating items and their related
effects in any future period, the magnitude of which may be significant.

                                                                                                         18
Supplemental Data
EBITDA and Adjusted EBITDA Reconciliation
($ in millions)
Three Months Ended Twelve Months Ended
December 31, December 31,
2020 2019 2020 2019
Net income (loss) $ 36.1 $ (454.4) $ (561.1) $ (484.1)
Interest expense 52.3 53.4 212.3 217.3
Income tax expense (benefit) 13.9 (11.5) (49.2) (48.9)
Depreciation and amortization 128.2 125.4 521.9 536.9
EBITDA 230.5 (287.1) 123.9 221.2
Restructuring and acquisition-related costs 28.6 21.8 67.2 57.8
Debt refinancing and redemption costs 1.2 0.9 7.9 8.4
Impairment charges - 440.0 510.0 665.0
Pension settlement 0.5 9.8 0.5 9.8
Loss on sale of business - 21.3 1.0 21.3
Non-recurring items:
Malvern fire charges, net of recoveries 0.7 - 9.3 -
Gain on bargain purchase of business - (10.8) - (10.8)
Other - (2.4) - (2.4)
Adjusted EBITDA $ 261.5 $ 193.5 $ 719.8 $ 970.3
Sales 1,437.9 1,430.0 4,710.8 6,530.9
as % of net sales 18.2% 13.5% 15.3% 14.9%
19Supplemental Data
Adjusted Earnings Per Share Reconciliation
Three Months Ended Twelve Months Ended
December 31, December 31,
2020 2019 2020 2019
Diluted earnings (loss) per share $ 0.30 $ (4.04) $ (4.96) $ (4.31)
Restructuring and acquisition-related costs 0.24 0.19 0.60 0.51
Debt refinancing and redemption costs 0.01 0.01 0.07 0.07
Loss on sale of business - 0.19 0.01 0.19
Impairment charges - 3.91 4.51 5.92
Pension settlement 0.01 0.09 0.01 0.09
Non-recurring items:
Malvern fire charges, net of recoveries 0.01 - 0.08 -
Gain on bargain purchase of business - (0.10) - (0.10)
Tax adjustments related to the CARES Act and Tax Cuts
- - (0.07) (0.08)
and Jobs Act
Adjustment to liability for unrecognized tax benefits - - (0.06) -
Other - (0.02) 0.14 (0.02)
Tax effect of adjustments (0.06) (0.10) (0.19) (0.60)
Adjustment for anti-dilutive effect - - - (0.05)
Adjusted earnings per share $ 0.51 $ 0.13 $ 0.14 $ 1.62
Adjusted earnings per share are based on weighted average diluted shares outstanding of 118.4 million and 116.2 million for the three months ended on December 31, 2020 and 2019, respectively,
and 117.9 million and 116.1 million for the twelve months ended on December 31, 2020 and 2019, respectively.
20Supplemental Data
Free Cash Flow and Adjusted Free Cash Flow Reconciliation
($ in millions)
Three Months Ended Twelve Months Ended
December 31, December 31,
2020 2019 2020 2019
Net cash provided by operating activities $ 208.3 $ 181.0 $ 454.7 $ 559.6
Less: Capital expenditures net of proceeds from sale of property,
plant and equipment (69.2) (95.0) (213.9) (428.3)
Free cash flow 139.1 86.0 240.8 131.3
Cash payments for restructuring and acquisition-related costs 33.6 30.5 70.6 76.5
Adjusted free cash flow $ 172.7 $ 116.5 $ 311.4 $ 207.8
21Supplemental Data
Net Debt and Net Leverage Ratio
($ in millions)
December 31,
2020
Current portion of long-term debt $ 13.7
Long-term debt, net 3,441.3
Total debt, net 3,455.0
Less: Cash and cash equivalents 557.0
Net debt at end of period 2,898.0
Adjusted LTM EBITDA $ 719.8
Net Leverage Ratio 4.0
22Supplemental Data
Segment Financial Information
($ in millions)
Three Months Ended Twelve Months Ended
December 31, December 31,
2020 2019 2020 2019
Segment Sales
Driveline $ 1,105.7 $ 1,015.6 $ 3,635.6 $ 4,550.2
Metal Forming 433.4 401.2 1,439.2 1,845.2
Casting - 127.5 - 669.2
Total Sales 1,539.1 1,544.3 5,074.8 7,064.6
Intersegment Sales (101.2) (114.3) (364.0) (533.7)
Net External Sales $ 1,437.9 $ 1,430.0 $ 4,710.8 $ 6,530.9
Segment Adjusted EBITDA
Driveline $ 186.2 $ 124.9 $ 501.7 $ 610.8
Metal Forming 75.3 66.2 218.1 316.5
Casting - 2.4 - 43.0
Total Segment Adjusted EBITDA $ 261.5 $ 193.5 $ 719.8 $ 970.3
23Supplemental Data
Full Year 2021 Outlook
($ in millions)
Adjusted EBITDA
Low End High End
Net income $ 80 $ 140
Interest expense 205 205
Income tax expense 20 35
Depreciation and amortization 485 485
Full year 2021 targeted EBITDA 790 865
Restructuring and acquisition-related costs 60 60
Full year 2021 targeted Adjusted EBITDA $ 850 $ 925
Adjusted Free Cash Flow
Low End High End
Net cash provided by operating activities $ 480 $ 580
Capital expenditures net of proceeds from the sale of
(240) (240)
property, plant and equipment
Full year 2021 targeted Free Cash Flow 240 340
Cash payments for restructuring and acquisition-
60 60
related costs
Full year 2021 targeted Adjusted Free Cash Flow $ 300 $ 400
24Definition of Non-GAAP Measures
EBITDA and Adjusted EBITDA
We define EBITDA to be earnings before interest expense, income taxes, depreciation and amortization. Adjusted EBITDA is defined as EBITDA excluding the impact of restructuring and acquisition-
related costs, debt refinancing and redemption costs, loss on sale of a business, impairment charges, pension settlements and non-recurring items. We believe that EBITDA and Adjusted EBITDA are
meaningful measures of performance as they are commonly utilized by management and investors to analyze operating performance and entity valuation. Our management, the investment community and
the banking institutions routinely use EBITDA and Adjusted EBITDA, together with other measures, to measure our operating performance relative to other Tier 1 automotive suppliers. We also use
Segment Adjusted EBITDA as the measure of earnings to assess the performance of each segment and determine the resources to be allocated to the segments. EBITDA and Adjusted EBITDA should not
be construed as income from operations, net income or cash flow from operating activities as determined under GAAP. Other companies may calculate EBITDA and Adjusted EBITDA differently.
Adjusted Earnings (Loss) Per Share
We define Adjusted earnings (loss) per share to be diluted earnings per share excluding the impact of restructuring and acquisition related costs, debt refinancing and redemption costs, loss on sale of a
business, impairment charges, and non-recurring items, including the tax effect thereon. We believe Adjusted earnings (loss) per share is a meaningful measure as it is commonly utilized by management
and investors in assessing ongoing financial performance that provides improved comparability between periods through the exclusion of certain items that management believes are not indicative of core
operating performance and which may obscure underlying business results and trends. Other companies may calculate Adjusted earnings (loss) per share differently.
Free Cash Flow and Adjusted Free Cash Flow
We define free cash flow to be net cash provided by (used in) operating activities less capital expenditures net of proceeds from the sale of property, plant and equipment. Adjusted free cash flow is
defined as free cash flow excluding the impact of cash payments for restructuring and acquisition-related costs. We believe free cash flow and Adjusted free cash flow are meaningful measures as they are
commonly utilized by management and investors to assess our ability to generate cash flow from business operations to repay debt and return capital to our stockholders. Free cash flow and Adjusted free
cash flow are also key metrics used in our calculation of incentive compensation. Other companies may calculate free cash flow and Adjusted free cash flow differently.
Net Debt and Net Leverage Ratio
We define net debt to be total debt, net less cash and cash equivalents. We define Net Leverage Ratio to be net debt divided by the trailing 12 months of Adjusted EBITDA. We believe that Net Leverage
Ratio is a meaningful measure of financial condition as it is commonly used by management, investors and creditors to assess capital structure risk. Other companies may calculate Net Leverage Ratio
differently.
Liquidity
We define Liquidity as cash on hand plus amounts available on our revolving credit facility and foreign credit facilities.
US SAAR
We define US SAAR as the seasonally adjusted annual rate of light vehicle sales in the United States .
Other
Other includes the accelerated depreciation for certain assets that will be idled as a result of our largest customer exiting their operations in Thailand, which they announced in 2020.
25You can also read