Comparisons of vortical flow and cavitation inside a Francis turbine with different draft tubes
←
→
Page content transcription
If your browser does not render page correctly, please read the page content below

IOP Conference Series: Earth and Environmental Science

PAPER • OPEN ACCESS

Comparisons of vortical flow and cavitation inside a Francis turbine with
different draft tubes
To cite this article: Chen Geng et al 2021 IOP Conf. Ser.: Earth Environ. Sci. 774 012146

View the article online for updates and enhancements.

 This content was downloaded from IP address 46.4.80.155 on 14/09/2021 at 04:12
30th IAHR Symposium on Hydraulic Machinery and Systems IOP Publishing
IOP Conf. Series: Earth and Environmental Science 774 (2021) 012146 doi:10.1088/1755-1315/774/1/012146

 Comparisons of vortical flow and cavitation inside a Francis turbine with
 different draft tubes

 Chen Geng1, Ruizhi Zhang1, Yoshinobu Tsujimoto2, Michihiro Nishi3, Xianwu Luo1,*
 1
 State Key Laboratory of Hydro-Science and Engineering, Department of Energy and Power Engineering, Tsinghua
 University, Beijing 100084, China
 2 Graduate School of Engineering Science, Osaka University, Osaka 560-8531, Japan
 3 Department of Mechanical Engineering, Kyushu Institute of Technology, Kitakyushu 804-8550, Japan

*Corresponding author: Tel.: +86 10 62789853, luoxw@mail.tsinghua.edu.cn
Yoshinobu Tsujimoto, tujimoto@me.es.osaka-u.ac.jp
Michihiro Nishi, nishi_michihiro@ybb.ne.jp

Abstract: It is well known that strong pressure fluctuation will occur in the draft tube of a Francis turbine operated
under part-load operation. The pressure fluctuation is usually due to the vortex rope as well as cavitation. However,
the vortical flow and pressure field are dependent on the geometry of draft tube of Francis turbine. In this study,
hydraulic performance and pressure fluctuation have been tested for a model Francis turbine. The internal flow for
the turbine is investigated numerically. It is confirmed that the numerical results predict reasonably the hydraulic
performance and the pressure fluctuation due to vortex rope at part-load operation.
For a better understanding of the vortical flow in the model turbine, a conical draft tube is used instead of the
conventional elbow draft tube. The vorticity transport equation is applied to analyze the vortex evolution inside
Francis turbine based on the unsteady flow simulation. The flow mechanism of the vortex rope and pressure
fluctuation with different draft tubes is discussed. It is shown that both cavitation and the bending structure
influence the vortex rope, which will cause a significant difference in the distribution of pressure fluctuation.

1. Introduction
 Hydropower has the advantage of fast regulation which plays an important role in stabilizing the electric grid.
The Francis turbine has been widely used in hydropower stations for electricity generation. In order to perform the
peak load regulation tasks, it often operates in off-design conditions. When the turbine operates in a part-load
condition, the pressure pulsation happens in the draft tube [1]. Research has shown that the periodic pressure
fluctuation is caused by a strong swirling flow called the vortex rope. Pressure distribution around the vortex core
becomes lower and the cavitation is easier to occur. The harmful noise and vibration during operation are caused
by the low-frequency pressure fluctuation and cavitation. Such phenomena have been investigated until nowadays .
Through experiment and observation, Nishi M and Liu S [2] divided the vortex shape into four regimes according
to different swirl rates. With the development of computational fluid dynamics methods and the improvement of
computing performance, the flow pattern of vortex rope can be simulated and the prediction of the fluctuating
frequency becomes more and more accurate. Ciocan G D et al. [3] compared detailed experimental flow field with
numerical simulations and validated the accuracy of the CFD method for the inner draft tube flow. Krappel T et al.
[4] use the SAS-SST model to analyze the detailed turbulence flow structure in the draft tube. Wack J and
Riedelbauch S [5] simulated the cavitation phenomena at the deep part-load condition. Results showed that
accuracy still needs to improve. Many researchers also focus on the methods to alleviate pressure fluctuation and
the cavitation effect. Nishi M [6] and Miyagawa [7] applied fins on the draft tube to alleviate the fluctuation. Luo
X W [8] used numerical simulation to validate that aeration is helpful for reducing pressure fluctuations. Through
optimization on the runner cone and CFD method, Yu A et al. [9] found that the vortex diameter can be shorted
and the amplitude of pressure fluctuation was reduced. However, the flow characteristics of vortex and cavitation
in different types of draft tubes are seldom compared. In the early years, Nishi M et al. [10] studied the surging
characteristics of conical and elbow-type draft tube, yet the internal flow field wasn’t well explained due to the
lack of CFD method. The non-rotating frequency of pressure fluctuation can occur inside the elbow draft tube
under certain working conditions. In this study, a conical draft tube(CDT) is used instead of the elbow draft tube
(EDT) and the results of the simulation are compared. The difference of flow field is discussed through the vorticity
transport equation and spectrum analysis of pressure fluctuation. A better understanding of its complex mechanism
helps us find efficient ways to alleviate pressure fluctuation and design higher reliable hydraulic machines.

 Content from this work may be used under the terms of the Creative Commons Attribution 3.0 licence. Any further distribution
 of this work must maintain attribution to the author(s) and the title of the work, journal citation and DOI.
Published under licence by IOP Publishing Ltd 1
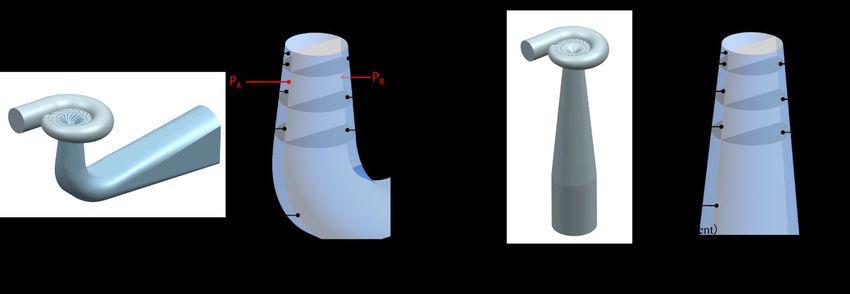
30th IAHR Symposium on Hydraulic Machinery and Systems IOP Publishing IOP Conf. Series: Earth and Environmental Science 774 (2021) 012146 doi:10.1088/1755-1315/774/1/012146 2. Numerical Method 2.1 Governing Equations The flow was assumed to be homogenous and governed by Reynolds-averaged Navier-stokes equations. The equations of continuity and momentum are as follows: ( ui ) 0 (1) xi ( uiu j ) p ui u j ( uiuj ) +fi (2) x j x j x j x j xi x j where uiuj is the Reynolds stress. The standard SST k-ω model was applied to close the equations and the commercial software CFX was used to solve them. For cavitation condition, the Zwart cavitation model [11] which based on the Rayleigh-Plesset equation was used to predict the cavitating flows. The source terms due to vaporization and condensation in the cavitation model are given below: m Ce 3v (1 v ) nuc 2 max( pv p,0) (3) Rb 3 p1 3 v v 2 max( p pv ,0) m C c (4) Rb 3 p1 where the subscripts v and l represent vapor and liquid respectively. Ce and Cc denote two empirical coefficients, whose values are 50 and 0.01 respectively. αnuc is the volume fraction of nucleation sites and the value of 5×10⁻⁴ is used. αv is the vapor volume fraction. 2.2 CFD Model A model Francis turbine with an EDT is tested when head H=30.07m and cavitation number σ = 0.12. The rotating frequency of runner fn is 15.12 Hz. The same geometry is used for numerical simulation including casing, vanes, runner and the draft tube. Some geometry parameters for comparison are shown in Table 1. The CDT is designed to have the same D1, A2, L as the EDT. Both computational domains are shown in Fig. 1. For the comparison of pressure fluctuation with experiments, two symmetrical monitoring points PA and PB were placed on the wall of the EDT. Besides, there are also five monitoring points and three monitoring planes. For EDT, P1 and P2 are close to the inlet of the draft tube. P3 is in the middle of the conical part while P4 is near the end of it. P5 is at the outer side of the elbow. The three monitoring planes locate around the upper, middle and end of the conical part respectively. These points and planes also locate in the same position in the CDT except for P5. It is an equivalent point transforming according to the centerline of the EDT. Fig. 1 Model with EDT (a) and model with CDT (b) 2
30th IAHR Symposium on Hydraulic Machinery and Systems IOP Publishing
IOP Conf. Series: Earth and Environmental Science 774 (2021) 012146 doi:10.1088/1755-1315/774/1/012146

 Table 1 Structural parameters of model turbine
 Parameters Value
 Runner diameter, Dr 0.420m
 Inlet diameter of draft tube, D1 0.359m
 Conical angle 5.395°
 Outlet area of draft tube, A2 0.574m2
 Length of draft tube centerline, L 3.726m

2.3 Numerical Setup
 The hexahedral mesh was used to discretize the fluid domain. After the validation of mesh independence, the
mesh information of different parts is listed in Table 2. The boundary conditions are total pressure inlet and static
pressure outlet. The inlet pressure data was measured from the experiment and the outlet pressure was calculated
according to σ. The upwind advection scheme and high-resolution turbulence numeric were chosen for
computation. The residual was set as 1×10⁻⁶ in non-cavitation condition (σ=0.12) and 1×10⁻⁵ in cavitation
condition at (σ=0.04). For unsteady state simulation, the time step was firstly set as 0.001102s(runner rotating 6
degrees) until convergence and 0.000551s for getting detailed results.

 Table 2 Mesh information
 Domain Nodes Elements
 Casing 392103 375651
 Stay vane 345120 304590
 Guide vane 246528 211320
 Runner 1104796 1041147
 Elbow draft tube & Extension 1579800 1447330
 Conical drat tube & Extension 1297572 1273220

3. Results and Discussion
3.1 Validation of CFD Results
 After the calculation, the time-averaged flow rate q and hydraulic efficiency η are listed in Table 3. The
simulation results of the EDT with σ = 0.12 agree well with the experimental data. The internal flow field can be
predicted using the simulation. Table 3 also shows the comparison of pressure fluctuation data between simulation
and experiment in EDT. f1 is the main frequency of the pressure fluctuation and Amp. is short for the normalized
amplitude which can be calculated through Δp/ρgH. The error also within a relatively small range, proving that
the simulation model can well predict the pressure fluctuation.

 Table 3 Validation of hydraulic performance and pressure fluctuation
 PA PB
 q (L/s) η (%)
 f1/fn Amp.(%) f1/fn Amp.(%)
 Exp. 266.1 91.05 0.204 0.59 0.204 0.73
 Sim. 284.1 94.37 0.200 0.62 0.200 0.66
 Error 6.8% 3.6% 2.0 % 5.1 % 2.0 % 9.6 %

 Table 4 compares the hydraulic performance between turbines with the EDT and CDT. The CFD results show
that the efficiency drops a little for both model in cavitation condition. For turbine with the CDT, the efficiency
and flow rate are lower compared to the turbine with the EDT.

 3
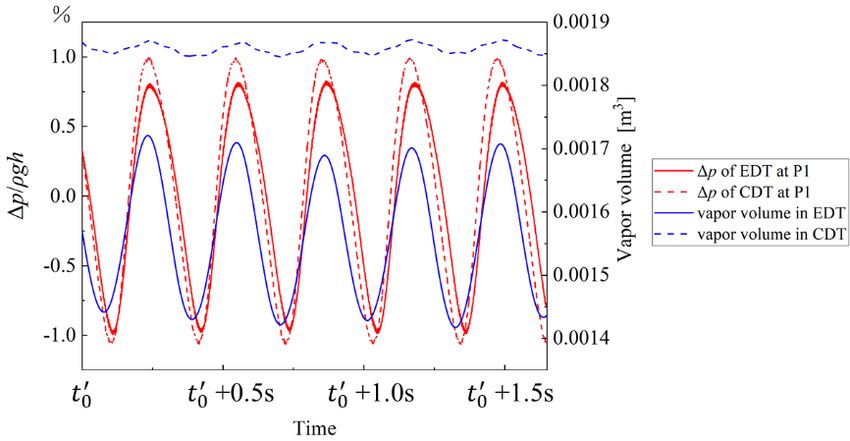
30th IAHR Symposium on Hydraulic Machinery and Systems IOP Publishing
IOP Conf. Series: Earth and Environmental Science 774 (2021) 012146 doi:10.1088/1755-1315/774/1/012146

 Table 4 Comparison of hydraulic performance
 EDT CDT
 σ = 0.12 σ = 0.04 σ = 0.12 σ = 0.04
 q (L/s) 284.1 284.0 280.9 282.6
 η (%) 94.37 94.26 90.57 90.23

3.2 Comparison of Vortex Ropes and Cavitation
 In Fig. 2, the vortex ropes rotating clockwise in different cases are showed by the Q-criterion. The cavitation
ropes formed by the water vapor are represented by an iso-surface with a water volume fraction of 0.1. They are
in the upper part of the vortex ropes where the pressure is the lowest. t0 and 0′ are the initial time. The time
interval ΔT is T/5. It is clear that the shape of vortex rope in the CDT is more stable during the precession
movement while the tail of the vortex rope in the EDT is disturbed by the bend structure. The vortex rope is
stretched in the vertical direction when rotating from the inner side of the elbow to the outer side, and the tail
breaks as it rotates from the outer side to the inner side. After one period, the vortex rope cannot change back to
the previous shape as Fig. 2(a) shows.
 As for cavitation rope in two different types of draft tubes, their shapes are basically the same except it can
grow a bit longer in the CDT. The specific vapor volume changing with time was given in Fig. 3. The average
vapor volume in the CDT is higher than that in the EDT, and it changes with the pressure fluctuations. The CDT
could mitigate the fluctuation in the vapor volume. By observing the fluctuation of P1, it can be found that the
amplitude and frequency are higher in the CDT.

 Fig. 2 The shape of vortex rope and cavitation rope in different cases

 Fig. 3 Comparison of pressure fluctuation at P1 and vapor volume (σ = 0.04)

 The movement of the vortex rope and its interaction with cavitation could be further explained by the
following vorticity transport equation:

 4
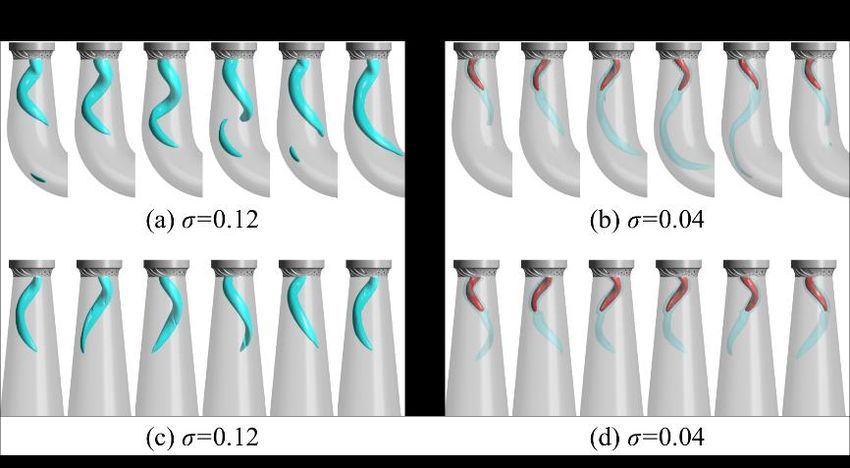
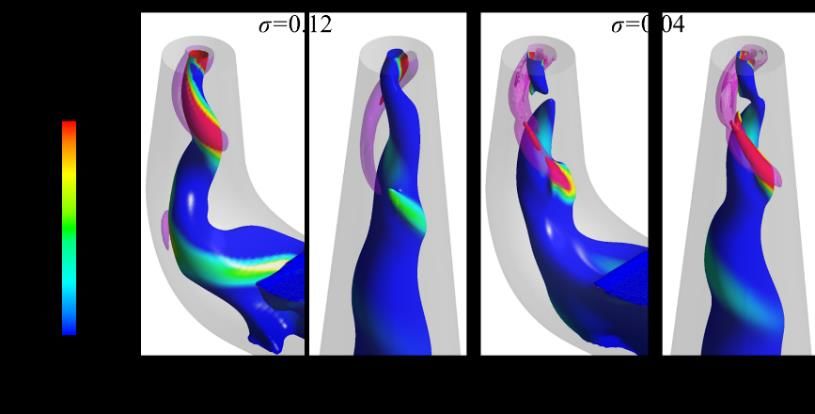
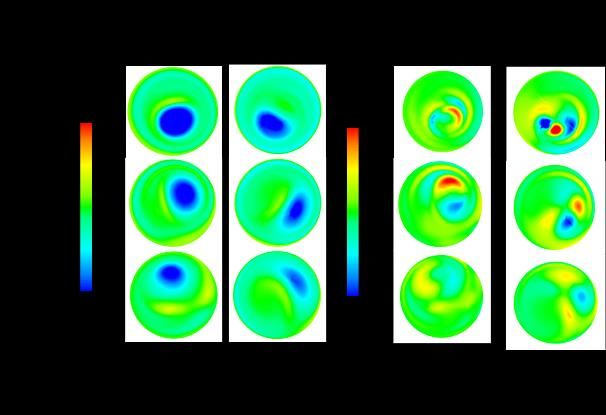
30th IAHR Symposium on Hydraulic Machinery and Systems IOP Publishing IOP Conf. Series: Earth and Environmental Science 774 (2021) 012146 doi:10.1088/1755-1315/774/1/012146 D m p ( )V ( V ) ( 2 ) Dt m2 In the equation, the first term is the vortex stretching term indicating how much the vortex is stretched or tilted by the velocity gradient. The second term is the vortex dilation term caused by expansion or contraction of the fluid. The third term is the baroclinic torque term generated from density gradient and misaligned pressure. The last term describes the vorticity changing rate due to viscous diffusion. This term is negligible compared to the first three terms. Because there is no phase change in the non-cavitation condition, the vortex dilation term and the baroclinic torque term are ideally zero. Thus the comparison of vorticity and the vortex stretching term between two draft tubes is shown in Fig. 4. From The high absolute value area of vorticity in the EDT is larger than the CDT. There are obvious differences in vortex stretching term distribution. A pair of high-value regions are very close in the CDT while the same regions expand in the EDT. As for cavitation conditions, Fig. 5 indicates that the vortex characteristics are the same in two different draft tubes except the high value extends further to downstream in the CDT. Because of the cavitation in the core, the vortex dilation and baroclinic torque terms contribute large vorticity change around the phase-changing area as shown in (c) and (d). From Fig. 5(b), the vortex stretching term is still the dominant component in the vorticity changing rate. Fig. 4 Comparison of vorticity in z-direction and the vortex stretching term (σ = 0.12) Fig. 5 Comparison of vorticity in z-direction and the terms of vorticity changing rate (σ = 0.04) Fig. 6 Interaction between vortex ropes and the backflow region 5
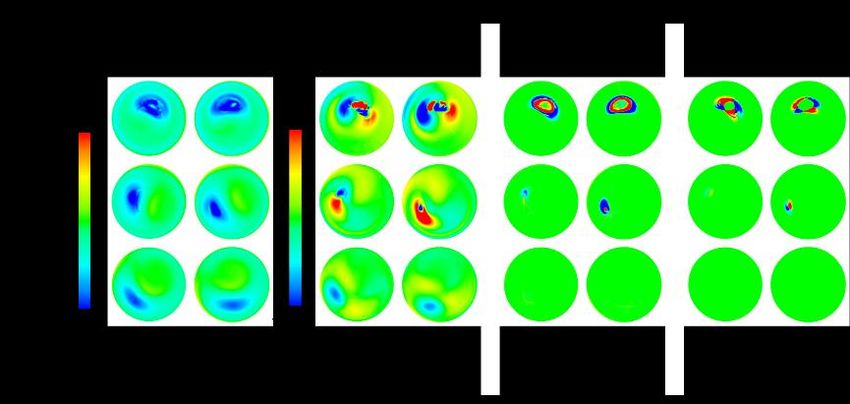
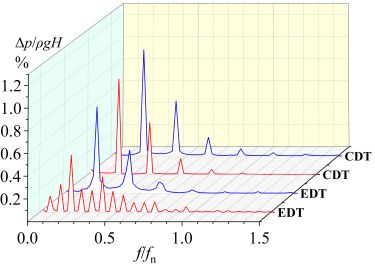
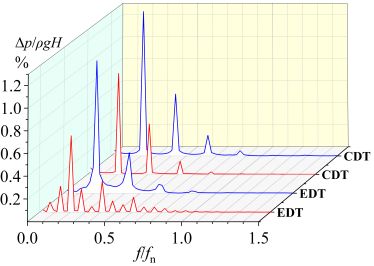
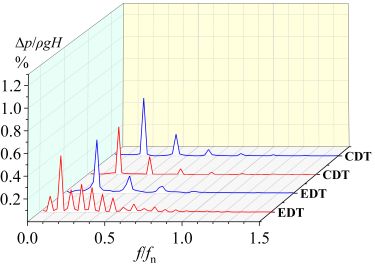
30th IAHR Symposium on Hydraulic Machinery and Systems IOP Publishing
IOP Conf. Series: Earth and Environmental Science 774 (2021) 012146 doi:10.1088/1755-1315/774/1/012146

 The interaction between the vortex rope (transparent purple isosurface) and the backflow region (isosurface
with w=0) is shown in Fig. 6. Though the similarity can be observed from the figure, there are differences in all
four cases. For the CDT, the backflow region is pulled up by the tail of the vortex rope in (b). From (d), the vortex
rope becomes longer enough to suck the water from the backflow region. However, the cavitation vapor prevents
the backflow from going upstream.
 In the EDT, the bent structure helps the backflow enter the vortex rope when it rotates from the outer side to
the inner side of the elbow. Thus in Fig. 6(a), the vortex rope in the EDT can suck water from the backflow region
continuously without the blockage of cavitation shown in Fig. 6(c). As a result, the vortex rope and the backflow
region entangle with each other. The vortex rope transports energy to the backflow and breaks periodically, which
in turn changes its own rotation pattern.
3.3 Analysis of Pressure Fluctuation
 The pressure fluctuation frequency was acquired from FFT. Fig. 7 shows a comparison of the results from P1
to P5. The main frequency f1 of pressure fluctuation and the corresponding amplitude is listed in Table 5, which is
the rotational frequency of the vortex rope. Through comparison, it can be found that f1 and its harmonic
frequencies are basically the same at σ = 0.04. As for the amplitude of f1, the value in the CDT is always higher
than that in the EDT. The maximum value of f1 appears at P3 for all cases. When σ = 0.12, the frequency distribution
is different in the EDT. Although f1 is still the same at first four points, it has shifted to the two-thirds of its own
frequency. This change can be explained based on the previous analysis of the vortex rope. It has both precession
movement and telescopic movement. The pressure fluctuation in the vertical direction is larger at P5 so the main
pressure fluctuation will change to the vertical direction. The one-third and two-thirds of f1 are related to the
vertical fluctuation in pressure field. However, their relationships and the exact formation process need to be
further investigated.

 P1 P2 P3

 P4 P5
 —— σ = 0.12 —— σ = 0.04
 Fig. 7 Spectrogram of pressure fluctuation in different cases

 Table 5 Main frequency of pressure fluctuation and amplitude from simulation
 P1 P2 P3 P4 P5
 σ
 f/fn Amp. f/fn Amp. f/fn Amp. f/fn Amp. f/fn Amp.
 0.12 0.204 0.750 0.204 0.640 0.204 0.676 0.204 0.504 0.136 0.499
 EDT
 0.04 0.215 0.805 0.215 0.865 0.215 1.181 0.215 0.770 0.215 0.475
 0.12 0.205 0.850 0.204 0.838 0.204 0.907 0.203 0.857 0.204 0.427
 CDT
 0.04 0.214 0.986 0.214 1.021 0.214 1.306 0.214 0.960 0.214 0.522

 6
30th IAHR Symposium on Hydraulic Machinery and Systems IOP Publishing
IOP Conf. Series: Earth and Environmental Science 774 (2021) 012146 doi:10.1088/1755-1315/774/1/012146

4. Concluding Remarks
 In this paper, The RANS simulation was conducted on the Francis turbine with two different draft tubes at the
part-load condition. The vortical flow in the draft tube has been compared using the vortex transportation equation
and Q-criterion. Through spectrum analysis, the pressure fluctuation in different cases is also discussed. The
conclusions are as follows:
1. The main frequency f1 of pressure fluctuation in the conical draft tube is consistent with the elbow draft tube.
 The conical draft tube only has f1 and its harmonic frequency while the later also has 1/3 and 2/3 frequency of
 f1 and their harmonic frequencies.
2. At cavitation condition, the vapor volume of the conical draft tube is larger than the elbow draft tube while its
 fluctuation is lower than the latter.
3. Both cavitation and the bending influence the interaction between the vortex rope and the backflow region.
 The cavitation rope suppresses the flow from reaching upstream. The elbow can help enlarge the backflow
 region periodically near the tail of the vortex rope. It can make the vortex entangle with the backflow totally
 in certain conditions. The extension and contraction of the vortex rope in the vertical direction causes the
 occurrence of non-rotational frequencies.

Acknowledgments
This work was financially supported by the Tsinghua National Laboratory for Information Science and Technology.

Nomenclature
 H Head of the Francis turbine [m] q Flow rate [L/s]
 η Hydraulic efficiency σ Cavitation number
 Dr Runner diameter [m] D1 Inlet diameter of draft tube [m]
 A2 Area of draft tube outlet [m2] L Length of draft tube centerline [m]
 μ Dynamic viscosity [Pa·s] υ Kinematic viscosity [m2/s]
 f1 Main frequency of pressure fluctuation [Hz] fn Runner frequency [Hz]
 ω Vorticity [1/s] ρm The mixed density [kg/m3]
 Δp Pressure deviation from average value [Pa]

References
[1] Nishi M, Kubota T, Matsunaga S and Senoo Y 1982 Study on Swirl Flow and Surge in an Elbow Type Draft
Tube Trans. Japan Soc. Mech. Eng. Ser. B 48 1238–46
[2] Nishi M and Liu S 2013 An Outlook on the Draft Tube Surge Study Int. J. Fluid Mach. Syst. 6 33–48
[3] Ciocan G D, Iliescu M S, Vu T C, Nennemann B and Avellan F 2007 Experimental Study and Numerical
Simulation of the FLINDT Draft Tube Rotating Vortex J. Fluids Eng. Trans. ASME 129 146–58
[4] Krappel T, Riedelbauch S, Jester-Zuerker R, Jung A, Flurl B, Unger F and Galpin P 2016 Turbulence Resolving
Flow Simulations of a Francis Turbine in Part Load using Highly Parallel CFD Simulations IOP Conf. Ser. Earth
Environ. Sci. 49
[5] Wack J and Riedelbauch S 2015 Numerical Simulations of the Cavitation Phenomena in a Francis Turbine at
Deep Part Load Conditions J. Phys. Conf. Ser. 656
[6] Nishi M, Kawai K, Yoshida K, Ma Z and Qian H 1999 Installation of a Fin as a Means to Alleviate the Draft
Tube Surging Proc. 3rd ASME/JSME Jt. Fluids Eng. Conf. FEDSM99. 7209
[7] Miyagawa K 2003 Mitigation of Draft Tube Flow Instability with Auxiliary Parts in High Head Pump-turbines
23th IAHR Symp. 1 1–10
[8] Luo X W, Yu A, Ji B, Wu Y and Tsujimoto Y 2017 Unsteady Vortical Flow Simulation in a Francis Turbine
with Special Emphasis on Vortex Rope Behavior and Pressure Fluctuation Alleviation Proc. Inst. Mech. Eng. Part
A J. Power Energy 231 215–26
[9] Yu A, Zhou D and Chen H 2019 Numerical Investigation of the Behaviour of the Cavitation Rope in a Francis
Turbine with an Optimized Runner Cone IOP Conf. Ser. Earth Environ. Sci. 240

 7
30th IAHR Symposium on Hydraulic Machinery and Systems IOP Publishing
IOP Conf. Series: Earth and Environmental Science 774 (2021) 012146 doi:10.1088/1755-1315/774/1/012146

[10] Nishi M, Matsunaga S, Kubota T and Senoo Y 1984 Surging Characteristics of Conical and Elbow-type Draft
Tubes. 12th IAHR Conf. 272-283
[11] Zwart P J, Gerber A G and Belamri T 2004 A Two-phase Flow Model for Predicting Cavitation Dynamics Int.
Conf. Multiph. Flow 152

 8
You can also read