Automativ assessment of systolic cardiac performance using PEP/LVET index
←
→
Page content transcription
If your browser does not render page correctly, please read the page content below
IOP Conference Series: Materials Science and Engineering

PAPER • OPEN ACCESS

Automativ assessment of systolic cardiac performance using PEP/LVET
index
To cite this article: A Mohamed Sameh et al 2021 IOP Conf. Ser.: Mater. Sci. Eng. 1051 012017

View the article online for updates and enhancements.

                              This content was downloaded from IP address 46.4.80.155 on 01/09/2021 at 06:46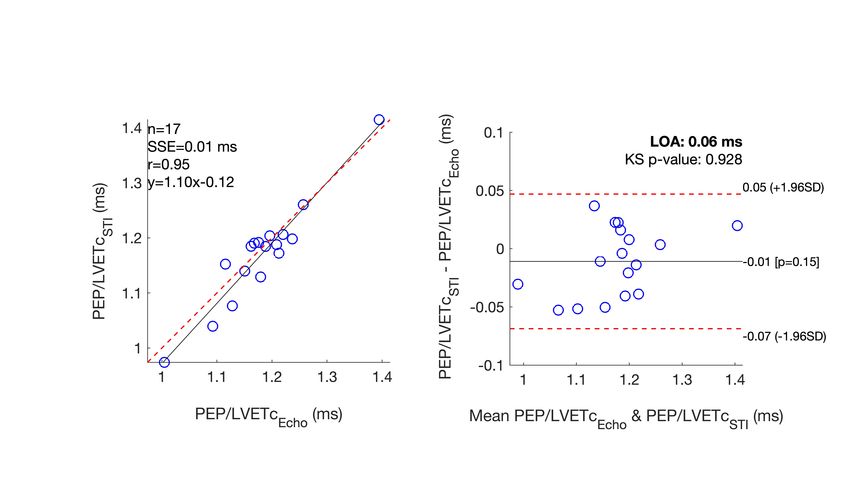
ICATAS-MJJIC 2020                                                                                                        IOP Publishing
IOP Conf. Series: Materials Science and Engineering              1051 (2021) 012017           doi:10.1088/1757-899X/1051/1/012017

  Automativ assessment of systolic cardiac performance
  using PEP/LVET index

                       A Mohamed Sameh1, M A Abbas2*, M Hazem3, and M H. Abd Elazeem1
                       1
                         Electronics and Communication Dept., Arab Academy for Science,
                       Technology and Maritime Transport.
                       2
                         Biomedical Engineering Dept., Military Technical College.
                       3
                         Cardiology Dept., El-Galaa Family Armed Forces Hospital Cairo, Egypt.

                       *Corresponding author: abbassma@mtc.edu.eg

                       Abstract. Congestive cardiac failure is one of the deadliest diseases in the world, with
                       more than 26 million patients. Echocardiogram and angiography consider as the gold
                       standards for heart failure diagnosis. Nevertheless, they are not commonly used for long-
                       term follow up as they need highly skilled and experienced operator. In this paper, a simple
                       and low-cost system for automatic assessment of systolic cardiac performance using
                       systolic cardiac intervals is presented. The proposed system utilized electrocardiogram
                       (ECG) and phonocardiogram (PCG) to calculate pre-ejection period (PEP) and left
                       ventricle ejection time (LVET). The ratio between PEP and LVET was computed to assess
                       the performance of the systolic cardiac function. ECG and PCG were acquired using a
                       commercial stethoscope which was modified to convert PCG auscultation to electrical
                       signals. ECG and PCG signals were digitized and transferred to a personal computer. A
                       custom MATLAB application was designed to display the acquired ECG and PCG, and to
                       compute PEP, LVET, and PEP/LVET ratio. The system was tested on 17 healthy subjects
                       and results showed high agreement between the systolic heart function status assessed by
                       the proposed system and the corresponding echocardiography results. These results imply
                       that the proposed system could be used for long-term follow up for patients with
                       congestive heart failure.

  1. Introduction
  Congestive heart failure due to coronary artery disease or hypertension is affecting more than 26
  million adults [1]. In Middle East, coronary artery disease is the major risk factor for heart failure [2].
  Heart failure due to cardiac muscle dysfunction can be assessed by measuring systolic time intervals [3,
  4]. Systolic time intervals including aortic pre-ejection period (PEP), defined as the time interval
  between the onset of left ventricle depolarization (i.e. onset of Q-wave or R-wave [5] on
  electrocardiogram) and aortic valve opening (i.e. peak of the first heart sound (S1) on the
  phonocardiogram), and left ventricle ejection time (LVET), defined as the period between the opening
  of aortic valve and its closure times (i.e. the peak of S1 and the negative peak of the second heart
  sound (S2)) [6]. Using the ratio between PEP and LVET (PEP/LVET index), healthy and unhealthy

              Content from this work may be used under the terms of the Creative Commons Attribution 3.0 licence. Any further distribution
              of this work must maintain attribution to the author(s) and the title of the work, journal citation and DOI.
Published under licence by IOP Publishing Ltd                          1
ICATAS-MJJIC 2020                                                                               IOP Publishing
IOP Conf. Series: Materials Science and Engineering   1051 (2021) 012017   doi:10.1088/1757-899X/1051/1/012017

 cardiac muscles can be discriminated [7]. Normal ventricle exhibits longer LVET and shorter PEP
 than abnormal ventricle [6].
     Echocardiography is considered the gold standard for systolic cardiac dysfunction
 assessment [3, 8]. In echocardiograph, PEP/LVET ratio can be measured accurately using
 simultaneous recording of cardiac mechanical and electrical activity using M-mode and
 electrocardiograph (ECG), respectively [3]. However, its usage is limited by cost and complexity as
 it requires highly trained and experienced physicians. Other methods for measuring systolic time
 intervals using simultaneous acquisition of ECG, phonocardiogram (PCG) [9, 10] or carotid arterial
 pulse tracings [11] were proposed to provide initial judgment of patient heart health. However,
 these approaches relied on manual and non-real time computations.
     In this paper, a real-time automated system for evaluating systolic cardiac function is
 presented. The proposed system acquires ECG and PCG signals for each patient then systolic
 cardiac intervals, particularly PEP and LVET, are calculated. The designed system consisted of
 a commercial digital stethoscope, signal conditioning and acquisition circuits (for PCG and ECG),
 and a custom MATLAB program to automatically measure PEP, LVET, and PEP/LVET index.
 The ultimate goal of this work is to implement a compact cardiac assessment system, that could
 be used by patients who suffers from congestive heart failure for long-term follow-up.

 2. Methods
 In this section the overall design of the proposed system and the experiments are discussed in
 detail. Block diagram of the proposed system is shown in Fig.1.

                                  Figure 1. Proposed system block diagram

 2.1. Experiments
 Seventeen healthy subjects (N = 17), all male, with average age of 26.41 ± 4.7 years and
 body mass index of 25.58 ± 1.9 Kg/m2 were enrolled in the experiments conducted in El-Galaa
 Family Armed Forces Hospital. All subjects had to agree on a verbal consent before starting the
 experiments. For each subject, systolic time intervals, including PEP, LVET, and PEP/LVET
 index were measured using the proposed system and echocardiography.

 2.2. Echocardiography
 Echocardiography was employed using Echo VIVED e95 (GE medical system, Horten, Norway) with

                                                         2
ICATAS-MJJIC 2020                                                                                 IOP Publishing
IOP Conf. Series: Materials Science and Engineering   1051 (2021) 012017     doi:10.1088/1757-899X/1051/1/012017

 M5Sc-D sector transducer (1.4 − 4.6 MHz, 120◦ field of view, and 30 cm depth) incorporated with
 three ECG electrodes. Each subject was laid in his left lateral position with his left arm placed behind
 his head. The transducer was positioned by the cardiologist along the parasternal long-axis view. The
 ultrasound scanner was adjusted to the pulsed Doppler mode. The sweep speed was adjusted to 66.67
 mm/s. ECG electrodes were connected in the same configuration as the proposed system to extract
 ECG signal of Lead I. According to the pulsed Doppler images, PEP and LVET were measured for
 each subject.

 2.3. The Proposed system
 2.3.1. Signals extraction and acquisition Signals extraction was carried out using a commercial digital
 stethoscope, which provided one lead ECG (Lead I) and mechanical heart sound signals. Heart
 sound signals were converted to electrical signal and processed using commercial microphone breakout
 circuit. Extracted ECG and PCG signals were digitized using 10-bit analog-to-digital converter
 and stored on 2 GB secure digital (SD) memory card with sampling rate of 782 Hz. Stored signals
 were transmitted to a personal computer connected to the acquisition circuit using serial
 communication (RS232 protocol 8N1-baud rate 115200 bps) for further processing.

 2.3.2. Automatic calculation of systolic cardiac intervals A custom MATLAB program was
 implemented to retrieve stored ECG and PCG signals from the acquisition circuit through serial
 communication interface. Retrieved ECG and PCG signals were band-pass filtered from 10 to 20 Hz and
 30 to 150 Hz [10], respectively. Both filtered signals were normalized. For the normalized ECG signal,
 QRS-complex was detected using Pan-Tompkins detection algorithm [12] using MATLAB [13].
 Normalized PCG signal was smoothed using Savitzky-Golay filtering to mitigate the high-frequency
 noises in the signal [14, 15]. Hilbert transform was employed to get the envelope of the smoothed
 PCG signal. Then, the peak of S1 (i.e. first positive peak) was annotated within 50 ms from the
 onset of the annotated R-wave. Peak of S2 was annotated by searching for the first negative peak
 within 250 ms form S1. Finally, PEP and LVET values were calculated based on the annotated R-
 wave, S1, and S2 signals for all detected R peaks for each subject. For each subject, PEP and LVET
 values were averaged and the PEP/LVET index was calculated. The flow chart of the algorithm used
 for the proposed system to calculate the PEP/LVET index is shown in Fig.2.

 2.4. Statistical analysis
 Mean and standard deviation values for PEP, LVET, and PEP/LVET index were calculated for all
 subjects tested by either echocardiography or the proposed system.
    A post hoc analysis for correcting the calculated PEP, LVET, and PEP/LVET index was carried
 out using the heart-rate (HR) and QRS-complex time width (WQRS) measured for each subject [3], as
 shown in Eq. (1)-Eq. (3). Heart-rate was calculated by inverting the time interval measured between
 two successive R-peaks detected by the algorithm and multiplied by 60 to get the HR in beat per
 minute (bpm) units. QRS-complex time width was measured for each detected R-peak. Mean and
 standard deviation values for HR and WQRS were calculated for all subjects.

             PEPc = 0.46 × WQRS + PEP                                  (1)
             LVETc = 1.5 × HR + LVET                                   (2)
             PEP/LVETc = 0.017 × W QRS + PEP/LVET                      (3)

     Correlation analyses between uncorrected and corrected systolic time intervals (i.e. PEP, LVET,
 PEP/LVET index), measured by either the proposed system or echocardiography, were carried out
 using Pearson-test [16]. Also, correlation analyses between uncorrected and corrected systolic time
 intervals, and HR or WQRS were studied.

                                                         3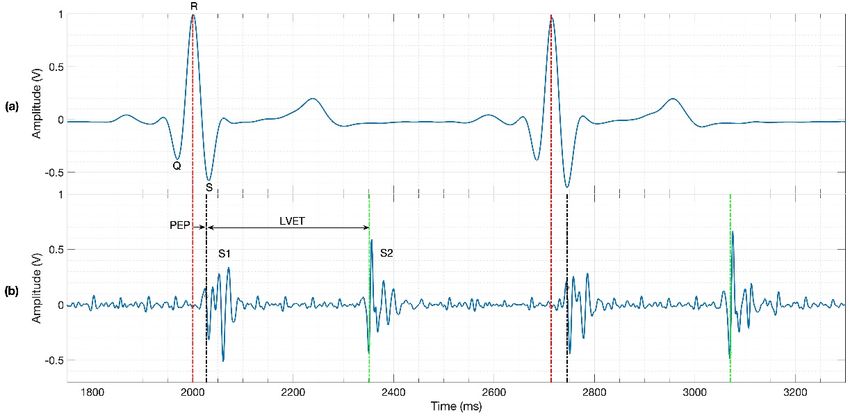
ICATAS-MJJIC 2020                                                                                IOP Publishing
IOP Conf. Series: Materials Science and Engineering   1051 (2021) 012017    doi:10.1088/1757-899X/1051/1/012017

    To assess the comparability between echocardiography and the proposed system, Bland-Altman
 (BA) analysis [17, 18] was employed for both uncorrected and corrected PEP/LVET index. The
 normality of data differences was tested using Shapiro-Wilk test [19] with the significance criterion
 p < 0.05. Also, the intervals of agreement between the two methods were defined as the region where
 95% of the data points should lie within ±2σ of the mean difference (i.e. where σ is the standard
 deviation).

                                     Figure 2. Proposed system flow chart

 3. Results
 All subjects were investigated using both modalities to measure the systolic time intervals. Figure
 3 shows a representative echocardiograph image for a subject under test. PEP and LVET were
 measured manually by an expert.
    Figure 4 shows acquired and processed ECG and PCG signals for the same subject using the
 proposed system. The R-peak, S1, and S2 events were annotated on the ECG and PCG signals to
 determine the PEP and LVET time intervals. PEP and LVET values were calculated automatically
 in real time using the algorithm implemented and the PEP/LVET index was computed.
    For all subjects investigated by echocardiography, the mean ± standard deviation for PEP was
 34.88±4.09 ms, for LVET was 285.71±22.67 ms, and for PEP/LVET index was 0.12±0.02. However,
 for all subjects investigated by the proposed system, the mean ± standard deviation for PEP was
 35.18±8.38 ms, for LVET was 315.38±23.12 ms, and for PEP/LVET index was 0.11±0.03. Whereas,
 the mean ± standard deviation for HR and QRS-complex time width was 69.83±12.4 bpm and
 62.29±4.92 ms, respectively.
    For all subjects investigated by echocardiography, the mean ± standard deviation for corrected
 PEP (PEPc) was 63.53±4.27 ms, for corrected LVET (LVETc) was 390.44±19.37 ms, and for
 corrected PEP/LVET (PEP/LVETc) index was 1.18±0.08. However, for all subjects investigated by
 the proposed system, the mean ± standard deviation for PEPc was 63.83±9.29 ms, for LVETc was

                                                         4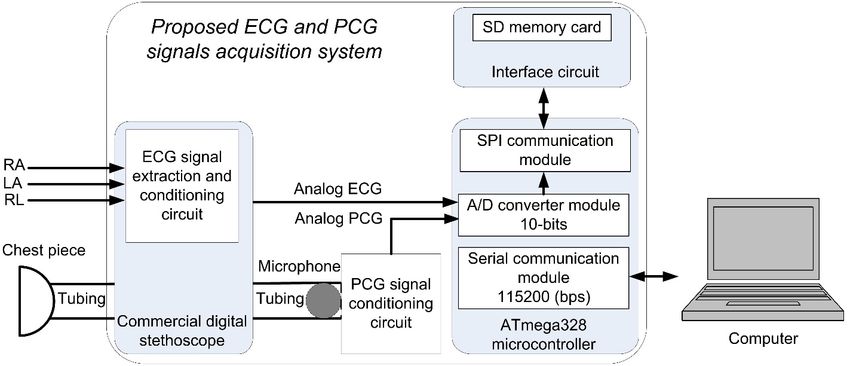
ICATAS-MJJIC 2020                                                                               IOP Publishing
IOP Conf. Series: Materials Science and Engineering   1051 (2021) 012017   doi:10.1088/1757-899X/1051/1/012017

 420.13±24.48 ms, and for PEP/LVETc index was 1.17±0.09.

               Figure 3. Representative pulsed Doppler image showing the PEP and LVET
               time intervals

           Figure 4. Representative ECG and PCG signals showing the PEP and LVET time
           intervals

                                                         5
ICATAS-MJJIC 2020 IOP Publishing
IOP Conf. Series: Materials Science and Engineering 1051 (2021) 012017 doi:10.1088/1757-899X/1051/1/012017
Table 1. Representative results of the correlation analyses between the proposed system and corrected
PEP, LVET, and PEP/LVET index. [r (p-value)]
PEPc LVETc PEP/LVETc
WQRS 0.51(0.03) −0.06(0.83) 0.96(8.7
×10−10)
HR −0.24(0.34) 0.45(0.06) −0.25(0.33)
Correlation analyses between PEP, LVET, and PEP/LVET index measured by the proposed system
and echocardiography showed no significant relevance between the two methods (r < 0.4, p > 0.1). For
corrected PEP and LVET data, no significant correlation showed between the two methods (r < 0.3, p
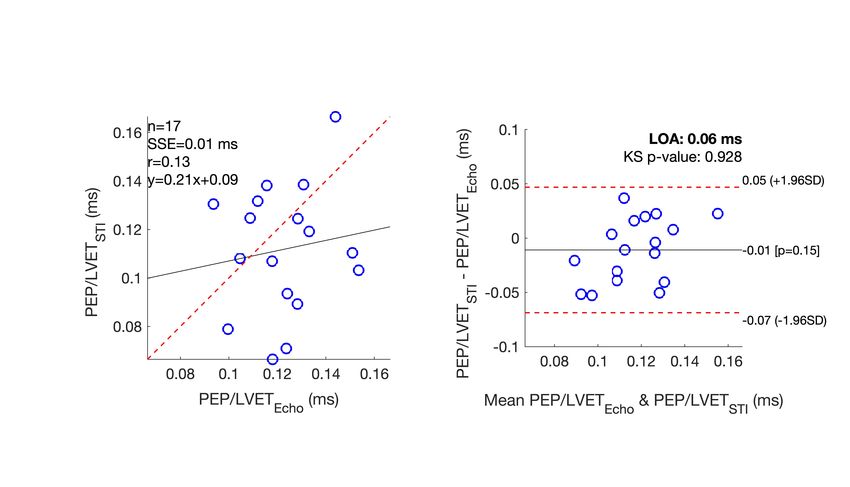
> 0.2), whereas, corrected PEP/LVET index showed high significant correlation between the two
methods (r = 0.95, p = 3.73 ×10⁻⁹) as shown in Fig.6.
Correlation analyses between uncorrected PEP, LVET, and PEP/LVET index, measured by the
proposed system, and WQRS showed insignificant low correlation (r < 0.3, p > 0.2), whereas, high
significant correlation was found after correction for PEP/LVET index only (r = 0.96, p = 8.74 ×
10−10). However, no significant correlation found between either corrected and uncorrected PEP,
LVET, and PEP/LVET index and HR. Significantly correlated data is shown in Table. 1.
Correlation analyses between uncorrected PEP, LVET, and PEP/LVET index, measured by
echocardiography, and WQRS showed insignificant (p > 0.3) low correlation, r = −0.2, r = 0.12, and r =
−0.24 respectively, whereas, high significant correlation was found after correction for PEP/LVET index
only (r = 0.98, p = 7.59×10⁻¹² ). For correlation analysis between uncorrected LVET and HR,
significant relevance was found with r = −0.57 and p = 0.016. However, no significant correlation
found between either corrected and uncorrected PEP and PEP/LVET index and HR.
The differences between PEP/LVET index data, measured by the proposed system and
echocardiography, passed Shapiro-Wilk test for normality with significance criterion equal to p =
0.696. Results of BA analysis showed that the PEP/LVET index values, automatically calculated
by the proposed system (i.e. PEPSTI), may be 0.07 below or 0.05 above the PEP/LVET index values
measured by echocardiography as shown in Fig.5 and Fig.6.
4. Discussion
In this paper, a real-time automated system for evaluating systolic cardiac function was presented.
The gold standard (i.e. Echocardiography) for congestive cardiac assessment was compared to our
proposed system on clinical trials (N = 17) conducted in EL-Galaa Armed Forces Hospital. The
proposed method showed acceptable performance as an initial indicator for heart health.
The proposed system was able to acquire and transfer ECG and PCG signals in real time to a
computer for processing and for calculating systolic time intervals automatically. Echocardiograph
images were hard to acquire and required a highly skilled person. Also, it was time consuming and
not comfortable for the patient. That is why a simple method for heart health assessment is highly
needed with high accuracy. Also, the proposed method can be developed to be portable (i.e. smaller size)
and all the signal processing can be implemented on a chip. So, the patient would be able to use it
anywhere.
The two methods showed no correlation between the measured PEP, LVET, and PEP/LVET index
data signals. One reason could be the difficulty of acquiring ECG and PCG signals from obese
and hairy subjects. Also, that may be a reason for the low correlation between the calculated PEP/LVET
index for the two methods as shown in Fig.5. After correcting data acquired by both methods using
HR and WQRS, significant correlation was found for the PEP/LVET index. Although, correcting the
PEP/LVET index enhanced the correlation between the two methods significantly, it didn’t affect the
6ICATAS-MJJIC 2020 IOP Publishing
IOP Conf. Series: Materials Science and Engineering 1051 (2021) 012017 doi:10.1088/1757-899X/1051/1/012017
BA analysis as shown in Fig.5 and Fig.6.
The PEP, LVET, and PEP/LVET index data calculated by the proposed system, showed no
significant correlation with HR, even after correction. Similarly, results of the same analysis with
WQRS showed no significant correlation between all calculated data. However, only PEP/LVET
index showed significantly high correlation after correction. For the data calculated by echocardiography,
significant correlation was found between uncorrected PEP and HR. While no significant correlation was
found between the rest of uncorrected or corrected data and HR. Similarly, results for WQRS showed
no significant correlation for all calculated uncorrected or corrected data, except for the corrected
PEP/LVET index.
Figure 5. Plot of the correlation between PEP/LVET index measured by the proposed system and
echocardiography (Left). Plot of differences between the proposed system and echocardiography
vs. the mean of the two measurements for PEP/LVET index (Right). Where r, SSE, y, and KS
are coefficient of correlation, sum of squared errors, linear regression equation, and Kolmogorov-
Smirnov test, respectively.
7ICATAS-MJJIC 2020 IOP Publishing
IOP Conf. Series: Materials Science and Engineering 1051 (2021) 012017 doi:10.1088/1757-899X/1051/1/012017
Figure 6. Plot of the correlation between the corrected PEP/LVET index measured by
the proposed system and echocardiography (Left). Plot of differences between the
proposed system and echocardiography vs. the mean of the two measurements for the
corrected PEP/LVET index (Right).
The study was limited by the population under investigation and the BMI. In the future, enrolling
patients with heart failure history will be essential.
5. Conclusion
In this paper a real-time automatic system for systolic cardiac assessment was proposed. PEP and
LVET time intervals for a group of healthy subjects were measured using the system and compared
with echocardiography. Results showed high agreement between the proposed system and the gold-
standard. These results imply that the proposed system could be potentially used for long-term follow
up for patients with congestive heart failure.
Acknowledgment
Authors would like to thank all volunteers who participated in this research. Also, we would like to
thank the staff of the Biomedical Engineering and Cardiology departments of EL-Galaa Armed Forces
Hospital for their help and support.
References
[1] Ponikowski P, Anker S D, AlHabib K F, Cowie M R, Force T L, Hu S, Jaarsma T, Krum H, Rastogi
V, Rohde L E, Samal U C, Shimokawa H, Budi Siswanto B, Sliwa K and Filippatos G 2014 ESC
Heart Fail. 1 4–25
[2] Sulaiman K, Panduranga P, Al-Zakwani I, Alsheikh-Ali A A, AlHabib K F, Al-Suwaidi J, Al-
Mahmeed W, AlFaleh H, Elasfar A, Al-Motarreb A, Ridha M, Bulbanat B, Al-Jarallah M,
Bazargani N, Asaad N and Amin H 2015 Eur. J. Heart Fail. 17 374–384
[3] Reant P, Dijos M, Donal E, Mignot A, Ritter P, Bordachar P, Dos Santos P, Leclercq C, Roudaut
R, Habib G and Lafitte S 2010 Eur. J. Echocardiogr. 11 834–844
[4] Dehkordi P, Khosrow-Khavar F, Di Rienzo M, Inan O T, Schmidt S E, Blaber A P, Sørensen K,
Struijk J J, Zakeri V, Lombardi P, Shandhi M M H, Borairi M, Zanetti J M and K 2019 Front.
Physiol. 10 1057
[5] Meijer J H, Boesveldt S, Elbertse E and Berendse H W 2008 Physiol. Meas. 29 S383–S391
[6] Umar F and Leyva F 2012 Circ. J. 76 590–590
[7] Corȋci O M, Tănasie C A, Alexandru D, Florescu M, Comănescu M V, Kamal K C, S¸tefăni¸tă T¸
enea Cojan T, Iancaŭ M and Dinescu S N 2018 Rom. J. Morphol. Embryol. 59 1 93–103
8ICATAS-MJJIC 2020 IOP Publishing
IOP Conf. Series: Materials Science and Engineering 1051 (2021) 012017 doi:10.1088/1757-899X/1051/1/012017
[8] Su H M, Lin T H, Hsu P C, Chu C Y, Lee W H, Chen S C, Lee C S, Voon W C, Lai W T and Sheu
S H 2013 PLoS One 8 1–8
[9] Carvalho P, Paiva R P, Couceiro R, Henriques J, Quintal I, Muehlsteff J, Aubert X L and Antunes
M 2009 Conf. Proc. IEEE Eng. Med. Biol. Soc. pp 3124–3128
[10] Yang Y F, Chou Y S and Wang J Y 2020 Future Trends in Biomedical and Health Informatics and
Cybersecurity in Medical Devices (Springer International Publishing) pp 363–370
[11] Tavakolian K 2016 Cardiovasc. Eng. Techn. 7 118–125
[12] Pan J and Tompkins W J 1985 IEEE. Trans. Biomed. Eng. 32 230–236
[13] Sedghamiz H 2020 Complete Pan Tompkins implementation ECG QRS detector, URL :MATLAB
Central File Exchange
[14] Schafer R W 2011 IEEE Signal Process. Mag. 28 111–117 ISSN 1558–0792
[15] Krishnan P T, Balasubramanian P and Umapathy S 2020 Phys. Eng. Sci. Med. 43 505–515
[16] Gibbons J D and Chakraborti S 2011 Nonparametric statistical inference 5th ed (Chapman and
Hall/CRC) ISBN 9781420077612
[17] Bland J M and Altman D G 1999 Stat. Methods Med. Res. 8 135–160 pMID: 10501650
[18] Klein R 2020 Bland-altman and correlation plot, URL :MATLAB Central File Exchange
[19] Shapiro S S and Wilk M B 1965 Biometrika 52 591–611
9You can also read