Analysis of the Noise Reduction Characteristics of a Diffuser with Fizeau Interferometry
←
→
Page content transcription
If your browser does not render page correctly, please read the page content below
Hindawi
International Journal of Optics
Volume 2021, Article ID 3806340, 13 pages
https://doi.org/10.1155/2021/3806340

Research Article
Analysis of the Noise Reduction Characteristics of a Diffuser with
Fizeau Interferometry

 Hongjun Wang, Xueliang Zhu , Bingcai Liu , and Ailing Tian
 Xi’an Technological University, International Center for Optical Research and Education (iCORE), No. 2 Xuefu Middle Road,
 Xi’an, Shaanxi 710021, China

 Correspondence should be addressed to Xueliang Zhu; zhuxueliang@xatu.edu.cn

 Received 20 August 2020; Revised 12 January 2021; Accepted 17 February 2021; Published 23 February 2021

 Academic Editor: Adrian Podoleanu

 Copyright © 2021 Hongjun Wang et al. This is an open access article distributed under the Creative Commons Attribution
 License, which permits unrestricted use, distribution, and reproduction in any medium, provided the original work is
 properly cited.

 To solve the coherent noise problem of an interference image, the method of a rotating diffuser was adopted to change the
 coherence of a beam to reduce the noise of the interference system. The relationship between the speed of the diffuser and
 the signal-to-noise ratio (SNR) of the fringe contrast system was simulated to obtain the diffuser control parameters
 needed for the best interference fringe state. The fringe contrast of each image and the SNR of the system were analyzed.
 The results showed that the increased speed of the diffuser reduced the contrast of the interference image to a certain
 extent, but the increased speed also effectively improved the SNR and facilitated the subsequent interference image
 processing. Due to the coherent noise in the interferometric system, the method of the rotated diffuser reduced the
 coherence of the light beam to suppress the noise of the interference image. By analyzing the coherent noise reduction
 characteristics of the rotated diffuser with different surface roughnesses, the relationship between the surface roughness
 and the noise contrast for different rotation speeds was simulated, and the effective roughness range with the noise
 reduction effect was selected. A noise reduction system was built based on Fizeau interference, and the noise contrast of the
 interference image was collected and calculated. The effective range of σ h/λ was 0.2–0.5 when the rotation speed was 10 r/s,
 while the effective range of σ h/λ was 0.4–0.6 when the rotation speed was 100 r/s. The experimental results showed that the
 surface roughness and wavelength ratio σ h/λ of the rotated diffuser increased when the noise contrast tended toward 1, but
 the effective range of the surface roughness decreased with the increase of the rotational speed of the diffuser.

1. Introduction fiber coupling is used to produce phase changes, optical
 wedges are used to change optical paths, and moving scatter
In an interference system, the defects on the surface of the or phase shifters are used to reduce laser coherence [3, 4]. In
optical element (such as depression, bubbles, dust, and scars) 1970, Asakura [5] studied the spatial coherence of a laser
are a new light source. As a laser has a high degree of co- passing through a rotating ground glass. In 1980, Kwon et al.
herence, a large amount of coherent noise is generated by the [6] studied the relationship between the contrast of infrared
light source formed by defects, which creates Newton rings interference fringes and surface roughness. In 1983, Har-
in the interferogram, thus affecting the quality of the in- walkar [7] et al. carried out theoretical and experimental
terferogram and further affecting the interference image research on the scattered light passing through rotating
processing, forming a measurement error [1, 2]. The co- ground glass. Chen [8] used the phase-shifting algorithm to
herent noise that affects the interference result is the intrinsic calculate infrared interference fringe contrast and verified
noise of the system. The suppression of intrinsic noise is a the theoretical relationship between the fringe contrast and
difficult problem in interferometer design. Therefore, to the surface roughness. In 2000, Ziraki et al. [9] applied a
suppress intrinsic noise, many efforts have been made by rotating diffuser to a holographic system to suppress speckle
experts and scholars over the years. For example, multiple noise. Pitter et al. [10] used a rotating diffuser for heterodyne
2 International Journal of Optics

interference microscopy to suppress coherent noise in co- were constants. Then, exp[iΦd (r, θ0 − ωt)] was just a
herent whole-field microscope images in 2004. Morris et al. function of the time t in equation (1).
[11] added a rotating diffuser in an interference system and It was assumed that the imaging lens magnification was
then effectively reduced the coherence of the light source in 1. Then, the light field U(x1 , y1 , t) on the CCD was expressed
2010. In 2011, Xu et al. [12] and others calculated the sta- with
tistical characteristics of the rotating ground glass in an ∞
interference system. Chen et al. [13] studied the use of a U x1 , y1 , t � B k x + x1 , y + y1 u(x, y, t) dxdy.
rotating diffuser in projection systems to reduce speckle
 −∞
distortion in 2012. In 2014, Qiao et al. [14] studied the
denoising effect of rotating ground glass in a holographic (2)
system. In 2015, Wang Sen and others studied the effect of In the equation, k(x, y) is the amplitude point spread
the rotational speed of ground glass on the imaging quality function of an imaging system. According to the speckle
of a thermal ghost. These results showed that the intrinsic interference theory, the coherent time of the speckle, τ c [15],
noise of the system could be reduced and the SNR of the is
system could be improved by using the rotating ground
glass. 8λz
 τc � . (3)
 In this research, the noise reduction performance of the 3π2 ωrD
diffuser in a large-diameter Fizeau interferometer was
mainly analyzed to improve the SNR of the interference In the equation, z is the distance between the diffuser and
image and improve the quality of the interference image. The the pupil of the imaging system, D is the entrance pupil
optical modulation theory of diffuser was studied, included diameter, and λ is the wavelength. Within the exposure time
the theory of modulation of rough surface and rotation T of the CCD, there are N � T/τ c different speckle images
speed, and simulated the effect of surface roughness and which could be acquired. When N was large enough, the
rotation speed on the noise suppression effect of the in- contrast of the speckle, Cn [15], was
 ��������
terference image. The system of noise suppression based on 1 8λz
Fizeau interference was built. According to the surface Cn ∝ √�� � 2 . (4)
 N 3π ωrDT
roughness and rotation speed of the diffuser, the noise
suppression results of the interference image were verified. According to the interference theory, the contrast of the
The noise contrast and image SNR were compared with the interference fringes, Cs [15], was
simulation results.
 τ RT 3π2 ωrDτ RT
 Cs ∝ sin c � sin c . (5)
 τc 8λz
2. Theoretical Analysis
 In the equation, τ RT is the time delay of the test light and
2.1. Fizeau Interferometer. To eliminate coherent noises, the the reference light. The ratio of the interference fringe contrast
rotating diffuser was placed near the focal plane of the to the speckle contrast was defined as the signal-to-noise ratio
imaging system to modulate the interference beam that (SNR) of the interference system. Therefore, the SNR of the
entered the imaging system, as shown in Figure 1. The terms interference system with a rotating diffuser could be written as
RF and TF shown represent the reference mirror and the test
mirror, respectively. The light emitted by the laser passed 2
 Cs sin c 3π ωrDτ RT /8λz
through the spatial filter to form a point light source and SNR � ∝ ������������ . (6)
then through the beam expander to form a parallel light.
 Cn 8λz/3π2 ωrDT
After the parallel light passed through the reference mirror From equation (6), it could be seen that the SNR of the
and the test mirror, an interference pattern was formed on interference system was related to the rotational angular
the CCD. velocity of the diffuser, the exposure time of the detector, and
 the delay time of the different light path.
2.2. The Influence of the Diffuser Rotation Speed on the In-
terference Pattern. It was assumed that the incident wave- 2.3. The Influence of the Diffuser Surface Roughness on the
front of diffuser was u0 (x, y), the phase introduced by the Interference Pattern. To study the corresponding relation-
diffuser was Φd , and the diffuser rotated around O at the ship between the noise contrast and the surface roughness of
angular velocity ω. Then, at time t, the wavefront u (x, y, t) diffuser, it was assumed that the scattering types were surface
could be expressed as scattering, as shown in Figure 3.
 u(x, y, t) � u0 (x, y)exp iΦd r, θ0 − ωt . (1) Figure 4 shows a reflection light path diagram in a free
 space, for which n is a unit vector indicating the direction of
 In the equation, r is the distance between the center of the average normal surface, i is a unit vector representing the
rotation and the point of incidence of light and θ0 is the direction of the incident light, and o is the unit vector
initial angle of rotation of the diffuser. The spot position was showing the direction of the observation point on the right
as shown in Figure 2. During the measuring process, r and ω plane.
International Journal of Optics 3

 When the light was perpendicularly incident on the phase was added to α that represented the phase delay that
surface of the diffuser, at any point on the surface, the phase spread the surface and scattered from the surface:
delay Φ(α, β) associated with propagating to the surface and
scattering from the surface was as follows [15]: a(α, β) � rS(α, β)ejΦ(α,β) , (13)

 2π where r denotes the average amplitude reflectivity of the
 Φ(α, β) � [1 +( o · n )]h(α, β), (7)
 λ surface and S (α, β) indicates the complex amplitude of the
 illumination over the entire scattered spot and Φ represents
where n is the normal outward of the surface and o is the unit the dot product in the expression, which was
vector pointing to the observation point. For paraxial im-
aging, o · n � 1, equation (7) could be simplified to 2π
 Φ(α, β) � (−i · n + o · n ) · h(α, β). (14)
 4π λ
 Φ(α, β) � h(α, β). (8)
 λ When the illumination direction or observation direc-
 tion deviated from the surface normal, the height fluctuation
 It was assumed that the incident intensity was 1 and the of the surface decreased due to the perspective relationship.
light transmittance was 1, so the outgoing light a (α, β) The relationship between the variance σ 2ϕ of the phase shift
depended on the distribution of the rough surface and the and the variance σ 2h of the surface height fluctuation was
expression was as follows:
 2
 2π
 4π
 (9) σ 2ϕ � (−i · n + o · n ) σ 2h . (15)
 a(α, β) � exp[jΦ(α, β)] � exp j h(α, β) . λ
 λ
 The relationship between the phase shift correlation
 If the focal distances of the two lenses were the same, the
 function ΓΦ (∆α, ∆β) and the normalized correlation
magnification of the imaging system was 1, and the image
 function μh (Δα, Δβ) of the surface height fluctuation was
A(x, y) in the (x, y) coordinate could be written as a
convolution: ΓΦ (Δα, Δβ) � σ 2ϕ μh (Δα, Δβ). (16)
 ∞

 A(x, y) � B h(x − α, y − β)a(α, β)dαdβ. The normalized autocorrelation function of the light
 (10)
 field was
 −∞
 μα (Δα, Δβ) � exp j φ1 − φ2 . (17)
 The relationship between the point spread function
h(α, β) and the pupil function P(ξ, η) of the imaging system Then, a mathematical hypothesis was made about the
was relative function μh of the surface height fluctuations:
 ∞ 2
 1 2π r
 h(α, β) � B P(ξ, η)exp j · (αξ + βη) dξdη. μh (Δα, Δβ) � exp⎡⎣− ⎤⎦, (18)
 λ · f2 λ·f rc
 −∞ ���������
 (11) where r � Δα2 + Δβ2 , and rc is the radius of the normalized
 surface correlation down to 1/e. Therefore,
 It was assumed that the system had no aberrations, so P
 2
(ξ, η) � p (ξ, η) was a real value. It was also assumed that p ⎧ 2⎧
 ⎨ ⎨ r ⎤⎦⎫
 ⎬⎫⎬
 ⎣
 ⎡
 μα (Δα, Δβ) � exp⎩ −σ φ ⎩ 1 − exp − ⎭ ⎭ . (19)
was 1 at the origin and the point spread function h was a real r c
value.
 The relationship between the surface roughness σ and The surface height of the diffuser was fluctuant, and r was
the noise contrast C could be obtained as follows: the displacement of the coherent noise. When the diffuser
 ���������������������������������� rotated, the coherent noise displacement was equal to the

 8(N − 1) · N − 1 + cosh σ 2ϕ sinh σ 2ϕ /2 product of the rotating speed of the diffuser and the ex-
 C� 2 . (12) posure time; that is, r � vt, as shown in Figure 5. By
 N N − 1 + exp σ 2ϕ
 substituting r � vt into equation (19), the following ex-
 pression could be obtained:
 Based on equation (12), it could be seen that the different
 2
surface roughnesses of the diffuser had different influences ⎨
 ⎧ ⎨
 ⎧ vt ⎬⎫
 ⎫ ⎬
on the noise contrast. We knew that the diffuser needed to be μα (Δα, Δβ) � exp⎩ −σ 2φ ⎩ 1 − exp⎡⎣− ⎤⎦⎭ ⎭ . (20)
 rc
in the state of rotation to play a role in noise suppression, but
the above theory did not consider the rotation speed, so the The spatial coherent area Aα of the nonspecular re-
effects of different surface roughnesses on the noise sup- flection components was
pression were analyzed for different rotation speeds, as ∞
described next.
 Aα � 2π ]2 tμα (t)dt. (21)
 It was assumed that the complex amplitude α (α, β) of the
 0
scattered wave above the surface was related to the surface
height through a purely geometrically similar relationship. A Hence,
4 International Journal of Optics

 Rotated
 diffuser RF TF
 BS
 y

 CCD
 z

 Imaging lens

 Beam
 expander
 Spatial
 filter

 Laser

 Figure 1: Fizeau interferometer with rotated diffuser.

 y

 ω

 θ0–ωt

 x

 Figure 2: Spot position.

 (α, β) (ζ, η) (x, y)
 Laser
 ,

 L L

 Rough Pupil Image
 surface
 Figure 3: Imaging light path diagram for rough surface noise suppression.
International Journal of Optics 5

 Observed area speed slowed down with the increase of the rotational speed
 Surface
 of the diffuser. According to equation (6), the relationship
 View between the rotation speed of the diffuser, the contrast of the
 direction fringe and speckle, and the signal-to-noise ratio of the
 o⌃ system could be simulated, as shown in Figures 6(b)–6(d).
 Spot Normal Figure 6(b) shows that the image SNR was improved with
 n⌃ direction
 the increase of the diffuser speed. When the diffuser speed
 was in the 40 r/s–90 r/s, fringe contrast was between
 0.999–0.994, the relative value of decline was not obvious,
 l⌃ and more fringe information was retained. At the same time,
 Incident the relative value of the speckle contrast was between 0.5 and
 direction 0.3. Compared with the relative value of the fringe contrast,
 Figure 4: Free space reflection light path diagram [15]. the decrease trend was obvious, indicating that properly
 increasing the rotational speed of diffuser could effectively
 suppress the coherent noise of the interference image.
 2πe− σ(2/φ) ∞
 2
 Aα � −σ 2φ
 v2 t exp σ 2φ exp vt /rc 1 dt
 1−e 0
 (22) 3.3. Relationship between the Rotation Speed of the Diffuser
 − σ 2φ 2 2
 Ei σ φ ε ln σ φ and the Image Quality. Equation (24) describes the effect of
 πe
 � 2 2 . the different surface roughnesses on the coherent noise
 1 − e−σ φ V contrast at different rotation speeds when N0 was equal to 5,
 Here, Ei (x) is the exponential integral function and ε is 10, 100, and 1000. The effect of different N0 to noise contrasts
the Euler constant. The number N′ of these completely at different rotation speeds was simulated in the range of
incoherent noise fields is the ratio of the spatial coherence σ h⁄ λ (surface height standard deviation of wavelength
area Ak and the total illumination area Aα; it was found that normalization) equal to 0.2–0.68. The simulated relationship
 curves are shown in Figures 7 and 8.
 2
 ]2 N0 eσ ϕ − 1 Figure 7 shows the relationship between the noise
 N′ � . (23) contrast C and the surface roughness at different rotational
 2
 Ei eσ ϕ − ε − ln σ 2ϕ speed v and N0. It can be seen from the figure that (1) for an
 ideally flat surface (σ h/λ � 0), the noise contrast was 0; (2) as
 Bringing equation (23) into equation (12) produced a σ h/λ increased, the contrast was finally saturated at 1; and (3)
new numerical relationship between the surface roughness as the rotational speed of the diffuser increased, the surface
of the diffuser and the noise contrast: roughness corresponding to the saturated contrast also
 ���������������������������������� increased.

 8 N′ − 1 N′ − 1 + cosh σ 2φ sinh σ 2φ /2 The relationship between the noise contrast C and N0,
 C� 2 . (24) different rotation frequencies v, and σ h/λ for different dif-
 N′ N′ − 1 + exp σ 2φ fusers is shown in Figure 8. It can be seen from the figure that
 for a small roughness value, the contrast C first increased
 with the parameter N0 and then finally approached zero
3. Simulation continuously. This was caused by the different dependence
 of the mirror reflection component and the diffuser com-
3.1. System Parameter. According to the measurement ponent of light on the value of N0. Especially in the light
principle, the Fizeau interference experiment system was path, the mirror reflection component in the reflected light
built. The time delay τ RT between the testing light path and always appeared in the form of a small light spot on the
the reference light path was 4.76 × 10− 9 s, the exposure time optical axis in the focal plane of the first lens, while the
T of the CCD was 1/714s, the pupil diameter D was 7 mm, diffuser light filled the entire pupil. It was necessary to
the wavelength λ was 650 nm, and the distance r between the change the size of the pupil to change N0 and to decrease the
center of rotation and the diameter of the incidence light was pupil to increase N0. As the mirror reflection component
20 mm. was always limited to the optical axis region, the mirror
 reflection component was not affected when the diameter of
 the pupil was reduced. However, the average intensity of the
3.2. Relationship between the Rotation Speed and the Image scattered light that was transmitted decreased in proportion
Quality. The relationship between the rotation speed of the to the pupil area as the pupil shrank. Therefore, when the
diffuser and the coherent time could be calculated according value of σ h/λ was small, N0 increased from 1 or more so that
to equation (3), as shown in Figure 6(a). As can be seen from the noise contrast increased from zero. Additionally, when
Figure 6(a), the coherent time decreased gradually as the N0 finally increased further, the σ I decreased and I remained
rotational speed of the diffuser increased, and the falling constant, so the contrast decreased. Finally, when the pupil
6 International Journal of Optics

 r vt

 (a) (b)

 Figure 5: Displacement of the coherent noise.

 ×10–6 3.5
 7
 3
 6

 SNR/SNR (f = 10r/s) 2.5
 5
 Coherent time (s)

 4 2

 3
 1.5

 2
 1
 1
 0.5
 0 10 20 30 40 50 60 70 80 90 100
 10 20 30 40 50 60 70 80 90 100 f r/s
 f r/s
 (a) (b)
 1 1

 0.999 0.9
 0.998
 0.8
 Cn/Cn (f = 10r/s)
 Cs/Cs (f = 10r/s)

 0.997
 0.7
 0.996
 0.6
 0.995
 0.5
 0.994

 0.993 0.4

 0.992 0.3
 10 20 30 40 50 60 70 80 90 100 10 20 30 40 50 60 70 80 90 100
 f r/s f r/s
 (c) (d)

Figure 6: The influence of the rotation frequency on the image quality. (a) The influence on the coherent time. (b) The influence on the SNR.
(c) The influence on the contrast of the fringes. (d) The influence on the speckle contrast.
International Journal of Optics 7

 1 1 1

 0.8 0.8 0.8

 0.6 0.6 0.6
 C C C
 0.4 0.4 0.4

 0.2 0.2 0.2

 0 0 0
 0 0.2 0.4 0.6 0.8 1 0 0.2 0.4 0.6 0.8 1 0 0.2 0.4 0.6 0.8 1
 σh/λ σh/λ σh/λ

 N0 = 5 100 N0 = 5 100 N0 = 5 100
 10 1000 10 1000 10 1000

 (a) (b) (c)

 Figure 7: The relationship between the contrast C and σ h/λ at different speeds v and N0. (a) V � 10 r/s. (b) V � 50 r/s. (c) V � 90 r/s.

 1 1 1

 0.8 0.8 0.8

 0.6 0.6
 0.6
 C C C
 0.4 0.4
 0.4
 0.2 0.2
 0.2
 0 0
 0 20 40 60 80 100 0 20 40 60 80 100 0 20 40 60 80 100
 N0 N0 N0

 σh/λ = 0.2 0.5 σh/λ = 0.4 0.6 σh/λ = 0.55 0.66
 0.3 0.55 0.5 0.64 0.6 0.675
 0.4 0.55 0.63

 (a) (b) (c)

 Figure 8: The relationship between the contrast C and N0 at different speeds v and σ h/λ. (a) V � 10 r/s. (b) V � 50 r/s. (c) V � 90 r/s.

size was small enough, both the scattered light and the also shown that the rotating diffuser could reduce the
reflected light were affected, and the noise contrast C did not contrast of the interference image while suppressing the
fall with N0. coherent noise but improving the signal-to-noise ratio of the
 image. The interference images at different rotational speeds
4. Experimental Study of the diffuser are shown in Figure 12. It can be seen from the
 figure that with the increase of the rotational speed of the
As shown in Figure 9, in the constructed Fizeau interference diffuser, although the contrast of the image was reduced to a
system, the diffuser was placed near the focus of the imaging certain extent, the signal-to-noise ratio of the image was
system, and its roughness was 0.3668 µm. Figure 10 shows improved and the coherent noise was effectively suppressed.
the diffuser used in the experiment. The diameter of the For the condition of invariance in the diffuser surface
diffuser was 50 mm, and the thickness was 3 mm. roughness, the rotation speed of the motor was adjusted, and
 To test different surface roughnesses of the diffuser for the interference images were acquired for different rotation
the noise suppression effect, a series of different roughnesses speeds. Due to the need to analyze the influence of different
of the diffuser was used. The roughness of the diffusers was surface roughnesses on the noise contrast, the intervention
measured by Taylor Hobson PGI Optics Profilometer, as had to be separate. The Wiener filtering method was used to
shown in Table 1. separate the image noise, and then the noise contrast for
 Based on the noise estimation processing, for the case of different rotation speeds was as shown in Figure 13.
the known surface roughness, for different speeds of the As can be seen from Figure 13, the roughness of the
diffuser, the fringe contrast, speckle contrast, image contrast, diffuser could effectively suppress the noise increases with
and image SNR were as shown in Figure 11. As can be seen the increase of the rotation speed of the diffuser, but the
from Figure 11, as the rotational speed of diffuser gradually effective range of the roughness of the surface that could
increased, the fringe contrast, speckle contrast, and image effectively suppress noise gradually decreased, which was
contrast of the interference image all showed a downward highly consistent with the simulation results. When the
trend, while the image signal-to-noise ratio increased. It was rotation speed was 10 r/s, the effective range of σ h /λ was
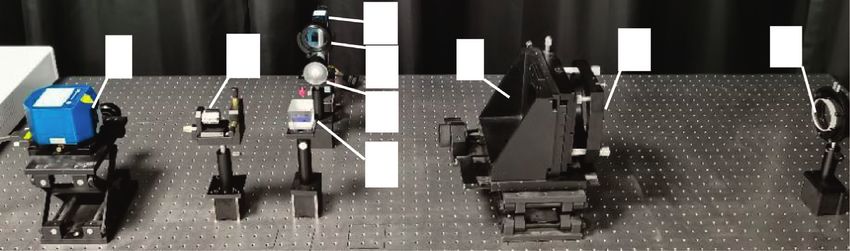
8 International Journal of Optics

 9
 1 2 5 6
 8 4

 7

 3

Figure 9: Experimental setup. 1, laser; 2, microscope objective; 3, beam splitter; 4, collimating lens; 5, reference flat; 6, testing flat; 7, diffuser;
8, imaging lens 9-CCD.

 Figure 10: Diffuser.

 Table 1: Diffuser with different surface roughnesses.
σ h /λ Designed RMS roughness (nm) Actual RMS roughness (nm) Error (nm)
0.2 126.56 135.9 9.34
0.3 189.84 199.8 9.96
0.35 221.48 216.7 −4.83
0.4 253.12 244.4 −8.7
0.47 297.4 300.3 2.9
0.5 316.4 305.1 −11.3
0.6 379.68 390.3 10.62
0.7 442.96 458.7 15.74

 1.04 1.2

 1.035
 1.1
 1.03
 1
 SNR/SNR (f = 10r/s)

 1.025
 C/C (f = 10r/s)

 1.02 0.9

 1.015 0.8
 1.01
 0.7
 1.005
 0.6
 1

 0.995 0.5
 10 20 30 40 50 60 70 80 90 100 10 20 30 40 50 60 70 80 90 100
 f r/s f r/s
 (a) (b)
 Figure 11: Continued.
International Journal of Optics 9

 1 1

 0.95
 0.9
 0.9
 0.8

 Cn/Cn (f = 10r/s)
 Cs/Cs (f = 10r/s)

 0.85

 0.8 0.7

 0.75
 0.6
 0.7
 0.5
 0.65

 0.6 0.4
 10 20 30 40 50 60 70 80 90 100 10 20 30 40 50 60 70 80 90 100
 f r/s f r/s
 (c) (d)

Figure 11: The relationship between the rotated diffuser and the parameters. (a) The influence on the SNR of the image. (b) The influence on
the image contrast. (c) The influence on the contrast of the fringes. (d) The influence on the speckle contrast.

 (a) (b) (c) (d)

 (e) (f ) (g) (h)

Figure 12: The interference image for different speeds of the rotated diffuser. (a)f � 10 r/s. (b)f � 20 r/s. (c)f � 30 r/s. (d)f � 40 r/s.
(e)f � 50 r/s. (f )f � 60 r/s. (g)f � 70 r/s. (h)f � 80 r/s.

between 0.2 and 0.6. When the rotation speed was 100 r/s, field was full of noise, which had no function of restraining
the effective range of σ h /λ was between 0.4 and 0.6. The noise but did seriously affect the quality of the interference
smaller the value of σ h /λ, the smaller the contrast of the noise image. There was a large error between the actual surface
and the less obvious the effect of the noise reduction. roughness and the designed surface roughness of the diffuser
However, when σ h /λ was bigger, the surface scattering used in the experiment, leading to a large error in the
characteristics of the diffuser were better. The entire light numerical value between the experimental result and the
10 International Journal of Optics

 1 1
 0.9 0.9
 0.8 0.8
 0.7 0.7
 0.6 0.6
 C 0.5 C 0.5
 0.4 0.4
 0.3 0.3
 0.2 0.2
 0.1 0.1
 0 0
 0 0.1 0.2 0.3 0.4 0.5 0.6 0.7 0.8 0.9 1 0 0.1 0.2 0.3 0.4 0.5 0.6 0.7 0.8 0.9 1
 σh/λ σh/λ
 Theoretical noise contrast Theoretical noise contrast
 Experimental noise contrast Experimental noise contrast
 Curve fitting of experimental Curve fitting of experimental
 noise contrast noise contrast
 (a) (b)
 1 1
 0.9 0.9
 0.8 0.8
 0.7 0.7
 0.6 0.6
 C 0.5 C 0.5
 0.4 0.4
 0.3 0.3
 0.2 0.2
 0.1 0.1
 0 0
 0 0.1 0.2 0.3 0.4 0.5 0.6 0.7 0.8 0.9 1 0 0.1 0.2 0.3 0.4 0.5 0.6 0.7 0.8 0.9 1
 σh/λ σh/λ
 Theoretical noise contrast Theoretical noise contrast
 Experimental noise contrast Experimental noise contrast
 Curve fitting of experimental Curve fitting of experimental
 noise contrast noise contrast
 (c) (d)
 Figure 13: Continued.
International Journal of Optics 11

 1 1
 0.9 0.9
 0.8 0.8
 0.7 0.7
 0.6 0.6
 C 0.5 C 0.5
 0.4 0.4
 0.3 0.3
 0.2 0.2
 0.1 0.1
 0 0
 0 0.1 0.2 0.3 0.4 0.5 0.6 0.7 0.8 0.9 1 0 0.1 0.2 0.3 0.4 0.5 0.6 0.7 0.8 0.9 1
 σh/λ σh/λ
 Theoretical noise contrast Theoretical noise contrast
 Experimental noise contrast Experimental noise contrast
 Curve fitting of experimental Curve fitting of experimental
 noise contrast noise contrast
 (e) (f )
 1 1
 0.9 0.9
 0.8 0.8
 0.7 0.7
 0.6 0.6
 C 0.5 C 0.5
 0.4 0.4
 0.3 0.3
 0.2 0.2
 0.1 0.1
 0 0
 0 0.1 0.2 0.3 0.4 0.5 0.6 0.7 0.8 0.9 1 0 0.1 0.2 0.3 0.4 0.5 0.6 0.7 0.8 0.9 1
 σh/λ σh/λ
 Theoretical noise contrast Theoretical noise contrast
 Experimental noise contrast Experimental noise contrast
 Curve fitting of experimental Curve fitting of experimental
 noise contrast noise contrast
 (g) (h)
 Figure 13: Continued.
12 International Journal of Optics

 1 1
 0.9 0.9
 0.8 0.8
 0.7 0.7
 0.6 0.6
 C 0.5 C 0.5
 0.4 0.4
 0.3 0.3
 0.2 0.2
 0.1 0.1
 0 0
 0 0.1 0.2 0.3 0.4 0.5 0.6 0.7 0.8 0.9 1 0 0.1 0.2 0.3 0.4 0.5 0.6 0.7 0.8 0.9 1
 σh/λ σh/λ
 Theoretical noise contrast Theoretical noise contrast
 Experimental noise contrast Experimental noise contrast
 Curve fitting of experimental Curve fitting of experimental
 noise contrast noise contrast
 (i) (j)

Figure 13: Effect of the surface roughness on the noise contrast at different rotational speeds. (a) V � 10 r/s. (b) V � 20 r/s. (c) V � 30 r/s. (d)
V � 40 r/s. (e) V � 50 r/s. (f ) V � 60 r/s. (g) V � 70 r/s. (h) V � 80 r/s. (i) V � 90 r/s. (j) V � 100 r/s.

simulation result. However, the experimental result was Acknowledgments
generally consistent with the simulation result, with a good
consistency. This research was financially supported by the China Re-
 search Project (Grant no. JSZL2018411C001) and Shaanxi
 Science and Technology Department Research Project
5. Conclusion (Grant no. 2020GY-045). The authors thank LetPub (http://
 www.letpub.com) for its linguistic assistance during the
In this research, the relationship between the rotating speed preparation of this manuscript.
of the diffuser in the Fizeau interferometer and the contrast
of the interference fringes, speckle contrast, image contrast,
SNR, and coherent time was analyzed and verified with References
experiments. The experimental results showed that the noise [1] G. Huang, Research on Fizeau Phase-Shifting Laser interfer-
of the interference system was obviously suppressed by ometer, Harbin Institute of Technology, Harbin, China, 2011.
adding the rotating diffuser in the interference system. At the [2] M. Kuechel, “Apparatus and method for reducing the effects
same time, the fringe contrast of the interference image of coherent artifact in an interferometer,” United Stated
decreased with the increase of rotational speed, and the patents: 6804011, 2004.
image signal-to-noise ratio was improved, which showed the [3] Z. Chen, J. Li, and Y. Chen, “A practical method to suppress
consistency of the experimental results and the simulation laser speckle noise in coherent imaging system,” Chinese
results. Therefore, when a rotating diffuser was used to Journal of Lasers, vol. 12, no. 12, pp. 726–728, 1985.
reduce the noise of the interference system, we had to choose [4] W. Wu, LRCS of Absorbing Coating Target under Coherent and
the appropriate surface roughness and the matching rotation Partially Coherent Light, XIdian University, Xi’an, China,
speed. The noise contrast ratio had to be properly reduced so 2014.
that the quality of the interference image could be optimized. [5] T. Asakura, “Spatial coherence of laser light passed through
 rotating ground glass,” Opto-electronics, vol. 2, no. 3,
 pp. 115–123, 1970.
Data Availability [6] O. Kwon, J. C. Wyant, and C. R. Hayslett, “Rough surface
 interferometry at 10.6 μm,” Applied Optics, vol. 19, no. 11,
The simulation analysis data used to support the findings of
 pp. 1862–1869, 1968.
this study are included within the article. The experimental [7] V. Harwalkar, H. Bohidar, and S. Chopra, “Theoretical and
measurement data used to support the findings of this study experimental investigations of light scattered from a rotating
are included within the article. ground glass,” Applied Physics B Photophysics and Laser
 Chemistry, vol. 31, no. 4, pp. 215–220, 1983.
Conflicts of Interest [8] L. Chen, Research on Infrared Fizeau Interferometer and
 Automatic Infrared Interferogram Processing, Nanjing Uni-
The authors declare that they have no conflicts of interest. versity of Science & Technology, Nanjing, China, 1996.
International Journal of Optics 13

 [9] M. Ziraki, R. Jones, P. M. W. French et al., “Whole-field
 coherent imaging through turbid media using Photorefractive
 holography],” Applied Physics B, vol. 70, no. 1, pp. 151–154,
 2000.
[10] M. C. Pitter, C. W. See, and M. G. Somekh, “Full-field het-
 erodyne interference microscope with spatially incoherent
 illumination,” Optics Letters, vol. 29, no. 11, pp. 1200–1202,
 2004.
[11] M. N. Morris, M. Naradikian, and J. Millerd, “Noise Re-
 duction in dynamic interferometery measurements,” Inter-
 ferometry XV: Techniques and Analysis, vol. 7790, Article ID
 77900, 2010.
[12] J. Xu, Z. Liu, Y. Du et al., “Statistical analysis of interferometric
 imaging system with rotating diffuser,” High Power Laser and
 Particle Beams, vol. 23, no. 3, pp. 702–706, 2011.
[13] C.-Y. Chen, W.-C. Su, C.-H. Lin, M.-D. Ke, Q.-L. Deng, and
 K.-Y. Chiu, “Reduction of speckles and distortion in pro-
 jection system by using a rotating diffuser,” Optical Review,
 vol. 19, no. 6, pp. 440–443, 2012.
[14] T. Qiao, Y. Yu, and W. Zhou, “A method to eliminate the
 noise of holographic system by using a rotated diffuser,”
 Optical Instruments, vol. 36, no. 4, pp. 337–341, 2014.
[15] J. W. Goodman, Speckle Phenomena in Optics-Theory and
 Application, Roberts & Company, Aurora, Canada, 2007.
You can also read